


Research disclosure: Sellforte designed and published this evaluation and is one of the vendors assessed. Claude and ChatGPT assigned the scores using public sources reviewed on September 8–14, 2026; this was not a hands-on product test. A score of zero means no public evidence was found under the methodology, not that a capability is absent. Vendors can submit documentation for re-evaluation at research@sellforte.com.
Quick Summary: Best MMM Solutions for Retail Brands in 2026
This research compares seven commercial MMM providers and two open-source frameworks against 69 criteria across ten categories. The criteria cover store and ecommerce outcomes, promotions, media granularity, modeling methods, calibration, planning, reporting, data integration, enterprise requirements and retail delivery experience.
Sellforte received the highest average total score at 60.8 out of 69. Ipsos MMA and Measured tied for second at 47.0.
The table shows the average recorded Claude and ChatGPT scores. Each criterion has equal weight, so categories with more criteria contribute more to the total. Use the category results to identify the requirements you need to verify in a vendor demonstration.
Research scores by vendor and category
Average scores assigned by Claude and ChatGPT, rounded to one decimal. Blue shading shows the proportion of available points received; green outlines identify the highest research scores, including ties. Shading and highest-score comparisons use unrounded scores.
| Research category | Sellforte | Ipsos MMA | Measured | Analytic Partners | Ekimetrics | Circana | Meridian | Meta Robyn | Kantar |
|---|---|---|---|---|---|---|---|---|---|
| Total research score / 69 | 60.8 | 47.0 | 47.0 | 42.8 | 40.0 | 39.3 | 37.8 | 34.0 | 33.8 |
| 1. Modeling store sales & other retail outcomes / 7 | 6.5 | 4.0 | 4.3 | 5.3 | 3.0 | 4.3 | 1.5 | 2.0 | 2.5 |
| 2. Promotions and other non-media drivers / 7 | 5.8 | 6.5 | 4.0 | 4.5 | 4.8 | 5.0 | 4.5 | 4.5 | 3.0 |
| 3. Media coverage & analytical granularity / 8 | 7.5 | 6.5 | 5.8 | 5.8 | 6.0 | 5.3 | 5.8 | 6.0 | 5.5 |
| 4. Modeling fundamentals / 8 | 6.5 | 4.8 | 7.0 | 4.0 | 5.8 | 3.8 | 7.5 | 7.5 | 5.3 |
| 5. Model calibration & Experiments / 6 | 5.8 | 4.8 | 4.0 | 3.0 | 2.5 | 3.0 | 4.5 | 3.8 | 0.3 |
| 6. Scenario planning & budget optimization / 8 | 7.0 | 5.8 | 4.5 | 6.3 | 5.0 | 5.3 | 5.5 | 4.0 | 5.5 |
| 7. Reporting, speed & decision workflows / 6 | 5.8 | 4.3 | 5.0 | 3.8 | 4.0 | 3.8 | 3.8 | 2.8 | 3.8 |
| 8. Data integration & quality / 7 | 6.3 | 4.5 | 4.3 | 4.5 | 4.0 | 4.0 | 4.8 | 3.5 | 3.0 |
| 9. Enterprise security & governance / 5 | 3.3 | 1.8 | 3.3 | 1.0 | 0.8 | 0.3 | N/A | N/A | 2.3 |
| 10. Retail experience, implementation & support / 7 | 6.5 | 4.3 | 5.0 | 4.8 | 4.3 | 4.8 | N/A | N/A | 2.8 |
Research takeaways by vendor
- Sellforte: 60.8/69. Highest total score, and highest scores in seven categories. Its strengths span modeling retail outcomes, media coverage & granularity, calibration and operating workflows. Sellforte is best for retailers and ecommerce businesses in the United States and Europe looking for high quality enterprise-grade measurement, granular campaign & ad set level optimization and real-time MMM insights.
- Ipsos MMA: 47.0/69. Tied second overall and the highest score for promotions and other non-media drivers. It also receives the second-highest media coverage score and the second-highest calibration score.
- Measured: 47.0/69. Tied second overall, with the highest modeling-fundamentals score among the seven commercial vendors. It ties Sellforte on enterprise security and governance and ranks second on reporting workflows and retail implementation and support.
- Analytic Partners: 42.8/69. Fourth overall, with the second-highest scores for retail outcomes and scenario planning. Its stronger criteria include customer-group measurement and combining advertising with commercial decisions.
- Ekimetrics: 40.0/69. Fifth overall. Its highest normalized category scores are media coverage and granularity, followed by modeling fundamentals. It receives full credit for carryover, saturation, confounding and marginal returns.
- Circana: 39.3/69. Sixth overall. Its strongest normalized category is promotions and other non-media drivers, followed by retail implementation and support. It receives full credit for availability and assortment, weather and allocation across brands.
- Meridian: 37.8/69. Seventh on the full framework and tied for the highest modeling-fundamentals score. It also ranks second on data integration and quality, reflecting documentation and tooling alongside gaps in ready-made retailer-system connections.
- Meta Robyn: 34.0/69. Eighth overall and tied with Meridian for the highest modeling-fundamentals score. It receives full credit for several model transparency and validation requirements and for calibration using platform lift results.
- Kantar: 33.8/69. Ninth overall. Its highest normalized scores are scenario planning and media coverage, followed by modeling fundamentals. The lowest category score is calibration and experiments.
Introduction and Table of Contents
A Marketing Mix Modeling solution in Retail needs to reflect how the business works. That can mean separate store and ecommerce modeling, product-category detail, promotion measurement and recommendations that fit the trading calendar. The team also needs reliable data feeds and a way to use the results regularly.
The evaluation framework used in this article draws on 1,100 customer and prospect discussions and our experience in participating in more than 100 RFPs and tender processes over the years. This article sets out the evaluation criteria, scoring instructions, criterion-level research scores by vendor scorecards. The detailed scoring workbook contains all 18 evaluations, with rationales and source URLs. The evaluation-instructions workbook provides the full definitions and rubric.
- Quick summary
- What is MMM for retail?
- Research methodology: evaluation criteria
- Research methodology: scoring
- Tools included in the evaluation
- In-depth comparison
- Summary by vendor
- Frequently asked questions
- Change log
- Evaluation dates and model versions
- Limitations and disclosures
- Further reading
- Author
What is Marketing Mix Modeling for Retail?
Marketing Mix Modeling (MMM) uses historical data to estimate how media and other drivers contribute to business outcomes. For retail, those outcomes can include store and ecommerce revenue, product-category sales, margin, and new or returning customer sales.
Discounts can raise sales while a campaign is running. Stock-outs can limit sales, and store openings can increase selling capacity. A retail MMM needs to account for these changes in the business and its trading environment to separate their effects from advertising.
MMM also estimates how media response changes with spending and over time. Response curves show diminishing returns and help guide budget allocation. Carryover captures effects that continue after the initial exposure. The estimates depend on variation in the available data and on the model's assumptions.
Incrementality testing can provide evidence for MMM calibration. Each experiment measures a particular intervention in a particular setting, so applying its findings to an MMM requires checking scope and uncertainty.
Research Methodology: Evaluation Criteria
This article follows Sellforte's Solution Research Objectives and Guiding principles: We first conducted primary research to form an evaluation framework. We then gave that framework to Claude and ChatGPT for conducting the vendor evaluation.
We evaluated each vendor and solution against the 69 criteria below, grouped into ten categories covering retail measurement and day-to-day use. To develop the criteria, we:
- Analyzed 1,100 customer and prospect discussions with marketers, marketing analytics professionals and data scientists to understand measurement and planning requirements.
- Reviewed our experience in more than 100 retail RFPs and tender processes that discussed requirements for marketing mix modeling solutions.
- Used desk research and LLM-assisted investigation to identify gaps and check the framework against public information.
The definitions specify the evidence each criterion requires and distinguish a documented capability from a broad product claim.
Read more about the evaluation criteria: How to choose a Marketing Mix Modeling solution in Retail.
Category 1. Modeling store sales & other retail outcomes
A retail campaign can generate purchases in stores and online, with different sales mixes by product category or customer group. These criteria check whether an MMM measures those outcomes separately and supports clearly defined net revenue, margin and customer lifetime value.
| ID | Criterion | What it means |
|---|---|---|
| 1.1 | Separately measures media impact on store and e-commerce sales | Estimates media contribution to physical-store and e-commerce sales, with distinct results for each sales channel. Uses actual retailer sales data for physical stores, obtained from POS systems, transaction feeds or data warehouses. |
| 1.2 | Measures how media drives each product-category | Estimates how each media channel drives each product group separately, using retailer-defined product categories |
| 1.3 | Measures cross-channel sales effects (digital media to offline sales, and vice versa) | Quantifies the sales impact of digital media separately for ecommerce sales and store sales. Quantifies the sales impact of offline media separately for ecommerce sales and store sales. |
| 1.4 | Support both gross and net revenue (after returns and cancellations) | Supports both gross (or demand) and net-sales outcomes with documented treatment of returns, refunds or cancellations and consistent revenue definitions across inputs and results. |
| 1.5 | Measures incremental profit or contribution margin | Calculates marketing impact and return using retailer-supplied margin or cost data, with the profit numerator and media-cost treatment defined. |
| 1.6 | Measures acquisition and retention by customer group | Reports incremental marketing outcomes separately for new and existing customers. Supports customer groups defined by the retailer. |
| 1.7 | Connects marketing impact to customer lifetime value | Combines incremental customer acquisitions with customer lifetime-value inputs to estimate marketing impact over a stated value horizon. |
Category 2. Promotions and other non-media drivers
Promotions, weather and store-network changes can affect sales while advertising is running. The model needs to separate these effects. Promotion halo and cannibalization describe how an offer affects sales of other products.
| ID | Criterion | What it means |
|---|---|---|
| 2.1 | Separates promotional uplift from media effects | Estimates promotional uplift separately from baseline and media |
| 2.2 | Separates effects of different promotion types | Estimates distinct effects for different promotional mechanisms, such as price discounts and customer-specific offers |
| 2.3 | Measures promotion halo and cannibalization | Estimates how promoted items or categories affect sales of other items or categories, including both positive halo and substitution losses. |
| 2.4 | Accounts for availability and assortment changes | Uses inventory, out-of-stock or assortment-change data to distinguish supply constraints and range changes from media performance. |
| 2.5 | Accounts for store-network changes | Models openings, closures, refurbishments or store coverage so changes in selling capacity are distinguished from marketing-driven growth. |
| 2.6 | Models retail seasonality and trading events | Accounts for recurring seasonality and retailer-relevant holidays or events, with support for local trading patterns and event timing. |
| 2.7 | Accounts for weather-driven demand | Uses relevant weather variables in MMM to separate weather effects from marketing response |
Category 3. Media coverage & analytical granularity
These criteria cover digital, traditional and owned media, and the detail available for decisions. Channel-level iROAS, campaign and ad-set level estimates, seasonal campaigns, geographic results and support for multiple businesses are assessed separately. Marginal returns estimate the return on additional spend.
| ID | Criterion | What it means |
|---|---|---|
| 3.1 | Measures incremental ROAS across digital channel types | Reports incremental ROAS separately for paid search, paid social, and display or online video |
| 3.2 | Measures incremental ROAS by digital campaign and ad set | Reports incremental ROAS for individual campaigns and ad sets or equivalent ad groups within Google Ads, Meta Ads and TikTok Ads. |
| 3.3 | Measures Incremental ROAS of traditional and offline media | Reports incremental ROAS for each offline media, including TV, Radio, Print, Out-of-home |
| 3.4 | Measures owned and CRM media | Estimates the incremental contribution of owned activity, with examples spanning CRM contact channels, email, SMS, organic social and catalogs. |
| 3.5 | Measures seasonal campaigns (e.g. back to school) | Estimates incremental ROAS for each seasonal campaign. |
| 3.6 | Provides geographic estimates below national level | Estimates marketing effects for regions, states, DMAs or store catchments and states the geographic modeling level and data conditions. |
| 3.7 | Supports multiple brands, markets and business units | Maintains differentiated MMM results across brands and markets |
| 3.8 | Provides marginal returns | Presents both incremental return on existing spend and marginal return on additional spend |
Category 4. Modeling fundamentals
MMM relies on assumptions about delayed effects, diminishing returns and the relationship between advertising and existing demand. This category examines documentation of those methods, model transparency, validation, diagnostics and uncertainty. Predictive fit alone cannot establish that an estimated media effect is causal.
| ID | Criterion | What it means |
|---|---|---|
| 4.1 | Models delayed and carryover media effects | Modeling methodology includes channel-specific lag or adstock treatment |
| 4.2 | Models saturation and diminishing returns | Modeling methodology includes nonlinear response curves that estimate how additional spend changes incremental outcomes as a channel saturates. |
| 4.3 | Exposes model assumptions and parameters | Provides customers with model specifications, relevant coefficients or response parameters, and the basis for priors or constraints so analysts can review the model. |
| 4.4 | Tests predictive performance on held-out data | Modeling methodology includes time-based holdout testing or backtesting with data excluded from fitting, and reports the horizon and validation metrics. |
| 4.5 | Provides model health diagnostics | Provides a customer-facing diagnostic report or view covering fit and residuals, plus method-appropriate checks such as convergence or parameter plausibility. |
| 4.6 | Addresses confounding and demand capture | Explains how pre-existing demand and media targeting can bias estimates, including paid-search demand capture, and documents controls or another identification strategy. |
| 4.7 | Handles sparse and correlated marketing activity | Documents pooling, regularization, aggregation or another approach for small datasets and overlapping campaigns, with limits on granularity or identifiability. |
| 4.8 | Reports uncertainty in incremental effects | Provides confidence or credible intervals for incremental contribution or ROI, with the interval level and interpretation stated. |
Category 5. Model calibration & Experiments
An experiment can inform an MMM when its outcomes, channels and time window are relevant to the model. These criteria cover calibration from retailer experiments, platform lift studies and other inputs. They also assess uncertainty, how conflicting measurement results are reconciled and how further tests are prioritized. Expert-reviewed manual calibration qualifies alongside automated workflows.
| ID | Criterion | What it means |
|---|---|---|
| 5.1 | Calibrates MMM using geo or first-party experiments | Uses results from geo holdouts, matched markets or retailer-run A/B tests to update MMM parameters, priors, constraints or response estimates when relevant new evidence becomes available. |
| 5.2 | Calibrates MMM using platform lift studies | Ingests conversion lift tests from ad platforms, and uses ad-platform conversion-lift results in MMM calibration |
| 5.3 | Calibrates MMM using incrementality factor benchmarks and attribution data | As additional calibration data, provides calibration inputs based on incrementality factors and attribution data. |
| 5.4 | Checks calibration relevance and uncertainty | Aligns experiment and MMM outcomes, channels, markets and time windows, and explains how experimental uncertainty and evidence age influence calibration. |
| 5.5 | Investigates disagreements between measurement methods | Provides a documented process to reconcile MMM, experiment and attribution results using aligned definitions, while retaining and explaining discrepancies. |
| 5.6 | Uses MMM uncertainty to prioritize further tests | Identifies channels or decisions where experiments would most improve MMM, using uncertainty and business impact to support a testing agenda. |
Category 6. Scenario planning & budget optimization
These criteria assess whether model estimates can be turned into feasible spending plans. They cover budget scenarios, allocation under a fixed budget, spending needed to reach a target, practical constraints, the trading calendar and allocation across businesses. Joint marketing and commercial scenarios are included, as are the limits shown around recommendations.
| ID | Criterion | What it means |
|---|---|---|
| 6.1 | Simulates changes to marketing budgets | Lets users change spend levels or channel mixes and forecast the resulting incremental and total business outcomes over a stated period. |
| 6.2 | Optimizes channel allocation for a set budget | Recommends a channel spending mix that maximizes a chosen business outcome using modeled response curves while keeping total expenditure at the specified amount. |
| 6.3 | Estimates budget required to reach a business target | Solves for spend required to meet a specified outcome or efficiency target and identifies infeasible targets or model limits. |
| 6.4 | Respects practical planning constraints | Allows users to set channel minimums, maximums or fixed commitments and incorporates those constraints into the recommended plan. |
| 6.5 | Optimizes spending across the trading calendar | Allocates spend across time periods using seasonal response, campaign timing and carryover, supporting tactical and longer-term planning. |
| 6.6 | Optimizes budgets across brands or business units | Recommends how a common marketing budget should be distributed across business units or markets using their respective response estimates and allocation constraints. |
| 6.7 | Combines marketing and commercial decisions in scenarios | Lets users assess changes in media spending together with a controllable business decision, such as pricing, and explains the relationships and assumptions used. |
| 6.8 | Shows uncertainty and limits in recommendations | Shows uncertainty or sensitivity around scenario outcomes and flags recommendations outside supported spend or data ranges. |
Category 7. Reporting, speed & decision workflows
Marketers need to review MMM results, understand changes in performance and act on recommendations between planning meetings. This category checks the interface, result updates, campaign recommendations, exports and natural-language analysis. A documented refresh cycle can be daily, weekly or monthly if it suits the decision.
| ID | Criterion | What it means |
|---|---|---|
| 7.1 | Provides self-service MMM exploration UI | Shows a marketer-facing interface for reviewing MMM results and drilling into relevant periods, channels and business dimensions without writing code. |
| 7.2 | Refreshes MMM to match decision cycles |
Documents recurring model refreshes or result updates using newly available data, with daily, weekly or monthly updates. |
| 7.3 | Explains changes in business performance | Provides period-to-period explanations of sales changes using media, promotions and baseline/context effects, distinguishing modeled explanations from causal claims about controls. |
| 7.4 | Recommends optimal spend and bidding parameters by campaign & ad set | Provides optimal spend and bidding parameters on the campaign & ad set level |
| 7.5 | Exports structured results for downstream analysis | Provides documented exports of granular MMM outputs and planning results in usable tables, plus an API or warehouse route for recurring downstream use. |
| 7.6 | Supports natural-language analysis of MMM results | Provides a conversational AI interface that answers questions using the customer’s MMM results and identifies the underlying data, period or scenario. |
Category 8. Data integration & quality
Retail MMM needs recurring feeds of sales, media and business data. The criteria cover advertising connectors, retailer-system connections, offline and custom feeds, retailer-defined taxonomies, validation, data specifications and preparation tools. They distinguish accepting a file from maintaining a recurring production integration.
| ID | Criterion | What it means |
|---|---|---|
| 8.1 | Automates digital media ingestion | Documents working, named advertising-platform connectors that retrieve MMM inputs on a recurring schedule, including spend and campaign metadata. |
| 8.2 | Connects to retailer sales and customer data | Documents recurring ingestion from retail commercial systems or data warehouses for store and e-commerce sales, with customer or transaction detail where needed. |
| 8.3 | Accepts offline media and custom business feeds | Supports agency data and custom retailer inputs through documented file templates, APIs, warehouse feeds or secure file transfer, with input fields explained. |
| 8.4 | Enables custom data taxonomy for sales and media data | Supports retailer-defined channel, campaign, objective, product group and geo taxonomies |
| 8.5 | Provides tools for data validation | Has tools for validating data, such visualization and automated checks |
| 8.6 | Provides data specifications | Publishes data specifications for Marketing Mix Modeling |
| 8.7 | Provides data cleaning, harmonization and aggregation tools | Documents tools for harmonizing, aggregating and cleaning data, such managing monthly offline data for an MMM with daily frequency |
Category 9. Enterprise security & governance
These five criteria examine documentation of encryption, independent security assurance, single sign-on, access controls and residency choices. Evidence must cover the relevant customer service or data flows. A general company statement may only partly establish what a particular MMM product supports.
| ID | Criterion | What it means |
|---|---|---|
| 9.1 | Encrypts stored and transmitted customer data | Public security documentation explains the encryption used for customer data during storage and transfer, including which services or data flows it covers. |
| 9.2 | Provides independent security assurance | Publicly identifies a relevant independent security assessment or certification, such as SOC 2 Type II or ISO 27001, and the covered organization or service. |
| 9.3 | Supports enterprise single sign-on | Publicly documents customer single sign-on through a named enterprise identity standard or supported identity provider. |
| 9.4 | Controls access by role and business scope | Documents role-based access with restrictions for relevant teams, agencies, brands or markets, including distinctions between viewing and editing. |
| 9.5 | Provides data residency choices | Supports storage and processing options at least between EU and US. |
Category 10. Retail experience, implementation & support
This category covers named retail MMM deployments, documented decisions and outcomes, implementation responsibilities, support, training, expert interpretation and commercial scope. Full credit on the deployment-count criterion requires five qualifying named retail MMM cases; customer logos alone do not count. A proposal process can document pricing without public list prices.
| ID | Criterion | What it means |
|---|---|---|
| 10.1 | Demonstrates 5+ named retail MMM deployments | Publishes named retail case studies describing actual MMM use and the retailer’s sales-channel or business context. Five or more qualifying cases score 1; one to four score 0.5. Customer logos alone do not count as qualifying cases. |
| 10.2 | Documents a retail decision and measured outcome | A retail case links an MMM insight to an implemented decision and a quantified outcome, stating the metric and comparison period or baseline. |
| 10.3 | Defines onboarding responsibilities and milestones | Publishes implementation stages, customer and vendor responsibilities, and indicative timing to first usable insights, including key data dependencies. |
| 10.4 | Provides ongoing support with clear coverage | Describes technical or user-support routes, service coverage and response or escalation arrangements relevant to the customer’s operating region. |
| 10.5 | Trains teams and supports adoption | Provides documented training, onboarding resources or role-specific enablement for marketers and analysts, including continued use after initial setup. |
| 10.6 | Provides expert interpretation and planning support | Describes access to MMM or retail analytics specialists for model review, business interpretation and recurring planning discussions. |
| 10.7 | Defines pricing basis and agreed service scope | Documents how buyers receive the charging basis and software, implementation, support and optional-module inclusions through standard terms or a custom proposal. Public list prices are not required; vendor-published evidence of commercial terms or proposal contents qualifies. Service-scope evidence without the charging basis supports partial credit. |
Research Methodology: Scoring
Scoring each tool against the evaluation criteria was done by Claude and ChatGPT. See specific LLM-model versions in Evaluation Dates by Vendor and LLM section. Here were the assessment steps:
Step 1. Both LLMs independently scored each criterion for each vendor, based on the instructions in this section.
Step 2. For the final score for each criteria, we used an average between the two LLMs, rounded to 1 decimal.
Step 3. Category scores were created by summing up the scores from each criteria in the category, and total score was calculated by by summing up the category scores.
Why is the scoring done by Claude and ChatGPT?
Simulating evaluation a buyer might make based on public materials. By using only vendor-provided materials on their website and technical documentation in the assessment, Claude and ChatGPT -based evaluation simulates how a buyer without prior knowledge of the vendor might assess the vendor prior to a sales call or demo meeting.
Transparent methodology and reproducible assessment. Because the evaluation instructions are published alongside this article, any reader can re-run the evaluation for any vendor and verify or challenge the results. This is a higher standard of transparency than conventional analyst-style research, where the scoring rationale is typically not disclosed.
Equal treatment of vendors. Claude and ChatGPT apply the same instructions, the same criteria, the same scoring scale, and the same source prioritization rules to every vendor in the comparison.
Instructions given to Claude and ChatGPT
Following instructions were given to Claude and ChatGPT for conducting the evaluation.
| ID | Instruction |
|---|---|
| 1 | You are an independent evaluator of Marketing Mix Modeling solutions for Retail. |
| 2 | Use evaluation criteria from sheet "Criteria". |
| 3 | In the evaluation, only use information available at the company website, and in the domain where technical documentation is located (if separately hosted). |
| 4 | Prioritize type of source materials in this order 1. Technical documentation (such as support center) 2. Product page 3. Marketing collateral (such as product launch blog posts) |
| 5 | Use scoring model from sheet "Scoring". |
| 6 | When interpreting terminology, you can assume that - ROI is the same thing as incremental ROAS or iROAS - Marginal ROI is the same thing as Marginal Incremental ROAS or miROAS - Diminishing return curves are the same thing as response curves |
| 7 | As an output, provide your evaluation in an excel file, using these columns: - Category ID - Category - Criteria ID - Criteria - Criteria Score - Two-sentence rationale for the score. If you found no evidence, comment that you did not find evidence, instead of claiming that the capability does not exist - URL to source - Type of source (Technical doc, Product page, Marketing collateral) |
Scoring model
Claude and ChatGPT were asked to use the following scoring logic in the evaluation.
| Score | Definition |
|---|---|
| 1.0 | Strong evidence that the platform supports the capability |
| 0.5 | Partial evidence that the platform supports the capability |
| 0.0 | No evidence found that the platform supports the capability |
A score of zero means no public evidence was found under this methodology. It does not confirm that a capability is absent.
Source material and terminology
The instructions restrict sources to the company website and the domain hosting its technical documentation. Technical documentation takes priority, followed by product pages and then marketing collateral. The source records include official documentation and repositories for the open-source tools. Private sales material and third-party claims are outside the stated evidence scope.
The rubric allows ROI to mean incremental ROAS, marginal ROI to mean marginal incremental ROAS, and diminishing-return curves to mean response curves. These are conventions for this evaluation. When reviewing a vendor's metrics, confirm the numerator, treatment of media costs, time window and uncertainty.
How to reproduce the evaluation and scoring yourself with Claude or ChatGPT?
To reproduce the evaluation for any vendor in this study, you can follow the instructions in this section. They are accurate as of 9th September 2026.
Step 1. Download the Evaluation Instructions Google Sheet as an Excel file (or other file format you can attach to an LLM prompt): evaluation-instructions workbook.
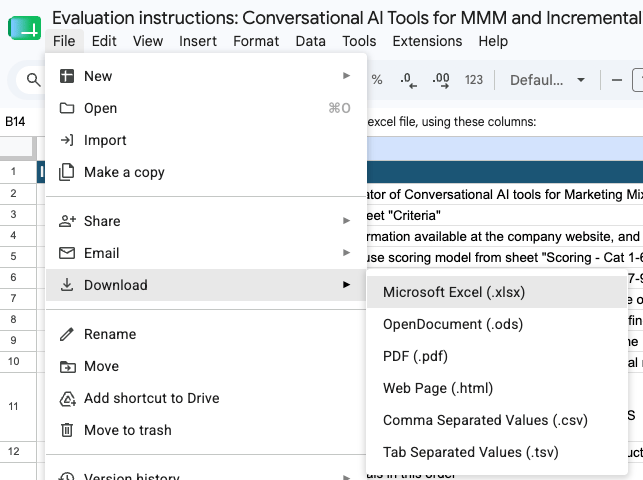
Step 2. Open Claude in Incognito mode to disconnect its memory about your previous conversations that might influence the evaluation. To achieve the same in ChatGPT, you need to disable ChatGPT memory.

Step 3. Choose a model. See specific LLM-model versions we used in the evaluation log.
Step 4. Initiate the prompt: "Evaluate [add vendor name, e.g., Sellforte], based on the instructions in the attached Excel."
What biases and limitations does our scoring approach have, and how are we addressing them?
While LLM-based evaluation reduces vendor bias and promotes equal treatment of vendors and reproducibility, there are four main limitations to be aware of.
1. Availability and of documentation that each vendor has made public. A vendor with extensive and detailed public documentation will naturally score higher than one that keeps product details behind a sales call gate, even if the underlying capabilities are comparable. Each vendor can affect their own scoring through public documentation.
2. LLMs' ability to find public documentation. Even with web search enabled, Claude and ChatGPT may not find every relevant page on a vendor's website. Documentation that is not well-indexed or that sits in obscure subdomains may be missed. We tried to address this by using advanced models from two separate LLMs, and added a specific point to the instructions to search for vendor-provided technical documentation that might sometimes be under a different sub-domain.
3. LLMs' ability to interpret public documentation against the scoring criteria. Matching a product description to a specific criterion requires judgment. We reduce interpretation variance by using advanced models from two separate LLMs, providing detailed criterion descriptions, and providing explicit terminology equivalences. However, edge cases may still exist.
4. Limitations of LLM technology, including hallucinations. LLMs are known to occasionally assert things that are not based on facts. To reduce this risk, we used advanced models from two separate LLMs, asked them to provide source URL for their assessment, and asked them to provide a rationale for the score in each criterion.
Which MMM Solutions for Retail Were Evaluated?
We selected seven commercial MMM providers and two open-source MMM frameworks:
| Tool or vendor | Type |
|---|---|
| Sellforte | MMM SaaS with customer success included |
| Ipsos MMA | Consultancy MMM |
| Measured | MMM SaaS with customer success included |
| Analytic Partners | Consultancy MMM |
| Ekimetrics | Consultancy MMM |
| Circana | Consultancy MMM |
| Meridian | Open-source MMM framework; implementation supplied by the user or a partner |
| Meta Robyn | Open-source MMM framework; implementation supplied by the user or a partner |
| Kantar | Consultancy MMM |
In-depth Comparison of MMM Solutions for Retail
The charts and tables in this section show the research scores and the results for all ten categories
Total research score across all 69 criteria
Average of the recorded Claude and ChatGPT scores from evaluations completed September 8–14, 2026. Bars and rankings use unrounded scores; labels are rounded to one decimal.
Sellforte scored 60.8/69, followed by Ipsos MMA and Measured at 47.0, Analytic Partners at 42.8, Ekimetrics at 40.0, Circana at 39.3, Meridian at 37.8, Meta Robyn at 34.0 and Kantar at 33.8.
The average across the nine tools is 42.5/69. The shared second place is an exact tie.
| Evaluated category | Sellforte | Ipsos MMA | Measured | Analytic Partners | Ekimetrics | Circana | Meridian | Meta Robyn | Kantar | Max |
|---|---|---|---|---|---|---|---|---|---|---|
| 1. Modeling store sales & other retail outcomes | 6.5 | 4.0 | 4.3 | 5.3 | 3.0 | 4.3 | 1.5 | 2.0 | 2.5 | 7 |
| 2. Promotions and other non-media drivers | 5.8 | 6.5 | 4.0 | 4.5 | 4.8 | 5.0 | 4.5 | 4.5 | 3.0 | 7 |
| 3. Media coverage & analytical granularity | 7.5 | 6.5 | 5.8 | 5.8 | 6.0 | 5.3 | 5.8 | 6.0 | 5.5 | 8 |
| 4. Modeling fundamentals | 6.5 | 4.8 | 7.0 | 4.0 | 5.8 | 3.8 | 7.5 | 7.5 | 5.3 | 8 |
| 5. Model calibration & Experiments | 5.8 | 4.8 | 4.0 | 3.0 | 2.5 | 3.0 | 4.5 | 3.8 | 0.3 | 6 |
| 6. Scenario planning & budget optimization | 7.0 | 5.8 | 4.5 | 6.3 | 5.0 | 5.3 | 5.5 | 4.0 | 5.5 | 8 |
| 7. Reporting, speed & decision workflows | 5.8 | 4.3 | 5.0 | 3.8 | 4.0 | 3.8 | 3.8 | 2.8 | 3.8 | 6 |
| 8. Data integration & quality | 6.3 | 4.5 | 4.3 | 4.5 | 4.0 | 4.0 | 4.8 | 3.5 | 3.0 | 7 |
| 9. Enterprise security & governance | 3.3 | 1.8 | 3.3 | 1.0 | 0.8 | 0.3 | N/A | N/A | 2.3 | 5 |
| 10. Retail experience, implementation & support | 6.5 | 4.3 | 5.0 | 4.8 | 4.3 | 4.8 | N/A | N/A | 2.8 | 7 |
| Total | 60.8 | 47.0 | 47.0 | 42.8 | 40.0 | 39.3 | 37.8 | 34.0 | 33.8 | 69 |
1. Modeling store sales & other retail outcomes
Average of the recorded Claude and ChatGPT scores from evaluations completed September 8–14, 2026. Bars and rankings use unrounded scores; labels are rounded to one decimal.
What we evaluated. The seven criteria assess modeling stores sales & other retail outcomes, including media impact on store and ecommerce sales, cross-channel effects, product category effects and customer group effects. They also cover gross and net revenue based outputs, profit outputs and customer lifetime value modeling.
What the research found. The research scores were: Sellforte (6.5/7), Analytic Partners (5.3/7), Circana (4.3/7), Measured (4.3/7), Ipsos MMA (4.0/7), Ekimetrics (3.0/7), Kantar (2.5/7), Meta Robyn (2.0/7), Meridian (1.5/7).
In the research, separate store and ecommerce outcomes and acquisition and retention by customer group had the highest average criterion scores. Gross versus net revenue had the lowest average, reflecting weaker public evidence for the specified treatment of returns and cancellations. Profit measurement and customer-group outcomes showed the largest differences, each with a 1.0-point gap between the highest and lowest scores.
| Criterion | Sellforte | Ipsos MMA | Measured | Analytic Partners | Ekimetrics | Circana | Meridian | Meta Robyn | Kantar | Average research score |
|---|---|---|---|---|---|---|---|---|---|---|
| 1.1 Separately measures media impact on store and e-commerce sales | 1.0 | 0.8 | 1.0 | 0.8 | 0.5 | 1.0 | 0.3 | 0.5 | 0.3 | 0.7 |
| 1.2 Measures how media drives each product-category | 1.0 | 1.0 | 0.3 | 0.8 | 0.5 | 0.8 | 0.3 | 0.5 | 0.5 | 0.6 |
| 1.3 Measures cross-channel sales effects (digital media to offline sales, and vice versa) | 1.0 | 0.5 | 0.8 | 0.8 | 0.5 | 0.8 | 0.3 | 0.5 | 0.3 | 0.6 |
| 1.4 Support both gross and net revenue (after returns and cancellations) | 0.8 | 0.0 | 0.3 | 0.5 | 0.0 | 0.0 | 0.3 | 0.3 | 0.0 | 0.2 |
| 1.5 Measures incremental profit or contribution margin | 1.0 | 0.5 | 0.5 | 0.8 | 0.5 | 0.5 | 0.3 | 0.0 | 0.5 | 0.5 |
| 1.6 Measures acquisition and retention by customer group | 1.0 | 0.8 | 1.0 | 1.0 | 0.5 | 1.0 | 0.0 | 0.3 | 0.5 | 0.7 |
| 1.7 Connects marketing impact to customer lifetime value | 0.8 | 0.5 | 0.5 | 0.8 | 0.5 | 0.3 | 0.3 | 0.0 | 0.5 | 0.4 |
| Category total | 6.5 | 4.0 | 4.3 | 5.3 | 3.0 | 4.3 | 1.5 | 2.0 | 2.5 | 3.7 |
2. Promotions and other non-media drivers
Average of the recorded Claude and ChatGPT scores from evaluations completed September 8–14, 2026. Bars and rankings use unrounded scores; labels are rounded to one decimal.
What we evaluated. The seven criteria assess whether MMM separates media effects from promotions and other retail sales drivers. They cover promotion types, halo and cannibalization, availability and assortment, store-network changes, seasonality and weather.
What the research found. The research scores were: Ipsos MMA (6.5/7), Sellforte (5.8/7), Circana (5.0/7), Ekimetrics (4.8/7), Analytic Partners (4.5/7), Meridian (4.5/7), Meta Robyn (4.5/7), Measured (4.0/7), Kantar (3.0/7). Matching scores are exact ties.
In the research, separating promotional uplift from media effects, retail seasonality and weather had the highest average scores. Promotion halo and cannibalization and store-network changes had the lowest averages, reflecting weaker public evidence under those criteria. Store-network changes showed the largest difference, with a 1.0-point gap between the highest and lowest scores.
| Criterion | Sellforte | Ipsos MMA | Measured | Analytic Partners | Ekimetrics | Circana | Meridian | Meta Robyn | Kantar | Average research score |
|---|---|---|---|---|---|---|---|---|---|---|
| 2.1 Separates promotional uplift from media effects | 1.0 | 1.0 | 1.0 | 1.0 | 1.0 | 1.0 | 1.0 | 1.0 | 0.8 | 1.0 |
| 2.2 Separates effects of different promotion types | 1.0 | 1.0 | 0.5 | 0.5 | 0.8 | 0.5 | 0.5 | 1.0 | 0.3 | 0.7 |
| 2.3 Measures promotion halo and cannibalization | 0.8 | 0.8 | 0.3 | 0.3 | 0.3 | 0.3 | 0.0 | 0.0 | 0.3 | 0.3 |
| 2.4 Accounts for availability and assortment changes | 0.5 | 0.8 | 0.5 | 0.8 | 0.8 | 1.0 | 0.5 | 0.3 | 0.5 | 0.6 |
| 2.5 Accounts for store-network changes | 0.5 | 1.0 | 0.0 | 0.5 | 0.3 | 0.5 | 0.8 | 0.3 | 0.0 | 0.4 |
| 2.6 Models retail seasonality and trading events | 1.0 | 1.0 | 1.0 | 0.8 | 0.8 | 0.8 | 1.0 | 1.0 | 0.8 | 0.9 |
| 2.7 Accounts for weather-driven demand | 1.0 | 1.0 | 0.8 | 0.8 | 1.0 | 1.0 | 0.8 | 1.0 | 0.5 | 0.9 |
| Category total | 5.8 | 6.5 | 4.0 | 4.5 | 4.8 | 5.0 | 4.5 | 4.5 | 3.0 | 4.7 |
3. Media coverage & analytical granularity
Average of the recorded Claude and ChatGPT scores from evaluations completed September 8–14, 2026. Bars and rankings use unrounded scores; labels are rounded to one decimal.
What we evaluated. The eight criteria assess coverage of digital, offline and owned media, including incremental ROAS by channel, campaign and ad set. They also cover seasonal campaigns, geographic detail, multiple brands and markets, and marginal returns.
What the research found. The research scores were: Sellforte (7.5/8), Ipsos MMA (6.5/8), Ekimetrics (6.0/8), Meta Robyn (6.0/8), Analytic Partners (5.8/8), Measured (5.8/8), Meridian (5.8/8), Kantar (5.5/8), Circana (5.3/8). Matching scores are exact ties.
In the research, digital-channel iROAS, multiple-brand and market support, and marginal returns had the highest average scores. Seasonal campaigns and campaign-and-ad-set iROAS had the lowest averages, reflecting weaker public evidence under those criteria. These two criteria also showed the largest differences, each with a 0.75-point gap between the highest and lowest scores.
| Criterion | Sellforte | Ipsos MMA | Measured | Analytic Partners | Ekimetrics | Circana | Meridian | Meta Robyn | Kantar | Average research score |
|---|---|---|---|---|---|---|---|---|---|---|
| 3.1 Measures incremental ROAS across digital channel types | 1.0 | 1.0 | 1.0 | 1.0 | 1.0 | 0.8 | 1.0 | 1.0 | 1.0 | 1.0 |
| 3.2 Measures incremental ROAS by digital campaign and ad set | 1.0 | 0.5 | 0.8 | 0.5 | 0.5 | 0.5 | 0.3 | 0.5 | 0.5 | 0.6 |
| 3.3 Measures Incremental ROAS of traditional and offline media | 1.0 | 0.8 | 0.5 | 0.8 | 0.8 | 0.8 | 0.5 | 1.0 | 1.0 | 0.8 |
| 3.4 Measures owned and CRM media | 0.8 | 0.8 | 0.5 | 0.5 | 0.5 | 0.3 | 0.8 | 0.8 | 0.5 | 0.6 |
| 3.5 Measures seasonal campaigns (e.g. back to school) | 1.0 | 0.5 | 0.5 | 0.5 | 0.5 | 0.3 | 0.5 | 0.5 | 0.5 | 0.5 |
| 3.6 Provides geographic estimates below national level | 0.8 | 1.0 | 0.5 | 0.8 | 0.8 | 0.8 | 1.0 | 0.5 | 0.5 | 0.7 |
| 3.7 Supports multiple brands, markets and business units | 1.0 | 1.0 | 1.0 | 1.0 | 1.0 | 1.0 | 0.8 | 0.8 | 1.0 | 0.9 |
| 3.8 Provides marginal returns | 1.0 | 1.0 | 1.0 | 0.8 | 1.0 | 1.0 | 1.0 | 1.0 | 0.5 | 0.9 |
| Category total | 7.5 | 6.5 | 5.8 | 5.8 | 6.0 | 5.3 | 5.8 | 6.0 | 5.5 | 6.0 |
4. Modeling fundamentals
Average of the recorded Claude and ChatGPT scores from evaluations completed September 8–14, 2026. Bars and rankings use unrounded scores; labels are rounded to one decimal.
What we evaluated. The eight criteria assess carryover, saturation, model assumptions, validation and diagnostics. They also examine confounding and demand capture, sparse or correlated marketing activity, and uncertainty in incremental effects.
What the research found. The research scores were: Meridian (7.5/8), Meta Robyn (7.5/8), Measured (7.0/8), Sellforte (6.5/8), Ekimetrics (5.8/8), Kantar (5.3/8), Ipsos MMA (4.8/8), Analytic Partners (4.0/8), Circana (3.8/8). Matching scores are exact ties.
In the research, saturation, confounding and demand capture, and carryover had the highest average scores. Uncertainty reporting and held-out predictive validation had the lowest averages, reflecting weaker public evidence under those criteria. Saturation, assumptions and parameters, validation, diagnostics and uncertainty reporting shared the largest difference, each with a 0.75-point gap between the highest and lowest scores.
| Criterion | Sellforte | Ipsos MMA | Measured | Analytic Partners | Ekimetrics | Circana | Meridian | Meta Robyn | Kantar | Average research score |
|---|---|---|---|---|---|---|---|---|---|---|
| 4.1 Models delayed and carryover media effects | 1.0 | 0.5 | 1.0 | 0.5 | 1.0 | 0.5 | 1.0 | 1.0 | 1.0 | 0.8 |
| 4.2 Models saturation and diminishing returns | 1.0 | 1.0 | 1.0 | 0.8 | 1.0 | 0.3 | 1.0 | 1.0 | 1.0 | 0.9 |
| 4.3 Exposes model assumptions and parameters | 0.5 | 1.0 | 0.8 | 0.5 | 0.8 | 0.3 | 1.0 | 1.0 | 0.5 | 0.7 |
| 4.4 Tests predictive performance on held-out data | 0.8 | 0.3 | 1.0 | 0.5 | 0.5 | 0.5 | 0.5 | 1.0 | 0.5 | 0.6 |
| 4.5 Provides model health diagnostics | 1.0 | 0.5 | 0.8 | 0.3 | 0.5 | 0.5 | 1.0 | 1.0 | 0.3 | 0.6 |
| 4.6 Addresses confounding and demand capture | 1.0 | 0.8 | 1.0 | 0.8 | 1.0 | 1.0 | 1.0 | 0.5 | 0.8 | 0.9 |
| 4.7 Handles sparse and correlated marketing activity | 0.8 | 0.5 | 1.0 | 0.5 | 0.8 | 0.5 | 1.0 | 1.0 | 0.8 | 0.8 |
| 4.8 Reports uncertainty in incremental effects | 0.5 | 0.3 | 0.5 | 0.3 | 0.3 | 0.3 | 1.0 | 1.0 | 0.5 | 0.5 |
| Category total | 6.5 | 4.8 | 7.0 | 4.0 | 5.8 | 3.8 | 7.5 | 7.5 | 5.3 | 5.8 |
5. Model calibration & Experiments
Average of the recorded Claude and ChatGPT scores from evaluations completed September 8–14, 2026. Bars and rankings use unrounded scores; labels are rounded to one decimal.
What we evaluated. The six criteria assess calibration using experiments, platform lift studies, incrementality benchmarks and attribution data. They also cover the relevance and uncertainty of calibration evidence, disagreements between measurement methods, and priorities for further testing.
What the research found. The research scores were: Sellforte (5.8/6), Ipsos MMA (4.8/6), Meridian (4.5/6), Measured (4.0/6), Meta Robyn (3.8/6), Analytic Partners (3.0/6), Circana (3.0/6), Ekimetrics (2.5/6), Kantar (0.3/6). Matching scores are exact ties.
In the research, calibration using geo or first-party experiments had the highest average score. Platform lift calibration and using MMM uncertainty to prioritize tests had the lowest averages, reflecting weaker public evidence under those criteria. Five of the six criteria shared the largest difference, each with a 1.0-point gap between the highest and lowest scores; only calibration using incrementality benchmarks and attribution data had a narrower gap.
| Criterion | Sellforte | Ipsos MMA | Measured | Analytic Partners | Ekimetrics | Circana | Meridian | Meta Robyn | Kantar | Average research score |
|---|---|---|---|---|---|---|---|---|---|---|
| 5.1 Calibrates MMM using geo or first-party experiments | 1.0 | 1.0 | 1.0 | 0.5 | 0.8 | 0.8 | 1.0 | 1.0 | 0.0 | 0.8 |
| 5.2 Calibrates MMM using platform lift studies | 1.0 | 1.0 | 0.3 | 0.0 | 0.3 | 0.5 | 0.5 | 1.0 | 0.0 | 0.5 |
| 5.3 Calibrates MMM using incrementality factor benchmarks and attribution data | 1.0 | 0.8 | 0.8 | 0.8 | 0.5 | 0.5 | 0.5 | 0.5 | 0.3 | 0.6 |
| 5.4 Checks calibration relevance and uncertainty | 1.0 | 0.5 | 0.8 | 0.8 | 0.0 | 0.3 | 1.0 | 0.8 | 0.0 | 0.6 |
| 5.5 Investigates disagreements between measurement methods | 1.0 | 0.5 | 0.8 | 0.5 | 0.5 | 0.8 | 0.5 | 0.5 | 0.0 | 0.6 |
| 5.6 Uses MMM uncertainty to prioritize further tests | 0.8 | 1.0 | 0.5 | 0.5 | 0.5 | 0.3 | 1.0 | 0.0 | 0.0 | 0.5 |
| Category total | 5.8 | 4.8 | 4.0 | 3.0 | 2.5 | 3.0 | 4.5 | 3.8 | 0.3 | 3.5 |
6. Scenario planning & budget optimization
Average of the recorded Claude and ChatGPT scores from evaluations completed September 8–14, 2026. Bars and rankings use unrounded scores; labels are rounded to one decimal.
What we evaluated. The eight criteria assess budget simulations, channel allocation, target-based budgets and planning constraints. They also cover allocation across the trading calendar and business units, combined marketing and commercial scenarios, and uncertainty in recommendations.
What the research found. The research scores were: Sellforte (7.0/8), Analytic Partners (6.3/8), Ipsos MMA (5.8/8), Kantar (5.5/8), Meridian (5.5/8), Circana (5.3/8), Ekimetrics (5.0/8), Measured (4.5/8), Meta Robyn (4.0/8). Matching scores are exact ties.
In the research, channel allocation within a fixed budget and simulations of budget changes had the highest average scores. Uncertainty and limits in recommendations had the lowest average, reflecting weaker public evidence under that criterion. Trading-calendar allocation, allocation across brands or business units, and combined marketing and commercial scenarios showed the largest differences, each with a 1.0-point gap between the highest and lowest scores.
| Criterion | Sellforte | Ipsos MMA | Measured | Analytic Partners | Ekimetrics | Circana | Meridian | Meta Robyn | Kantar | Average research score |
|---|---|---|---|---|---|---|---|---|---|---|
| 6.1 Simulates changes to marketing budgets | 1.0 | 1.0 | 1.0 | 1.0 | 0.8 | 1.0 | 0.5 | 0.8 | 1.0 | 0.9 |
| 6.2 Optimizes channel allocation for a set budget | 1.0 | 0.8 | 1.0 | 0.8 | 1.0 | 1.0 | 1.0 | 1.0 | 1.0 | 0.9 |
| 6.3 Estimates budget required to reach a business target | 0.8 | 0.5 | 0.5 | 0.8 | 0.5 | 0.5 | 1.0 | 0.8 | 0.5 | 0.6 |
| 6.4 Respects practical planning constraints | 1.0 | 0.5 | 1.0 | 0.5 | 0.8 | 0.5 | 1.0 | 1.0 | 0.5 | 0.8 |
| 6.5 Optimizes spending across the trading calendar | 1.0 | 0.8 | 0.5 | 1.0 | 0.5 | 0.8 | 0.5 | 0.0 | 0.8 | 0.6 |
| 6.6 Optimizes budgets across brands or business units | 1.0 | 0.8 | 0.3 | 0.8 | 0.8 | 1.0 | 0.0 | 0.0 | 0.5 | 0.6 |
| 6.7 Combines marketing and commercial decisions in scenarios | 0.8 | 1.0 | 0.0 | 1.0 | 0.8 | 0.5 | 0.8 | 0.0 | 0.8 | 0.6 |
| 6.8 Shows uncertainty and limits in recommendations | 0.5 | 0.5 | 0.3 | 0.5 | 0.0 | 0.0 | 0.8 | 0.5 | 0.5 | 0.4 |
| Category total | 7.0 | 5.8 | 4.5 | 6.3 | 5.0 | 5.3 | 5.5 | 4.0 | 5.5 | 5.4 |
7. Reporting, speed & decision workflows
Average of the recorded Claude and ChatGPT scores from evaluations completed September 8–14, 2026. Bars and rankings use unrounded scores; labels are rounded to one decimal.
What we evaluated. The six criteria assess how users review and act on MMM results through self-service exploration, model refreshes, performance explanations, campaign and ad-set recommendations, structured exports and natural-language analysis.
What the research found. The research scores were: Sellforte (5.8/6), Measured (5.0/6), Ipsos MMA (4.3/6), Ekimetrics (4.0/6), Analytic Partners (3.8/6), Circana (3.8/6), Kantar (3.8/6), Meridian (3.8/6), Meta Robyn (2.8/6). Matching scores are exact ties.
In the research, refreshes aligned with decision cycles had the highest average score, at 1.0/1, followed by self-service exploration. Campaign-and-ad-set spending and bidding recommendations and natural-language analysis had the lowest averages, reflecting weaker public evidence under those criteria. These two criteria also showed the largest differences, each with a 1.0-point gap between the highest and lowest scores; refresh alignment showed no score differences.
| Criterion | Sellforte | Ipsos MMA | Measured | Analytic Partners | Ekimetrics | Circana | Meridian | Meta Robyn | Kantar | Average research score |
|---|---|---|---|---|---|---|---|---|---|---|
| 7.1 Provides self-service MMM exploration UI | 1.0 | 1.0 | 1.0 | 1.0 | 1.0 | 1.0 | 0.8 | 0.3 | 1.0 | 0.9 |
| 7.2 Refreshes MMM to match decision cycles | 1.0 | 1.0 | 1.0 | 1.0 | 1.0 | 1.0 | 1.0 | 1.0 | 1.0 | 1.0 |
| 7.3 Explains changes in business performance | 0.8 | 0.8 | 0.8 | 1.0 | 0.8 | 0.5 | 0.5 | 0.5 | 0.5 | 0.7 |
| 7.4 Recommends optimal spend and bidding parameters by campaign & ad set | 1.0 | 0.8 | 0.5 | 0.5 | 0.3 | 0.3 | 0.0 | 0.0 | 0.5 | 0.4 |
| 7.5 Exports structured results for downstream analysis | 1.0 | 0.5 | 0.8 | 0.3 | 0.3 | 0.5 | 1.0 | 1.0 | 0.3 | 0.6 |
| 7.6 Supports natural-language analysis of MMM results | 1.0 | 0.3 | 1.0 | 0.0 | 0.8 | 0.5 | 0.5 | 0.0 | 0.5 | 0.5 |
| Category total | 5.8 | 4.3 | 5.0 | 3.8 | 4.0 | 3.8 | 3.8 | 2.8 | 3.8 | 4.1 |
8. Data integration & quality
Average of the recorded Claude and ChatGPT scores from evaluations completed September 8–14, 2026. Bars and rankings use unrounded scores; labels are rounded to one decimal.
What we evaluated. The seven criteria assess recurring media and retailer data ingestion, offline and custom feeds, retailer-defined taxonomies, validation, data specifications, and tools for cleaning, harmonizing and aggregating inputs.
What the research found. The research scores were: Sellforte (6.3/7), Meridian (4.8/7), Analytic Partners (4.5/7), Ipsos MMA (4.5/7), Measured (4.3/7), Circana (4.0/7), Ekimetrics (4.0/7), Meta Robyn (3.5/7), Kantar (3.0/7). Matching scores are exact ties.
In the research, digital-media ingestion and data validation had the highest average scores. Retailer sales and customer-data connections had the lowest average, reflecting weaker public evidence for recurring retailer-system connections under the methodology. That criterion also showed the largest difference, with a 1.0-point gap between the highest and lowest scores.
| Criterion | Sellforte | Ipsos MMA | Measured | Analytic Partners | Ekimetrics | Circana | Meridian | Meta Robyn | Kantar | Average research score |
|---|---|---|---|---|---|---|---|---|---|---|
| 8.1 Automates digital media ingestion | 1.0 | 0.8 | 1.0 | 0.8 | 0.5 | 0.8 | 0.8 | 0.3 | 0.5 | 0.7 |
| 8.2 Connects to retailer sales and customer data | 1.0 | 0.5 | 0.8 | 0.5 | 0.5 | 0.8 | 0.0 | 0.0 | 0.5 | 0.5 |
| 8.3 Accepts offline media and custom business feeds | 1.0 | 0.5 | 0.5 | 0.5 | 0.5 | 0.3 | 1.0 | 0.8 | 0.5 | 0.6 |
| 8.4 Enables custom data taxonomy for sales and media data | 1.0 | 0.5 | 0.5 | 0.5 | 0.8 | 0.5 | 0.5 | 0.5 | 0.5 | 0.6 |
| 8.5 Provides tools for data validation | 0.8 | 0.8 | 0.5 | 1.0 | 0.8 | 0.5 | 1.0 | 0.8 | 0.3 | 0.7 |
| 8.6 Provides data specifications | 1.0 | 0.5 | 0.5 | 0.3 | 0.5 | 0.5 | 1.0 | 1.0 | 0.3 | 0.6 |
| 8.7 Provides data cleaning, harmonization and aggregation tools | 0.5 | 1.0 | 0.5 | 1.0 | 0.5 | 0.8 | 0.5 | 0.3 | 0.5 | 0.6 |
| Category total | 6.3 | 4.5 | 4.3 | 4.5 | 4.0 | 4.0 | 4.8 | 3.5 | 3.0 | 4.3 |
9. Enterprise security & governance
Average of the recorded Claude and ChatGPT scores from evaluations completed September 8–14, 2026. Bars and rankings use unrounded scores; labels are rounded to one decimal.
What we evaluated. The five criteria assess encryption, independent security assurance, enterprise single sign-on, access controls by role and business scope, and data residency choices for the evaluated service.
What the research found. The research scores were: Measured (3.3/5), Sellforte (3.3/5), Kantar (2.3/5), Ipsos MMA (1.8/5), Analytic Partners (1.0/5), Ekimetrics (0.8/5), Circana (0.3/5), Meridian (N/A), Meta Robyn (N/A). Matching scores are exact ties.
In the research, independent security assurance had the highest average score. Residency choices and encryption had the lowest averages, reflecting weaker public evidence under those criteria. Encryption, independent assurance and single sign-on showed the largest differences, each with a 1.0-point gap between the highest and lowest scores.
| Criterion | Sellforte | Ipsos MMA | Measured | Analytic Partners | Ekimetrics | Circana | Meridian | Meta Robyn | Kantar | Average research score |
|---|---|---|---|---|---|---|---|---|---|---|
| 9.1 Encrypts stored and transmitted customer data | 0.3 | 0.3 | 1.0 | 0.0 | 0.0 | 0.0 | N/A | N/A | 0.5 | 0.3 |
| 9.2 Provides independent security assurance | 0.8 | 0.5 | 1.0 | 1.0 | 0.5 | 0.0 | N/A | N/A | 0.8 | 0.6 |
| 9.3 Supports enterprise single sign-on | 1.0 | 0.0 | 0.8 | 0.0 | 0.0 | 0.0 | N/A | N/A | 0.5 | 0.3 |
| 9.4 Controls access by role and business scope | 0.5 | 0.5 | 0.5 | 0.0 | 0.0 | 0.3 | N/A | N/A | 0.5 | 0.3 |
| 9.5 Provides data residency choices | 0.8 | 0.5 | 0.0 | 0.0 | 0.3 | 0.0 | N/A | N/A | 0.0 | 0.2 |
| Category total | 3.3 | 1.8 | 3.3 | 1.0 | 0.8 | 0.3 | N/A | N/A | 2.3 | 1.4 |
10. Retail experience, implementation & support
Average of the recorded Claude and ChatGPT scores from evaluations completed September 8–14, 2026. Bars and rankings use unrounded scores; labels are rounded to one decimal.
What we evaluated. The seven criteria assess named retail MMM deployments, documented decisions and outcomes, onboarding, ongoing support, training, expert interpretation, and the pricing basis and agreed service scope.
What the research found. The research scores were: Sellforte (6.5/7), Measured (5.0/7), Analytic Partners (4.8/7), Circana (4.8/7), Ekimetrics (4.3/7), Ipsos MMA (4.3/7), Kantar (2.8/7), Meridian (N/A), Meta Robyn (N/A). Matching scores are exact ties.
In the research, expert interpretation and planning support had the highest average score, followed by training. Qualifying named retail deployments, support coverage and commercial terms had the lowest averages, reflecting weaker public evidence under those criteria. Named retail MMM deployments showed the largest difference among the seven commercial vendors, with a 1.0-point gap between the highest and lowest scores. Expert interpretation and planning support received 1.0 from every commercial vendor. Meridian and Meta Robyn are excluded as N/A.
| Criterion | Sellforte | Ipsos MMA | Measured | Analytic Partners | Ekimetrics | Circana | Meridian | Meta Robyn | Kantar | Average research score |
|---|---|---|---|---|---|---|---|---|---|---|
| 10.1 Demonstrates 5+ named retail MMM deployments | 1.0 | 0.5 | 0.5 | 0.5 | 0.5 | 0.3 | N/A | N/A | 0.0 | 0.5 |
| 10.2 Documents a retail decision and measured outcome | 1.0 | 0.8 | 0.5 | 1.0 | 0.5 | 0.5 | N/A | N/A | 0.3 | 0.6 |
| 10.3 Defines onboarding responsibilities and milestones | 1.0 | 0.5 | 0.5 | 0.5 | 0.5 | 0.8 | N/A | N/A | 0.5 | 0.6 |
| 10.4 Provides ongoing support with clear coverage | 0.5 | 0.5 | 1.0 | 0.5 | 0.3 | 0.8 | N/A | N/A | 0.3 | 0.5 |
| 10.5 Trains teams and supports adoption | 1.0 | 0.5 | 0.8 | 1.0 | 1.0 | 1.0 | N/A | N/A | 0.5 | 0.8 |
| 10.6 Provides expert interpretation and planning support | 1.0 | 1.0 | 1.0 | 1.0 | 1.0 | 1.0 | N/A | N/A | 1.0 | 1.0 |
| 10.7 Defines pricing basis and agreed service scope | 1.0 | 0.5 | 0.8 | 0.3 | 0.5 | 0.5 | N/A | N/A | 0.3 | 0.5 |
| Category total | 6.5 | 4.3 | 5.0 | 4.8 | 4.3 | 4.8 | N/A | N/A | 2.8 | 3.6 |
What this evaluation suggests about the market
Average of the recorded Claude and ChatGPT scores from evaluations completed September 8–14, 2026. Categories 1–8 average nine solutions; categories 9–10 average seven commercial vendors. Bars and rankings use unrounded scores; labels are rounded to one decimal.
Public evidence is most consistent for media coverage and analytical granularity, which averages 75.0% of available points. Modeling fundamentals follows at 72.2%. Reporting workflows average 68.1%, scenario planning 67.7%, and promotions and other non-media drivers 67.5%.
Enterprise security and governance has the lowest average at 35.7%. Retail experience, implementation and support averages 65.8%, and retail sales outcomes 52.8%. Categories 9 and 10 average the seven commercial vendors, excluding Meridian and Meta Robyn as N/A; the other categories average all nine solutions. These figures describe the selected solutions under this framework and do not measure market-wide capability adoption.
For a retail shortlist, the results suggest two things. Familiar MMM methods are more consistently documented than several retail-specific outcome requirements. Similar totals can also conceal different strengths: Ipsos MMA and Measured tie overall, while Meridian and Robyn lead modeling fundamentals despite lower totals across the full framework. Compare the criteria that matter for your decisions and the implementation you plan to use.
Summary by vendor
The profiles below summarize the recorded Claude and ChatGPT evaluations completed from September 8 to 14, 2026. Each scorecard compares one solution with the average and highest applicable scores. Higher- and lower-scoring categories refer to each solution’s own scores as a share of the available points.
1. Sellforte (research score: 60.8 out of 69)
Research overview
Sellforte received an average research score of 60.8 out of 69, the highest total in this nine-solution comparison. Claude and ChatGPT each assessed its public documentation on September 8, 2026, across 69 criteria in ten categories.
Sellforte is best for retailers and ecommerce businesses in the United States and Europe looking for high quality enterprise-grade measurement, granular campaign & ad set level optimization and real-time MMM insights.Category scorecard
| Category | Sellforte | Average research score | Highest research score |
|---|---|---|---|
| 1. Modeling store sales & other retail outcomes | 6.5 / 7 | 3.7 / 7 | 6.5 / 7 |
| 2. Promotions and other non-media drivers | 5.8 / 7 | 4.7 / 7 | 6.5 / 7 |
| 3. Media coverage & analytical granularity | 7.5 / 8 | 6.0 / 8 | 7.5 / 8 |
| 4. Modeling fundamentals | 6.5 / 8 | 5.8 / 8 | 7.5 / 8 |
| 5. Model calibration & Experiments | 5.8 / 6 | 3.5 / 6 | 5.8 / 6 |
| 6. Scenario planning & budget optimization | 7.0 / 8 | 5.4 / 8 | 7.0 / 8 |
| 7. Reporting, speed & decision workflows | 5.8 / 6 | 4.1 / 6 | 5.8 / 6 |
| 8. Data integration & quality | 6.3 / 7 | 4.3 / 7 | 6.3 / 7 |
| 9. Enterprise security & governance | 3.3 / 5 | 1.8 / 5 | 3.3 / 5 |
| 10. Retail experience, implementation & support | 6.5 / 7 | 4.6 / 7 | 6.5 / 7 |
| Total score out of 69 | 60.8 / 69 | 42.5 / 69 | 60.8 / 69 |
Percentage of available points
Bars show the solution’s average recorded Claude and ChatGPT score as a percentage of the category maximum. Markers show the average and highest applicable scores, excluding N/A entries. Positions use unrounded scores; labels show points rounded to one decimal.
Where Claude and ChatGPT assigned higher scores
- Model calibration & Experiments: 5.8 / 6. This was above the nine-solution average of 3.5 / 6. It was the highest score in this category. As examples, Sellforte scores high on these criteria: Calibrates MMM using geo or first-party experiments; Calibrates MMM using platform lift studies; Calibrates MMM using incrementality factor benchmarks and attribution data.
- Reporting, speed & decision workflows: 5.8 / 6. This was above the nine-solution average of 4.1 / 6. It was the highest score in this category. As examples, Sellforte scores high on these criteria: Recommends optimal spend and bidding parameters by campaign & ad set; Supports natural-language analysis of MMM results; Explains changes in business performance.
- Media coverage & analytical granularity: 7.5 / 8. This was above the nine-solution average of 6.0 / 8. It was the highest score in this category. As examples, Sellforte scores high on these criteria: Measures incremental ROAS by digital campaign and ad set; Measures seasonal campaigns (e.g. back to school); Provides geographic estimates below national level.
Where scores were lower
- Enterprise security & governance: 3.3 / 5. Despite being one of Sellforte’s relatively lower-scoring categories, its score was still above the seven-vendor average of 1.8 / 5. It tied Measured for the highest category score.
- Modeling fundamentals: 6.5 / 8. Despite being one of Sellforte’s relatively lower-scoring categories, its score was still above the nine-solution average of 5.8 / 8.
- Promotions and other non-media drivers: 5.8 / 7. Despite being one of Sellforte’s relatively lower-scoring categories, its score was still above the nine-solution average of 4.7 / 7.
Notable Reference Customers
Sellforte lists following companies as examples of public reference customers:
- Fashion Ecommerce: bonprix, Azzas 2154, Represent, Odlo
- Home & Furniture Ecommerce: Finnish Design Shop
- Specialty Ecommerce: FCP Euro, Smartphoto
- Grocery Retail: Lidl
- Fashion Retail: C&A, KIK
- Cosmetics Retail: Douglas
- Sport Retail: Interpsort
- Pet Retail: Fressnapf, Musti Group
- Specialty Retail: Tchibo
- Electronics Retail: Verkkokauppa.com
- Other segments: Telenor (Telecommunications), Paysafe (Payments), eBilet (part of Allegro Group, Events)
2. Ipsos MMA (research score: 47.0 out of 69)

Research overview
Ipsos MMA received an average research score of 47.0 out of 69, tied for the second-highest total in this nine-solution comparison. Claude assessed its public documentation on September 14, 2026, and ChatGPT on September 9, 2026, each across 69 criteria in ten categories.
Category scorecard
| Category | Ipsos MMA | Average research score | Highest research score |
|---|---|---|---|
| 1. Modeling store sales & other retail outcomes | 4.0 / 7 | 3.7 / 7 | 6.5 / 7 |
| 2. Promotions and other non-media drivers | 6.5 / 7 | 4.7 / 7 | 6.5 / 7 |
| 3. Media coverage & analytical granularity | 6.5 / 8 | 6.0 / 8 | 7.5 / 8 |
| 4. Modeling fundamentals | 4.8 / 8 | 5.8 / 8 | 7.5 / 8 |
| 5. Model calibration & Experiments | 4.8 / 6 | 3.5 / 6 | 5.8 / 6 |
| 6. Scenario planning & budget optimization | 5.8 / 8 | 5.4 / 8 | 7.0 / 8 |
| 7. Reporting, speed & decision workflows | 4.3 / 6 | 4.1 / 6 | 5.8 / 6 |
| 8. Data integration & quality | 4.5 / 7 | 4.3 / 7 | 6.3 / 7 |
| 9. Enterprise security & governance | 1.8 / 5 | 1.8 / 5 | 3.3 / 5 |
| 10. Retail experience, implementation & support | 4.3 / 7 | 4.6 / 7 | 6.5 / 7 |
| Total score out of 69 | 47.0 / 69 | 42.5 / 69 | 60.8 / 69 |
Percentage of available points
Bars show the solution’s average recorded Claude and ChatGPT score as a percentage of the category maximum. Markers show the average and highest applicable scores, excluding N/A entries. Positions use unrounded scores; labels show points rounded to one decimal.
Where Claude and ChatGPT assigned higher scores
- Promotions and other non-media drivers: 6.5 / 7. This was above the nine-solution average of 4.7 / 7. It was the highest score in this category. As examples, Ipsos MMA scores high on these criteria: Separates promotional uplift from media effects; Accounts for store-network changes; Measures promotion halo and cannibalization.
- Media coverage & analytical granularity: 6.5 / 8. This was above the nine-solution average of 6.0 / 8. As examples, Ipsos MMA scores high on these criteria: Provides geographic estimates below national level; Supports multiple brands, markets and business units; Measures incremental ROAS across digital channel types.
- Model calibration & Experiments: 4.8 / 6. This was above the nine-solution average of 3.5 / 6. As examples, Ipsos MMA scores high on these criteria: Calibrates MMM using geo or first-party experiments; Uses MMM uncertainty to prioritize further tests; Calibrates MMM using platform lift studies.
Where scores were lower
- Enterprise security & governance: 1.8 / 5. This was slightly below the seven-vendor average; both round to 1.8 / 5.
- Modeling store sales & other retail outcomes: 4.0 / 7. Despite being one of Ipsos MMA’s relatively lower-scoring categories, its score was still above the nine-solution average of 3.7 / 7.
- Modeling fundamentals: 4.8 / 8. This was below the nine-solution average of 5.8 / 8.
2. Measured (research score: 47.0 out of 69)
Research overview
Measured received an average research score of 47.0 out of 69, tied for the second-highest total in this nine-solution comparison. Claude assessed its public documentation on September 9, 2026, and ChatGPT on September 8, 2026, each across 69 criteria in ten categories.
Category scorecard
| Category | Measured | Average research score | Highest research score |
|---|---|---|---|
| 1. Modeling store sales & other retail outcomes | 4.3 / 7 | 3.7 / 7 | 6.5 / 7 |
| 2. Promotions and other non-media drivers | 4.0 / 7 | 4.7 / 7 | 6.5 / 7 |
| 3. Media coverage & analytical granularity | 5.8 / 8 | 6.0 / 8 | 7.5 / 8 |
| 4. Modeling fundamentals | 7.0 / 8 | 5.8 / 8 | 7.5 / 8 |
| 5. Model calibration & Experiments | 4.0 / 6 | 3.5 / 6 | 5.8 / 6 |
| 6. Scenario planning & budget optimization | 4.5 / 8 | 5.4 / 8 | 7.0 / 8 |
| 7. Reporting, speed & decision workflows | 5.0 / 6 | 4.1 / 6 | 5.8 / 6 |
| 8. Data integration & quality | 4.3 / 7 | 4.3 / 7 | 6.3 / 7 |
| 9. Enterprise security & governance | 3.3 / 5 | 1.8 / 5 | 3.3 / 5 |
| 10. Retail experience, implementation & support | 5.0 / 7 | 4.6 / 7 | 6.5 / 7 |
| Total score out of 69 | 47.0 / 69 | 42.5 / 69 | 60.8 / 69 |
Percentage of available points
Bars show the solution’s average recorded Claude and ChatGPT score as a percentage of the category maximum. Markers show the average and highest applicable scores, excluding N/A entries. Positions use unrounded scores; labels show points rounded to one decimal.
Where Claude and ChatGPT assigned higher scores
- Modeling fundamentals: 7.0 / 8. This was above the nine-solution average of 5.8 / 8. As examples, Measured scores high on these criteria: Tests predictive performance on held-out data; Handles sparse and correlated marketing activity; Models delayed and carryover media effects.
- Reporting, speed & decision workflows: 5.0 / 6. This was above the nine-solution average of 4.1 / 6. As examples, Measured scores high on these criteria: Provides self-service MMM exploration UI; Supports natural-language analysis of MMM results; Refreshes MMM to match decision cycles.
- Media coverage & analytical granularity: 5.8 / 8. This was below the nine-solution average of 6.0 / 8. As examples, Measured scores high on these criteria: Measures incremental ROAS across digital channel types; Measures incremental ROAS by digital campaign and ad set; Supports multiple brands, markets and business units.
Where scores were lower
- Scenario planning & budget optimization: 4.5 / 8. This was below the nine-solution average of 5.4 / 8.
- Promotions and other non-media drivers: 4.0 / 7. This was below the nine-solution average of 4.7 / 7.
- Modeling store sales & other retail outcomes: 4.3 / 7. Despite being one of Measured’s relatively lower-scoring categories, its score was still above the nine-solution average of 3.7 / 7.
4. Analytic Partners (research score: 42.8 out of 69)

Research overview
Analytic Partners received an average research score of 42.8 out of 69, the fourth-highest total in this nine-solution comparison. Claude and ChatGPT each assessed its public documentation on September 8, 2026, across 69 criteria in ten categories.
Category scorecard
| Category | Analytic Partners | Average research score | Highest research score |
|---|---|---|---|
| 1. Modeling store sales & other retail outcomes | 5.3 / 7 | 3.7 / 7 | 6.5 / 7 |
| 2. Promotions and other non-media drivers | 4.5 / 7 | 4.7 / 7 | 6.5 / 7 |
| 3. Media coverage & analytical granularity | 5.8 / 8 | 6.0 / 8 | 7.5 / 8 |
| 4. Modeling fundamentals | 4.0 / 8 | 5.8 / 8 | 7.5 / 8 |
| 5. Model calibration & Experiments | 3.0 / 6 | 3.5 / 6 | 5.8 / 6 |
| 6. Scenario planning & budget optimization | 6.3 / 8 | 5.4 / 8 | 7.0 / 8 |
| 7. Reporting, speed & decision workflows | 3.8 / 6 | 4.1 / 6 | 5.8 / 6 |
| 8. Data integration & quality | 4.5 / 7 | 4.3 / 7 | 6.3 / 7 |
| 9. Enterprise security & governance | 1.0 / 5 | 1.8 / 5 | 3.3 / 5 |
| 10. Retail experience, implementation & support | 4.8 / 7 | 4.6 / 7 | 6.5 / 7 |
| Total score out of 69 | 42.8 / 69 | 42.5 / 69 | 60.8 / 69 |
Percentage of available points
Bars show the solution’s average recorded Claude and ChatGPT score as a percentage of the category maximum. Markers show the average and highest applicable scores, excluding N/A entries. Positions use unrounded scores; labels show points rounded to one decimal.
Where Claude and ChatGPT assigned higher scores
- Scenario planning & budget optimization: 6.3 / 8. This was above the nine-solution average of 5.4 / 8. As examples, Analytic Partners scores high on these criteria: Optimizes spending across the trading calendar; Combines marketing and commercial decisions in scenarios; Simulates changes to marketing budgets.
- Modeling store sales & other retail outcomes: 5.3 / 7. This was above the nine-solution average of 3.7 / 7. As examples, Analytic Partners scores high on these criteria: Measures acquisition and retention by customer group; Measures incremental profit or contribution margin; Connects marketing impact to customer lifetime value.
- Media coverage & analytical granularity: 5.8 / 8. This was below the nine-solution average of 6.0 / 8. As examples, Analytic Partners scores high on these criteria: Measures incremental ROAS across digital channel types; Supports multiple brands, markets and business units; Measures Incremental ROAS of traditional and offline media.
Where scores were lower
- Enterprise security & governance: 1.0 / 5. This was below the seven-vendor average of 1.8 / 5.
- Modeling fundamentals: 4.0 / 8. This was below the nine-solution average of 5.8 / 8.
- Model calibration & Experiments: 3.0 / 6. This was below the nine-solution average of 3.5 / 6.
5. Ekimetrics (research score: 40.0 out of 69)
Research overview
Ekimetrics received an average research score of 40.0 out of 69, the fifth-highest total in this nine-solution comparison. Claude assessed its public documentation on September 14, 2026, and ChatGPT on September 8, 2026, each across 69 criteria in ten categories.
Category scorecard
| Category | Ekimetrics | Average research score | Highest research score |
|---|---|---|---|
| 1. Modeling store sales & other retail outcomes | 3.0 / 7 | 3.7 / 7 | 6.5 / 7 |
| 2. Promotions and other non-media drivers | 4.8 / 7 | 4.7 / 7 | 6.5 / 7 |
| 3. Media coverage & analytical granularity | 6.0 / 8 | 6.0 / 8 | 7.5 / 8 |
| 4. Modeling fundamentals | 5.8 / 8 | 5.8 / 8 | 7.5 / 8 |
| 5. Model calibration & Experiments | 2.5 / 6 | 3.5 / 6 | 5.8 / 6 |
| 6. Scenario planning & budget optimization | 5.0 / 8 | 5.4 / 8 | 7.0 / 8 |
| 7. Reporting, speed & decision workflows | 4.0 / 6 | 4.1 / 6 | 5.8 / 6 |
| 8. Data integration & quality | 4.0 / 7 | 4.3 / 7 | 6.3 / 7 |
| 9. Enterprise security & governance | 0.8 / 5 | 1.8 / 5 | 3.3 / 5 |
| 10. Retail experience, implementation & support | 4.3 / 7 | 4.6 / 7 | 6.5 / 7 |
| Total score out of 69 | 40.0 / 69 | 42.5 / 69 | 60.8 / 69 |
Percentage of available points
Bars show the solution’s average recorded Claude and ChatGPT score as a percentage of the category maximum. Markers show the average and highest applicable scores, excluding N/A entries. Positions use unrounded scores; labels show points rounded to one decimal.
Where Claude and ChatGPT assigned higher scores
- Media coverage & analytical granularity: 6.0 / 8. This was equal to the nine-solution average of 6.0 / 8. As examples, Ekimetrics scores high on these criteria: Measures incremental ROAS across digital channel types; Provides marginal returns; Supports multiple brands, markets and business units.
- Modeling fundamentals: 5.8 / 8. This was slightly below the nine-solution average; both round to 5.8 / 8. As examples, Ekimetrics scores high on these criteria: Models delayed and carryover media effects; Addresses confounding and demand capture; Models saturation and diminishing returns.
- Promotions and other non-media drivers: 4.8 / 7. This was above the nine-solution average of 4.7 / 7. As examples, Ekimetrics scores high on these criteria: Separates promotional uplift from media effects; Accounts for weather-driven demand; Separates effects of different promotion types.
Where scores were lower
- Enterprise security & governance: 0.8 / 5. This was below the seven-vendor average of 1.8 / 5.
- Model calibration & Experiments: 2.5 / 6. This was below the nine-solution average of 3.5 / 6.
- Modeling store sales & other retail outcomes: 3.0 / 7. This was below the nine-solution average of 3.7 / 7.
6. Circana (research score: 39.3 out of 69)

Research overview
Circana received an average research score of 39.3 out of 69, the sixth-highest total in this nine-solution comparison. Claude assessed its public documentation on September 14, 2026, and ChatGPT on September 8, 2026, each across 69 criteria in ten categories.
Category scorecard
| Category | Circana | Average research score | Highest research score |
|---|---|---|---|
| 1. Modeling store sales & other retail outcomes | 4.3 / 7 | 3.7 / 7 | 6.5 / 7 |
| 2. Promotions and other non-media drivers | 5.0 / 7 | 4.7 / 7 | 6.5 / 7 |
| 3. Media coverage & analytical granularity | 5.3 / 8 | 6.0 / 8 | 7.5 / 8 |
| 4. Modeling fundamentals | 3.8 / 8 | 5.8 / 8 | 7.5 / 8 |
| 5. Model calibration & Experiments | 3.0 / 6 | 3.5 / 6 | 5.8 / 6 |
| 6. Scenario planning & budget optimization | 5.3 / 8 | 5.4 / 8 | 7.0 / 8 |
| 7. Reporting, speed & decision workflows | 3.8 / 6 | 4.1 / 6 | 5.8 / 6 |
| 8. Data integration & quality | 4.0 / 7 | 4.3 / 7 | 6.3 / 7 |
| 9. Enterprise security & governance | 0.3 / 5 | 1.8 / 5 | 3.3 / 5 |
| 10. Retail experience, implementation & support | 4.8 / 7 | 4.6 / 7 | 6.5 / 7 |
| Total score out of 69 | 39.3 / 69 | 42.5 / 69 | 60.8 / 69 |
Percentage of available points
Bars show the solution’s average recorded Claude and ChatGPT score as a percentage of the category maximum. Markers show the average and highest applicable scores, excluding N/A entries. Positions use unrounded scores; labels show points rounded to one decimal.
Where Claude and ChatGPT assigned higher scores
- Promotions and other non-media drivers: 5.0 / 7. This was above the nine-solution average of 4.7 / 7. As examples, Circana scores high on these criteria: Accounts for availability and assortment changes; Accounts for weather-driven demand; Separates promotional uplift from media effects.
- Retail experience, implementation & support: 4.8 / 7. This was above the seven-vendor average of 4.6 / 7. As examples, Circana scores high on these criteria: Trains teams and supports adoption; Provides expert interpretation and planning support; Defines onboarding responsibilities and milestones.
- Media coverage & analytical granularity: 5.3 / 8. This was below the nine-solution average of 6.0 / 8. As examples, Circana scores high on these criteria: Supports multiple brands, markets and business units; Provides marginal returns; Measures incremental ROAS across digital channel types.
- Scenario planning & budget optimization: 5.3 / 8. This was below the nine-solution average of 5.4 / 8. As examples, Circana scores high on these criteria: Optimizes budgets across brands or business units; Simulates changes to marketing budgets; Optimizes channel allocation for a set budget.
Where scores were lower
- Enterprise security & governance: 0.3 / 5. This was below the seven-vendor average of 1.8 / 5.
- Modeling fundamentals: 3.8 / 8. This was below the nine-solution average of 5.8 / 8.
- Model calibration & Experiments: 3.0 / 6. This was below the nine-solution average of 3.5 / 6.
7. Meridian (research score: 37.8 out of 69)

Research overview
Meridian received an average research score of 37.8 out of 69, the seventh-highest total in this nine-solution comparison. Claude assessed its public documentation on September 14, 2026, and ChatGPT on September 9, 2026, each across 69 criteria in ten categories.
Category scorecard
| Category | Meridian | Average research score | Highest research score |
|---|---|---|---|
| 1. Modeling store sales & other retail outcomes | 1.5 / 7 | 3.7 / 7 | 6.5 / 7 |
| 2. Promotions and other non-media drivers | 4.5 / 7 | 4.7 / 7 | 6.5 / 7 |
| 3. Media coverage & analytical granularity | 5.8 / 8 | 6.0 / 8 | 7.5 / 8 |
| 4. Modeling fundamentals | 7.5 / 8 | 5.8 / 8 | 7.5 / 8 |
| 5. Model calibration & Experiments | 4.5 / 6 | 3.5 / 6 | 5.8 / 6 |
| 6. Scenario planning & budget optimization | 5.5 / 8 | 5.4 / 8 | 7.0 / 8 |
| 7. Reporting, speed & decision workflows | 3.8 / 6 | 4.1 / 6 | 5.8 / 6 |
| 8. Data integration & quality | 4.8 / 7 | 4.3 / 7 | 6.3 / 7 |
| 9. Enterprise security & governance | N/A | 1.8 / 5 | 3.3 / 5 |
| 10. Retail experience, implementation & support | N/A | 4.6 / 7 | 6.5 / 7 |
| Total score out of 69 | 37.8 / 69 | 42.5 / 69 | 60.8 / 69 |
Percentage of available points
Bars show the solution’s average recorded Claude and ChatGPT score as a percentage of the category maximum. Markers show the average and highest applicable scores, excluding N/A entries. Positions use unrounded scores; labels show points rounded to one decimal.
Where Claude and ChatGPT assigned higher scores
- Modeling fundamentals: 7.5 / 8. This was above the nine-solution average of 5.8 / 8. It tied Meta Robyn for the highest category score. As examples, Meridian scores high on these criteria: Exposes model assumptions and parameters; Reports uncertainty in incremental effects; Models delayed and carryover media effects.
- Model calibration & Experiments: 4.5 / 6. This was above the nine-solution average of 3.5 / 6. As examples, Meridian scores high on these criteria: Calibrates MMM using geo or first-party experiments; Checks calibration relevance and uncertainty; Uses MMM uncertainty to prioritize further tests.
- Media coverage & analytical granularity: 5.8 / 8. This was below the nine-solution average of 6.0 / 8. As examples, Meridian scores high on these criteria: Provides geographic estimates below national level; Provides marginal returns; Measures incremental ROAS across digital channel types.
Categories marked N/A and lower-scoring areas
- Enterprise security & governance: N/A. Security controls depend on the hosted deployment and require a separate review.
- Retail experience, implementation & support: N/A. Retail deployments, onboarding and ongoing support depend on the implementing team or service partner.
- Modeling store sales & other retail outcomes: 1.5 / 7. This was below the nine-solution average of 3.7 / 7.
8. Meta Robyn (research score: 34.0 out of 69)

Research overview
Meta Robyn received an average research score of 34.0 out of 69, the eighth-highest total in this nine-solution comparison. Claude assessed its public documentation on September 14, 2026, and ChatGPT on September 9, 2026, each across 69 criteria in ten categories.
Category scorecard
| Category | Meta Robyn | Average research score | Highest research score |
|---|---|---|---|
| 1. Modeling store sales & other retail outcomes | 2.0 / 7 | 3.7 / 7 | 6.5 / 7 |
| 2. Promotions and other non-media drivers | 4.5 / 7 | 4.7 / 7 | 6.5 / 7 |
| 3. Media coverage & analytical granularity | 6.0 / 8 | 6.0 / 8 | 7.5 / 8 |
| 4. Modeling fundamentals | 7.5 / 8 | 5.8 / 8 | 7.5 / 8 |
| 5. Model calibration & Experiments | 3.8 / 6 | 3.5 / 6 | 5.8 / 6 |
| 6. Scenario planning & budget optimization | 4.0 / 8 | 5.4 / 8 | 7.0 / 8 |
| 7. Reporting, speed & decision workflows | 2.8 / 6 | 4.1 / 6 | 5.8 / 6 |
| 8. Data integration & quality | 3.5 / 7 | 4.3 / 7 | 6.3 / 7 |
| 9. Enterprise security & governance | N/A | 1.8 / 5 | 3.3 / 5 |
| 10. Retail experience, implementation & support | N/A | 4.6 / 7 | 6.5 / 7 |
| Total score out of 69 | 34.0 / 69 | 42.5 / 69 | 60.8 / 69 |
Percentage of available points
Bars show the solution’s average recorded Claude and ChatGPT score as a percentage of the category maximum. Markers show the average and highest applicable scores, excluding N/A entries. Positions use unrounded scores; labels show points rounded to one decimal.
Where Claude and ChatGPT assigned higher scores
- Modeling fundamentals: 7.5 / 8. This was above the nine-solution average of 5.8 / 8. It tied Meridian for the highest category score. As examples, Meta Robyn scores high on these criteria: Tests predictive performance on held-out data; Reports uncertainty in incremental effects; Models delayed and carryover media effects.
- Media coverage & analytical granularity: 6.0 / 8. This was equal to the nine-solution average of 6.0 / 8. As examples, Meta Robyn scores high on these criteria: Measures incremental ROAS across digital channel types; Measures Incremental ROAS of traditional and offline media; Provides marginal returns.
- Promotions and other non-media drivers: 4.5 / 7. This was below the nine-solution average of 4.7 / 7. As examples, Meta Robyn scores high on these criteria: Separates promotional uplift from media effects; Separates effects of different promotion types; Models retail seasonality and trading events.
Categories marked N/A and lower-scoring areas
- Enterprise security & governance: N/A. Security controls depend on the hosted deployment and require a separate review.
- Retail experience, implementation & support: N/A. Retail deployments, onboarding and ongoing support depend on the implementing team or service partner.
- Modeling store sales & other retail outcomes: 2.0 / 7. This was below the nine-solution average of 3.7 / 7.
9. Kantar (research score: 33.8 out of 69)

Research overview
Kantar received an average research score of 33.8 out of 69, the ninth-highest total in this nine-solution comparison. Claude assessed its public documentation on September 14, 2026, and ChatGPT on September 9, 2026, each across 69 criteria in ten categories.
Category scorecard
| Category | Kantar | Average research score | Highest research score |
|---|---|---|---|
| 1. Modeling store sales & other retail outcomes | 2.5 / 7 | 3.7 / 7 | 6.5 / 7 |
| 2. Promotions and other non-media drivers | 3.0 / 7 | 4.7 / 7 | 6.5 / 7 |
| 3. Media coverage & analytical granularity | 5.5 / 8 | 6.0 / 8 | 7.5 / 8 |
| 4. Modeling fundamentals | 5.3 / 8 | 5.8 / 8 | 7.5 / 8 |
| 5. Model calibration & Experiments | 0.3 / 6 | 3.5 / 6 | 5.8 / 6 |
| 6. Scenario planning & budget optimization | 5.5 / 8 | 5.4 / 8 | 7.0 / 8 |
| 7. Reporting, speed & decision workflows | 3.8 / 6 | 4.1 / 6 | 5.8 / 6 |
| 8. Data integration & quality | 3.0 / 7 | 4.3 / 7 | 6.3 / 7 |
| 9. Enterprise security & governance | 2.3 / 5 | 1.8 / 5 | 3.3 / 5 |
| 10. Retail experience, implementation & support | 2.8 / 7 | 4.6 / 7 | 6.5 / 7 |
| Total score out of 69 | 33.8 / 69 | 42.5 / 69 | 60.8 / 69 |
Percentage of available points
Bars show the solution’s average recorded Claude and ChatGPT score as a percentage of the category maximum. Markers show the average and highest applicable scores, excluding N/A entries. Positions use unrounded scores; labels show points rounded to one decimal.
Where Claude and ChatGPT assigned higher scores
- Media coverage & analytical granularity: 5.5 / 8. This was below the nine-solution average of 6.0 / 8. As examples, Kantar scores high on these criteria: Measures incremental ROAS across digital channel types; Measures Incremental ROAS of traditional and offline media; Supports multiple brands, markets and business units.
- Scenario planning & budget optimization: 5.5 / 8. This was above the nine-solution average of 5.4 / 8. As examples, Kantar scores high on these criteria: Simulates changes to marketing budgets; Optimizes channel allocation for a set budget; Optimizes spending across the trading calendar.
- Modeling fundamentals: 5.3 / 8. This was below the nine-solution average of 5.8 / 8. As examples, Kantar scores high on these criteria: Models delayed and carryover media effects; Models saturation and diminishing returns; Addresses confounding and demand capture.
Where scores were lower
- Model calibration & Experiments: 0.3 / 6. This was below the nine-solution average of 3.5 / 6.
- Modeling store sales & other retail outcomes: 2.5 / 7. This was below the nine-solution average of 3.7 / 7.
- Retail experience, implementation & support: 2.8 / 7. This was below the seven-vendor average of 4.6 / 7.
Frequently Asked Questions
1. What is MMM for retail, and how does it differ from attribution?
Retail MMM estimates marketing contributions from historical media, sales and business data. It can include store sales and factors such as promotions without observing each customer's click path. Attribution allocates credit using its own rules or model. Compare the two using the same sales outcome, scope and period.
2. Which MMM solutions received the highest research scores?
Sellforte received 60.8/69. Ipsos MMA and Measured tied at 47.0/69. Ipsos MMA led promotions and other non-media drivers, while Meridian and Meta Robyn tied for the highest modeling-fundamentals score. These rankings describe this public-documentation evaluation and its stated criteria.
3. Which MMM solution is best for retailers with both stores and ecommerce?
Sellforte received the highest retail-outcomes score at 6.5/7, followed by Analytic Partners at 5.3/7. Sellforte, Circana and Measured each received full average credit for separate store and ecommerce results. Ask to see the store-sales feed, the effect of each media channel on each sales channel, and the product-category detail your business needs.
4. Why do promotions need to be separated from media effects?
Promotions can change demand while advertising is running. If the model does not distinguish them appropriately, it can attribute promotional sales changes to media. The framework evaluates separate promotional uplift, promotion types, halo and cannibalization, as well as availability and other non-media drivers.
5. Which tools scored highest for campaign and ad-set measurement and optimization?
Sellforte was the only tool to receive full average credit for both campaign-and-ad-set iROAS measurement (3.2) and spending and bidding recommendations (7.4). Measured received 0.8/1 on the measurement criterion; Ipsos MMA received 0.8/1 on recommendations. The two criteria assess different steps in the workflow.
6. How do Meridian and Robyn compare with commercial MMM platforms?
Meridian and Robyn each received 7.5/8 for modeling fundamentals, the highest category score. Categories 9 and 10 are N/A for both frameworks because these requirements depend on an implementation or partner service. Compare the library plus your proposed delivery setup against the commercial service you would buy.
7. How can experiments improve retail MMM?
Relevant experiments can inform priors, parameters, constraints or response estimates. Their use requires aligning outcomes, channels, markets and time windows, while considering uncertainty and evidence age. Sellforte received the highest calibration-category score at 5.8/6, followed by Ipsos MMA at 4.8/6 and Meridian at 4.5/6.
Change log
2026 March 10. "Best MMM Solutions for Retail brands" published as a listicle
2026 September 15. Initial listicle format changed to a detailed research, including evaluation criteria and Claude & ChatGPT -conducted evaluation of each vendor.
Evaluation Dates by Vendor and LLM
The table reproduces the dates and model-version labels from the source workbook.
| Vendor | LLM | LLM version as recorded | Evaluation date |
|---|---|---|---|
| Sellforte | ChatGPT | GPT-6 Astra High | September 8, 2026 |
| Sellforte | Claude | Fable 5.1 High | September 8, 2026 |
| Ipsos MMA | ChatGPT | GPT-6 Astra High | September 9, 2026 |
| Ipsos MMA | Claude | Fable 5.1 High | September 14, 2026 |
| Measured | ChatGPT | GPT-6.0 Astra High | September 8, 2026 |
| Measured | Claude | Fable 5.1 High | September 9, 2026 |
| Analytic Partners | ChatGPT | GPT-6 Astra High | September 8, 2026 |
| Analytic Partners | Claude | Fable 5.1 High | September 8, 2026 |
| Ekimetrics | ChatGPT | GPT-6.0 Astra High | September 8, 2026 |
| Ekimetrics | Claude | Fable 5.1 High | September 14, 2026 |
| Circana | ChatGPT | GPT-6 Astra High | September 8, 2026 |
| Circana | Claude | Fable 5.1 High | September 14, 2026 |
| Meridian | ChatGPT | GPT-6 Astra High | September 9, 2026 |
| Meridian | Claude | Fable 5.1 High | September 14, 2026 |
| Meta Robyn | ChatGPT | GPT-6 Astra High | September 9, 2026 |
| Meta Robyn | Claude | Fable 5.1 High | September 14, 2026 |
| Kantar | ChatGPT | GPT-6 Astra High | September 9, 2026 |
| Kantar | Claude | Fable 5.1 High | September 14, 2026 |
Limitations & Disclosures
Author affiliation. Sellforte designed and published this comparison and is one of the tools evaluated. Claude and ChatGPT assigned the scores.
Evidence and product scope. This is a public-documentation assessment of seven commercial tools and one open-source library, not a hands-on product test or an exhaustive market survey. It does not measure pricing, implementation quality, service quality, customer outcomes, or the accuracy of the statistical methods in production. A zero score records missing public evidence under the methodology.
Snapshot in time. The current results use assessments completed September 8–14, 2026. Documentation and products may change.
Interpretation of totals. Each of the criteria has equal weight, so categories with more criteria contribute more to the total. The same framework may fit some products and buyer needs better than others.
Corrections. Vendors can submit documentation supporting a correction or re-evaluation to research@sellforte.com.
Buyer decisions. Use the comparison to prepare vendor questions and demonstrations. Verify your required workflows, deployment options, integrations, governance, support, and costs directly before selecting a product.
Further Reading & Resources
Asked by Marketers: Practical questions about retail MMM
- How can MMM measure the impact of digital advertising on offline store sales?
- When should an omnichannel retailer use MMM, MTA, or incrementality testing?
- How much should we let an MMM optimizer change the media mix at once?
- How often should you retrain your Marketing Mix Model (MMM)?
- Can you trust Meta Conversion Lift tests for MMM calibration?
- What changes when an ecommerce or retail company adopts incrementality?
MMM Methdology
- Calibrating Marketing Mix Models with Experiments and Attribution data
- Advertising response curves: What are they and why do you need them?
- What is Causal Marketing Mix Modeling (MMM)?
- Understanding R2 in Marketing Mix Modeling: A Guide for Marketers
- MMM for Ecommerce: How Marketing Mix Modeling (MMM) Works for Online DTC Brands
- What does "Enterprise-Grade" Mean in Marketing Mix Modeling (MMM)?
- What is Incrementality Testing? Guide for Marketers
- Marginal Incremental ROAS (miROAS): What is it? And why does it matter to marketers?
- How Much Ad Spend Is Needed for Marketing Mix Modeling?
MMM, AI and Agents
- The Rise of Agentic MMM (Marketing Mix Modeling): How AI Is Transforming Media Optimization
- State of AI in MMM: Only 13% of MMM Vendors Implementing AI
- Webinar: Agentic MMM in Action: The Future of Autonomous Media Planning and Buying in Real Time
Use-cases: Using MMM to optimize media spend
- 11 Benefits of Marketing Mix Modeling (MMM) Every Marketer Should Know
- 6 Reasons eCommerce & DTC Brands Should Use Marketing Mix Modeling (MMM)
- The Shift in Marketing Mix Modeling: Why Campaign-Level Optimization is Taking Over
- The Five Requirements of Autonomous Media Buying and Optimization: M.A.G.I.C.
- Bid Optimization: How to Calculate the Optimal Bid Values for Your Campaigns Using miROAS
- ROAS, iROAS, miROAS: Choosing the Right KPI for Optimizing Media Spend
Original MMM Research by Sellforte Labs
- The 3 Danger Zones of Last-Click (And How to Avoid Them)
- How to measure Meta correctly? GA4 vs. MTA vs. MMM
- How to Measure the True Effectiveness of TikTok Ads?
- From Last-click to Marketing Mix Modeling (MMM): Unlock +6.5% more sales
- The Missing 24%: Why MMM Without Promotions Behaves Like Last-Click
Practical hands-on MMM guides
- How to Integrate Experiments Into an MMM Platform: A Practical Guide
- MMM Pilot Best Practices: 4 Steps to Plan, Run & Scale Your Marketing Mix Modeling Pilot
MMM tools, MMM software and MMM vendors
MMM tools, software and vendors for Ecommerce
- Best MMM Tools for Ecommerce Brands: Top 10 Software for 2026
- Top 5 Enterprise MMM Software for Large Ecommerce Brands ($1B+ in Sales)
- Top 5 Mid-Market MMM Software for Medium-Sized Ecommerce Brands ($50M–$1B Revenue)
MMM and incrementality testing tools, software and vendors more broadly
- 25 Marketing Mix Modeling Tools for Accelerating Growth in 2025
- Best Conversational AI Tools for MMM and Incrementality Testing
- Meridian vs. Sellforte MMM SaaS: The Complete Comparison for 2026
- Best Incrementality Testing Tools
- How to choose a Marketing Mix Modeling solution in Retail
Review MMM SaaS Product Features
- Visit Sellforte demo (no sign-up required): Sellforte demo
Research papers and whitepapers
- Challenges And Opportunities In Media Mix Modeling (2017, Google - Chan et al.) Link
- Bayesian Methods for Media Mix Modeling with Carryover and Shape Effects (2017, Google - Jin et al.) Link
- Geo-level Bayesian Hierarchical Media Mix Modeling (2017, Google - Sun et al.) Link
- Hierarchical Bayesian Approach to Improve Media Mix Models Using Category Data (2017, Google, Wang et. al) Link
- Bayesian Time Varying Coefficient Model with Applications to Marketing Mix Modeling (2021, Uber - Ng et al.) Link
- Hierarchical Marketing Mix Models with Sign Constraints (2020, Cheng et al.) Link
- Bayesian Hierarchical Media Mix Model Incorporating Reach and Frequency Data (2023, Google - Zhang et al.) Link
- Media Mix Model Calibration With Bayesian Priors (2024, Zhang et al.) Link
Author

Lauri Potka is the Chief Operating Officer at Sellforte, with over 15 years of experience in Marketing Mix Modeling, marketing measurement, and media spend optimization. Before joining Sellforte, he worked as a management consultant at the Boston Consulting Group, advising some of the world’s largest advertisers on data-driven marketing optimization. Follow Lauri in LinkedIn, where he is

Best Incrementality Testing Tools in 2026: In-depth Vendor Comparison

6 Best Conversational AI Tools for MMM and Incrementality Testing in 2026: An In-Depth Comparison
.png)