Sellforte Incrementality Testing

Incrementality testing software for better media decisions

Measure the incremental impact of your marketing. Bring geo experiments, Meta Conversion Lift Studies, and A/B tests into a unified test library. Identify your next testing opportunity.

Available as a standalone Incrementality Testing product.

Incrementality testing tool for all test types

Analyze geo tests to measure incremental sales

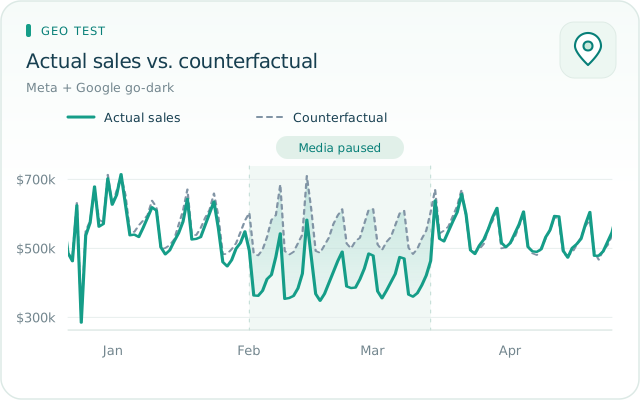
See what happens to sales when you increase, reduce, or pause media spend in selected markets. Choose test and control regions using the data already connected to Sellforte. Our Bayesian synthetic control method estimates what sales would have been without the change, helping you quantify incremental sales and iROAS, understand uncertainty, and decide where to invest next.

Geo test: actual sales fall below the counterfactual while media is paused. Example data.

Import and analyze Conversion Lift Studies

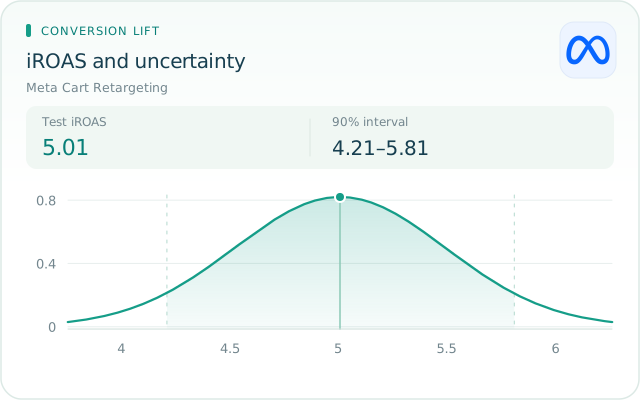
Bring the results of your Conversion Lift Studies into Sellforte for a clear view of advertising impact. Review incremental sales, iROAS, and confidence in a consistent dashboard, with an AI summary that explains the findings. Store each study alongside your other experiments so your team can compare results and use the evidence in budget decisions.

Conversion Lift: iROAS probability curve with mean 5.01 and a 90% interval of 4.21–5.81. Example data.

Analyze A/B tests for catalogs and owned media

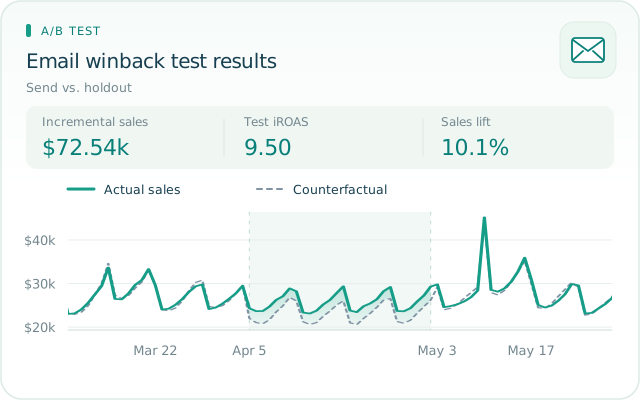
Find out whether catalog mailings, email campaigns, and other owned media generate additional sales. Upload performance data from before and during the test for the groups that received the activity and those that did not. Sellforte estimates the incremental effect and its uncertainty using the same methodology as geo tests. Analyze sales or another KPI, and include spend data when you want to calculate iROAS.

A/B email winback test: $72.54k incremental sales, 9.50 iROAS, 10.1% sales lift, and actual sales versus the counterfactual. Example data.

Test Library: All your tests in one place

Keep geo tests, Meta Conversion Lift Studies, and A/B tests in one shared library. See what was tested, where and when it ran, and the results, including spend, iROAS, and confidence. Open a completed experiment for its detailed analysis and AI summary, so your team can build on previous findings when making the next media decision. Filter your library by ad platform, country, experiment type, status, or date range, and search for a specific test by name. 

Compare your test results

Review geo tests, Conversion Lift Studies and A/B tests in one shared overview, with spend, iROAS and confidence side by side.

Test library
TestSpendiROASConfidence
Meta Cart RetargetingConversion Lift · United States$61.11k5.0196%
Meta + Google go-darkGeo test · United States$1.08M5.06100%
Email winback pushA/B Test · United States$7.63k9.50100%
Meta full-funnelConversion Lift · United States$350.41k3.1498%
Meta ProspectingConversion Lift · United States$360.61k2.6595%

Find the tests you need

Filter by test type, ad platform, country, status or date range. Search by name to get straight to the test you’re looking for.

Find a test
Test type
A/B Test
Country
United States
Ad platform
All platforms
Status
Analyzed
1 matching testEmail winback pushA/B Test · Apr–May 2026
Analyzed

Explore each test’s impact

Open a completed test for incremental sales, iROAS and uncertainty. Use the AI summary to understand the findings and inform your next media decision.

Email winback pushA/B Test · United States
Incremental sales
$72.54k
Test iROAS
9.50
iROAS · 90% interval
8.879.5010.12
AI summary

The winback campaign generated 10.1% more sales in the test group than the control group, adding $72.54k in incremental sales.

Example data

Test Prioritizer: Find your next testing opportunity

Find the most valuable incrementality tests to run next. Test Prioritizer ranks opportunities across your media mix using Impact, Confidence and Ease, drawing on your media investment and past testing activity. Understand why each opportunity ranks and focus your testing roadmap on the gaps that matter.

Know what to test next

Compare ranked opportunities across your media mix and focus on the tests that can add the most valuable evidence.

Ranked testing opportunities
ImpactConfidenceEase
#Media & marketWhy it ranksPriority / 10
1Meta SalesMeta Ads · Germany9.6
2Meta SalesMeta Ads · United States9.2
3Meta ProspectingMeta Ads · Germany9.2
4Meta Advantage+Meta Ads · United States9.1
5Meta ProspectingMeta Ads · United States9.1

See why an opportunity ranks

Get a clear explanation of each test’s priority score, based on its Impact, Confidence and Ease.

Meta Sales · Germany9.6 / 10
  • Impact3.0High media spend
  • Confidence3.3Never tested
  • Ease3.3Conversion lift available

Find gaps in testing coverage

See which parts of your media mix have recent test evidence, and how much of your spend those tests cover.

Testing coverage
29%

of media spend tested
in the last 12 months

8 of 65

media features
tested

Recent test evidence across your media mix

Example data

Bring incrementality testing into your own AI Workflows

Geo test results
You

Did pausing media affect sales?

AI

Let’s compare actual sales with the counterfactual.

Conversion Lift
You

How strong is the evidence?

AI

Here’s the iROAS estimate and its uncertainty.

Test comparison
You

How do these studies compare?

AI

Let’s compare iROAS, markets, and test periods.

Next test ideas
You

What should we test next?

AI

Let’s look for gaps in your test evidence.

Test vs. MMM
You

Does this agree with our MMM?

AI

Let’s compare results for the same channel.

A/B test readout
You

Did the email drive extra sales?

AI

Let’s compare the test and holdout groups.

Experiment report
You

Summarize this test for the team.

AI

Here’s a draft covering results and uncertainty.

Business context
You

Could our promotion explain it?

AI

Let’s review the test alongside your campaign brief.

Integrate incrementality tests into your measurement

Calibrate your MMM

Use incrementality tests to ground your marketing mix model in measured results. Review the studies behind each media feature, compare their iROAS estimates and uncertainty, and use that evidence to calibrate your model’s priors.

MMM calibration3 studies linked
Meta Prospecting · RevenueMeta Ads · United States · Short uplift
Weighted Experiment iROAS
1.64
Approx. 90% interval
1.39–1.88
Contributing experimentsiROAS90% intervalWeight
Meta US upper-funnel1.341.21–1.4772%
Meta US prospecting2.401.58–3.2228%
Meta US prospecting · follow-upBelow 50% significance2.10−0.31–4.510%

Incrementality-correct your attribution

Use evidence from incrementality tests in your day-to-day optimization. Sellforte can apply channel-specific calibration factors to your attribution, so you can compare incremental ROAS at the campaign and ad-set level and invest in what drives additional sales.

Attribution correctionMMM + experiments
ChannelLast-click
ROAS
Incrementality
factor
Incremental
ROAS
Meta Advantage+3.62.17×7.8
Meta Awareness0.48.90×3.5
Google Performance Max5.70.76×4.3
Google Branded Search20.00.16×3.2
Google Generic Search6.80.71×4.8
Attributed ROASCalibration factorIncremental ROAS

Sellforte Market Areas

Run geo experiments on a consistent regional foundation

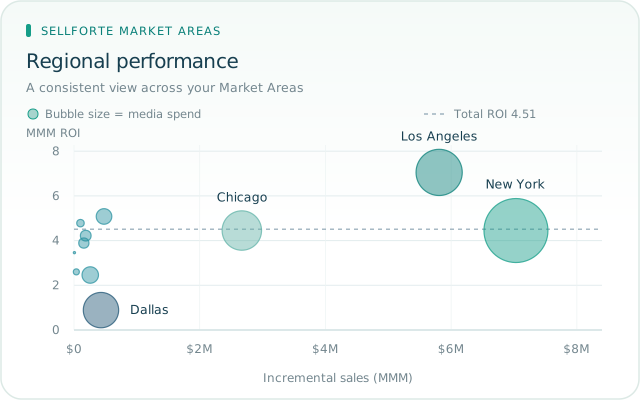
Standardize regional data across ad platforms and business systems before your geo test begins. Sellforte Market Areas harmonize different geographic definitions into one consistent structure, making it easier to define treatment and control regions, analyze lift, and reuse the same geographic foundation across experiments and regional MMM.

Learn more about Sellforte Market Areas

Regional MMM performance across Sellforte Market Areas. Each bubble is a region; its position shows incremental sales and ROI, and its size represents media spend.

Ready to see Sellforte in action?