
Marketing Mix Modeling (MMM) is a statistical analysis technique that estimates how marketing activities and other business drivers contribute to sales or other outcomes. Marketers use it to measure incremental performance and decide how to allocate their budgets.
MMM can bring ecommerce and store sales into the same analysis. It uses aggregated data over time, which reduces its reliance on tracking individual customers as cookies and consent choices change.
This guide explains how MMM works, the outputs it produces, the data you need, and how to use the results in media decisions.

How does marketing mix modeling work?
Marketing Mix Modeling uses statistical regression on historical time-series data to estimate how different marketing activities and external factors (like seasonality or pricing) contribute to sales or other business outcomes.
Three parts of the approach help explain how MMM works:
- General concept: All Marketing Mix Models are based on time-series analysis.
- Bayesian modeling: 80%+ of Marketing Mix Models nowadays are based on a specific time-series analysis method: Bayesian Marketing Mix Modeling.
- Model calibration: Next Gen MMMs leverage advanced modeling methods, such as model calibration, for radically higher quality MMM results.
1. Time-series analysis and incremental impact
MMM analyzes how sales and marketing activity change over time, alongside other factors that affect demand. It estimates what sales would have been under a different level of advertising, while accounting for factors such as seasonality, promotions, prices, and other media.
The illustration below shows sales rising when Meta campaigns are active, followed by a larger peak when Google campaigns are also active. Those patterns give the model information, but two peaks alone cannot establish either channel's incremental contribution.

To separate their effects, the model needs enough variation in when and how much each channel spends. If channels always move together, it can be difficult to distinguish their contributions. Promotions or changes in customer demand may also affect both media spending and sales, so relevant drivers need to be included in the analysis.
MMM also accounts for advertising carryover, often called adstock: an ad can influence purchases after the initial exposure. Response curves describe how incremental sales change with spending and capture diminishing returns as a channel becomes more saturated.
The resulting estimates depend on the data and modeling assumptions. Review uncertainty around channel effects and check them against relevant experiments where available. A model can predict total sales well while still assigning the wrong contribution to individual channels. Our guide to causal marketing mix modeling explains this distinction.
2. Bayesian marketing mix modeling
Bayesian Marketing Mix Modeling, used by 80%+ of MMM vendors and practitioners today, is the gold standard for Marketing Mix Modeling. Bayesian MMM was originally popularized by Google Research in 2017 (see e.g., link), and it has several benefits over legacy models.
Compared to legacy models, Bayesian models produce more robust ROI estimates with limited data, are better at handling uncertainty, and can better manage challenges related to overfitting.
Bayesian MMM can incorporate knowledge about media effectiveness before fitting the model. A prior is a probability distribution describing plausible values and uncertainty. The posterior is the updated distribution after the model combines that prior with the observed data.
3. Model calibration
Model calibration in MMM is used extensively by the most advanced MMM platforms. Model calibration significantly improves the ROI estimates for individual channels, but also improves the model’s stability as a whole. Model calibration started slowly gaining popularity in 2023, after Igor Skokan et al. launched their article in Harvard Business Review.
MMM calibration brings evidence about media effectiveness into the model. Suitable evidence includes conversion lift studies, geo experiments, and other tests that estimate incremental outcomes for a defined intervention. Attribution data and benchmarks can also inform calibration when their limitations and any corrections are made explicit.
In a Bayesian MMM, this evidence can inform a prior distribution. For example, a prior might place most probability near an iROAS of 4 while allowing lower and higher values. Its width expresses uncertainty about the effect; it does not require the fitted estimate to equal 4 or stay inside a fixed range.

Strong evidence from comparable campaigns and sales outcomes can support a narrower distribution. An older test, a different market, or an uncertain result may justify a wider one. Narrowing a prior without sufficient evidence can make the model appear more certain than it should be. The posterior reflects both the prior and the information in the modeling data.
Sellforte uses experimental evidence alongside attribution data from sources such as GA4, ad platforms, and MTA. Each input needs to be assessed before it can inform calibration. A lift study's campaign scope, dates, sales definition, and uncertainty need to be matched to the model. Attribution data requires corrections for its biases.
An experiment library and calibration interface make those choices traceable. Teams can inspect which studies contributed, how they were weighted, and how the prior compares with the fitted result.
How does MMM compare with attribution and experiments?
The methods answer different questions and can support the same measurement workflow. Attribution helps teams monitor customer journeys and campaign activity. Experiments estimate the effect of a specific intervention. MMM combines sales, media, and business data to support broader budget decisions.
| Method | Useful for | What to keep in mind |
|---|---|---|
| Marketing mix modeling | Estimating incremental effects across media and other sales drivers; comparing budget scenarios. | Results depend on data variation, model assumptions, and the granularity the evidence supports. |
| Attribution | Assigning conversion credit to observed interactions and monitoring campaign activity. | Attributed credit alone does not establish how many sales would disappear without the advertising. |
| Incrementality experiments | Estimating the causal effect of a defined change using treatment and control groups. | Results apply to the tested campaigns, population, period, and spending change. Transferring them to other conditions adds uncertainty. |
For example, an experiment can inform MMM calibration, and the resulting incrementality estimates can help interpret campaign attribution. See our guides to incrementality testing and incremental attribution for those connections.
What are the main outputs from marketing mix modeling?
The main outputs are a breakdown of sales drivers, incremental return estimates, response curves, and marginal returns. Together, they connect historical performance to budget decisions.
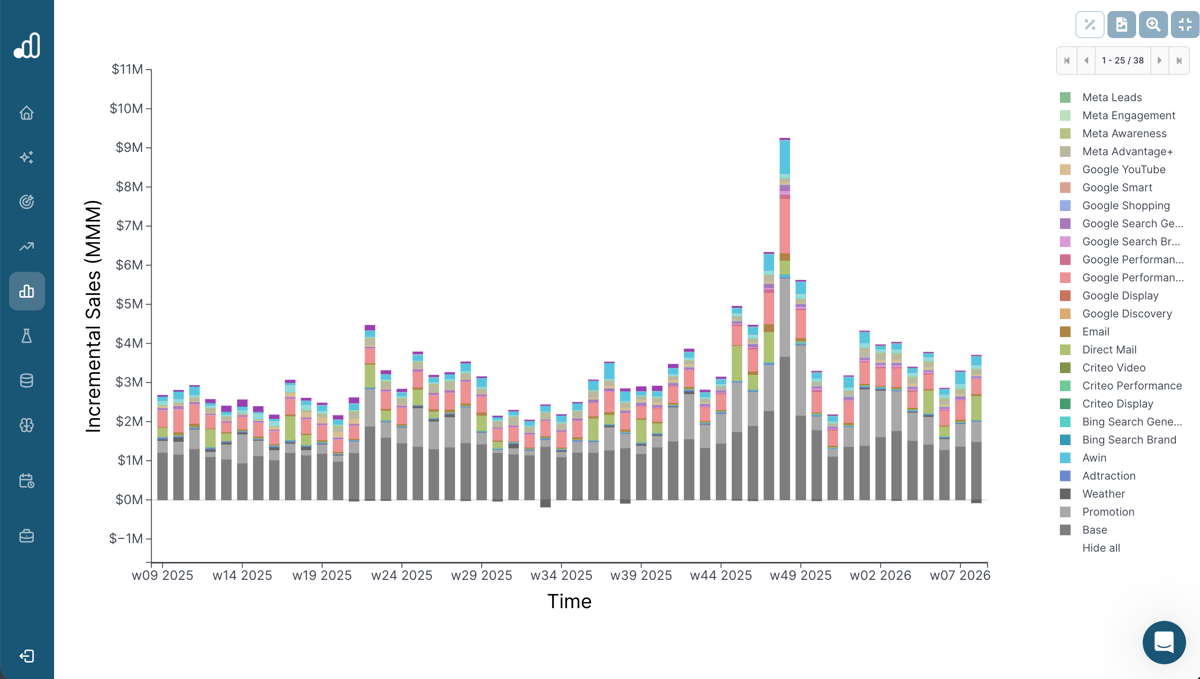
1. A breakdown of sales drivers
MMM estimates the sales contribution of media and promotions alongside the baseline and other non-media drivers, such as weather. The baseline represents the sales expected without the modeled media and promotional activity, under the model's assumptions.
A sales decomposition chart summarizes these contributions. The exact categories depend on the model and the business, as illustrated in this Sellforte view:
2. Incremental return by channel, campaign, or ad set
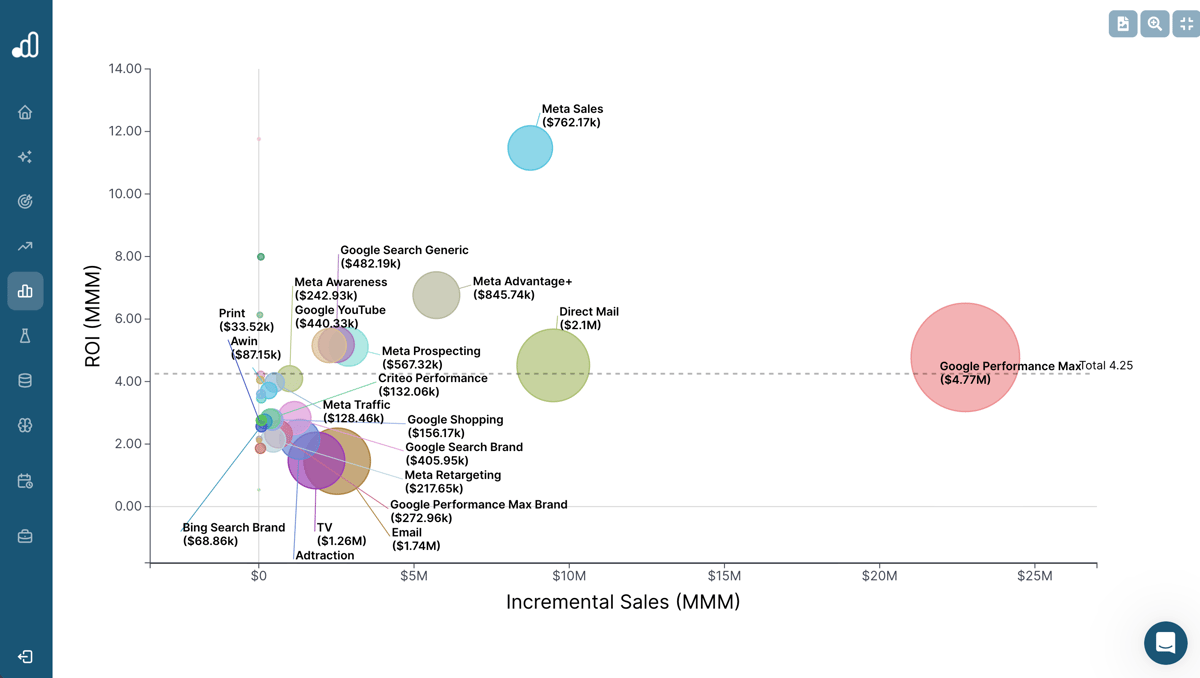
When the outcome is revenue, incremental ROAS (iROAS) is incremental revenue divided by advertising spend. An iROAS of 4 means the model estimates €4 in incremental revenue for each €1 spent over the measured period. Profit-based ROI requires a separate calculation that includes margins and costs.
| Metric | Formula | Use |
|---|---|---|
| Attributed ROAS | Attributed revenue ÷ ad spend | Understand reported conversion credit under the chosen attribution method. |
| Incremental ROAS (iROAS) | Incremental revenue ÷ ad spend | Assess average incremental revenue generated per euro or dollar over the measured period. |
| Marginal incremental ROAS (miROAS) | Slope of incremental revenue versus ad spend at the current spend level | Compare the expected incremental revenue from the next euro or dollar. |
| Incremental profit ROI | (Incremental contribution before media cost − ad spend) ÷ ad spend | Evaluate profit return after deducting media cost. Define which other variable costs are included in contribution. |
Some dashboards use ROI as a broader label for return. Check whether the reported result uses revenue, contribution, or profit before comparing it with another metric. Our guide to ROAS, iROAS, and miROAS explains how to use each measure.
3. Response curves
A response curve estimates how a channel's incremental sales change with spending. It captures diminishing returns: as a channel becomes more saturated, additional spending tends to generate less incremental revenue per euro.
Historical average iROAS does not show how much room a channel has to scale. A channel with a strong average return can have a low marginal return at its current budget. In the illustration below, channel B has a higher average return but is more saturated, while channel A has more room to scale.

4. Marginal incremental ROAS (miROAS)
Marginal incremental ROAS (miROAS) estimates the incremental revenue generated by the next euro or dollar of advertising spend. It is the slope of the response curve at the current spend level.
As spending increases and saturation grows, miROAS generally decreases. For a substantial budget change, use the full response curve to estimate the result, because the marginal return changes along the curve.

Worked example: turning MMM results into a budget decision
Consider an illustrative monthly media budget of €150,000 across paid social and paid video. The figures below are hypothetical model estimates for the same sales outcome and measurement period.
| Measure | Paid social | Paid video |
|---|---|---|
| Current ad spend | €100,000 | €50,000 |
| Estimated incremental revenue | €400,000 | €150,000 |
| Historical iROAS | 4.0 | 3.0 |
| miROAS at current spend | 1.5 | 2.5 |
| Proposed ad spend | €90,000 | €60,000 |
| Predicted incremental revenue at proposed spend | €384,000 | €173,000 |
Paid social has the higher historical iROAS: €400,000 ÷ €100,000 = 4.0. Paid video has the higher miROAS, so the next euro is expected to generate more incremental revenue there.
Suppose the model's full response curves predict that moving €10,000 from paid social to paid video reduces social's contribution by €16,000 and increases video's by €23,000. Total modeled incremental revenue rises from €550,000 to €557,000 at the same €150,000 budget, an estimated gain of €7,000.
Those scenario estimates come from the response curves, rather than multiplying the starting miROAS by €10,000. Before making the change, review uncertainty, margins, and delivery constraints. Implement a manageable adjustment and evaluate the result before scaling further.
Why marketing mix modeling matters for advertisers
MMM helps marketers evaluate where spending is generating incremental sales and where a different allocation could improve results.
In Sellforte's optimization research, models and optimization tools identified estimated sales improvement potential of 6.5% for a sample of 27 ecommerce/DTC advertisers and 1.6% for 10 omnichannel retailers, with total media budgets held constant. These are modeled opportunities, not measured sales increases after every recommendation was implemented. Realized results depend on execution and business conditions.

1. Allocate spend across campaigns and ad sets
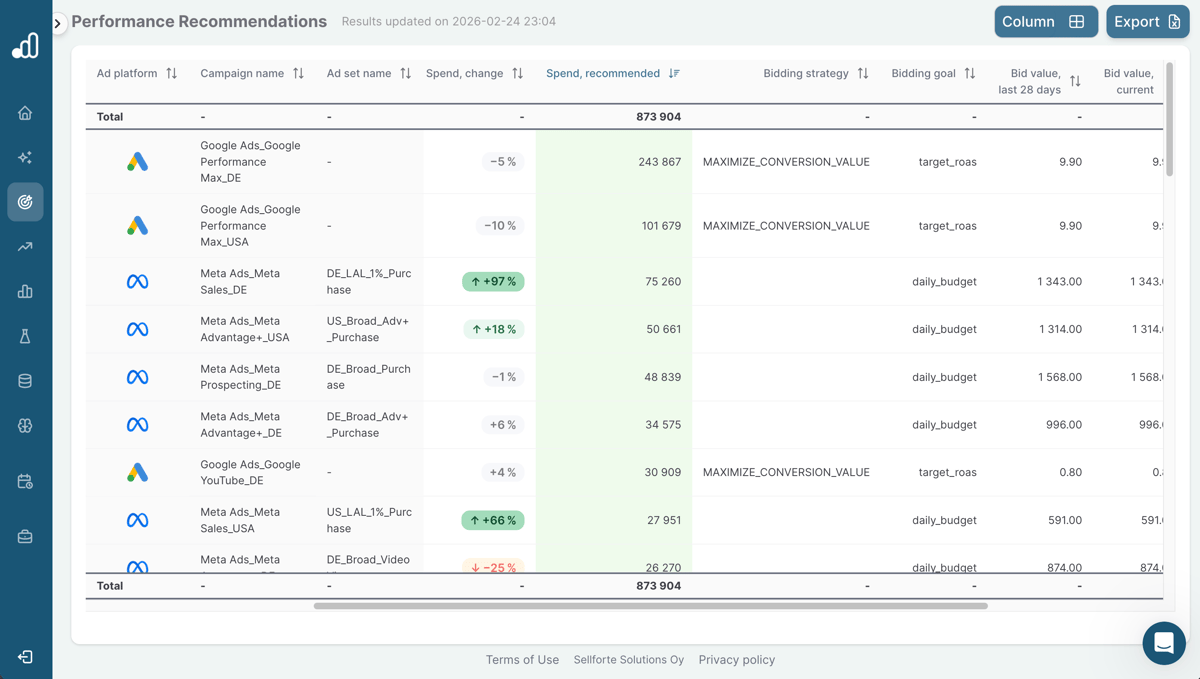
The ecommerce/DTC analysis identified 2.9% sales improvement potential from reallocating budgets across campaigns and ad sets. The level of detail available depends on the data and model. Sellforte Performance provides campaign and ad set spending and bidding recommendations, as illustrated below.
2. Allocate spend across channels
The same analysis identified 1.6% sales improvement potential from channel allocation. Here, channels include tactics within platforms, such as prospecting and retargeting on Meta or branded search and shopping on Google. The decision is where additional spend can generate the highest incremental return at the current spending level.

3. Adjust budget pacing throughout the year
Weekly pacing accounts for changes in demand and expected media effectiveness. The ecommerce/DTC analysis identified 2.0% sales improvement potential from changing when budgets were spent.

For an omnichannel retailer with $1.2 billion in annual revenue, the study's 1.6% estimate corresponds to $19.2 million in annual sales improvement potential. The retailer analysis covered channel allocation and pacing; the sample was insufficient to quantify campaign optimization.
Click-based measurement can also miss store sales. Our Meta Advantage+ example illustrates how including incremental ecommerce and store sales changes the assessment of performance.
See these outputs in a 30-minute sample model walkthrough.
What data do marketing mix models use?
The core modeling dataset combines the business outcome, media activity, and relevant sales drivers over time. Experiments and attribution data can provide additional calibration evidence; they are not prerequisites for every MMM.
1. Core time-series data
Sales data should use a consistent outcome definition, such as net revenue or completed orders, across the period being modeled. For an omnichannel retailer, include store and ecommerce sales where both are part of the business question. Sellforte can connect to sources such as Shopify or a data warehouse such as Snowflake.
Media data includes spend and relevant delivery measures for each activity, such as impressions for digital media or rating points for TV. Platform connectors can also retrieve attribution signals, which need to be distinguished from the core media inputs. Map campaigns consistently so a change of name or structure does not appear to be a change in effectiveness.
Other inputs can include owned media activity such as email and SMS, prices and promotions, stock availability, weather, and broader demand conditions. The model needs the drivers that are relevant to the business and available at a compatible frequency.
2. Attribution data for calibration
Attribution can provide additional information about media effectiveness. Its use in calibration requires an explicit treatment of bias, outcome definitions, and measurement windows. Sources used by advanced MMM platforms include
-
Google Analytics 4 (GA4) last-click or data-driven attribution
-
Multi-touch-attribution (MTA)
-
Ad platform attribution (ad platform pixels)
3. Experiment data for calibration and validation
Incrementality experiments estimate the effect of a defined advertising intervention. A business may have tests for some channels and no direct experimental evidence for others. Record the coverage and uncertainty when using those results.
Conversion lift studies include Meta Conversion Lift, Google Conversion Lift, and TikTok Conversion Lift Study. Eligible audiences are assigned to treatment and control groups, with the control group withheld from the advertising being tested. Comparing outcomes estimates the incremental effect of that advertising. The exact implementation and outcome measurement depend on the platform and study design.
Geo experiments compare groups of geographic areas where advertising is changed with control areas. For example, a test could use selected US states or Designated Market Areas. Check the spend intervention, comparability of the areas, timing, and uncertainty before applying the result to MMM. Sellforte includes capabilities for analyzing geo tests for validation and calibration.
Is my business ready for MMM?
Start with the decisions you want to improve. A model built for national channel allocation may need different data from one intended to guide campaign budgets in individual markets.
- History: provide enough consistent data to represent the business's seasonal and promotional cycles. The period required depends on the model, markets, and available variation. Ask the provider to assess your history and any gaps before setting an implementation timetable.
- Frequency and coverage: align sales and media data to compatible daily or weekly periods. Include the stores, ecommerce activity, and markets relevant to the decision, and document changes in tracking or sales definitions.
- Spend variation: the model needs information about how outcomes change when media activity changes. Channels that always move together, or campaigns with little history, can be difficult to estimate separately.
- Business context: supply relevant promotion and price changes, stock constraints, and other demand drivers. Agree who can explain unusual periods and check the model's interpretation.
- Supported granularity: request separate estimates only where the evidence supports them. Grouping sparse campaigns can be more defensible than reporting precise-looking numbers for each ad set.
- Ability to act: identify who will review recommendations, change budgets, and assess the outcome. The business case depends on the decisions you can implement as well as the size of your media budget.
Experiments strengthen the evidence where they are available. Missing tests can become part of a testing roadmap, with uncertainty kept visible in the meantime. See how to assess the ad spend needed for MMM and our MMM pilot guide for practical planning.
How to implement marketing mix modeling
An implementation typically covers connecting data, preparing and validating it, fitting and reviewing the model, and acting on the results.
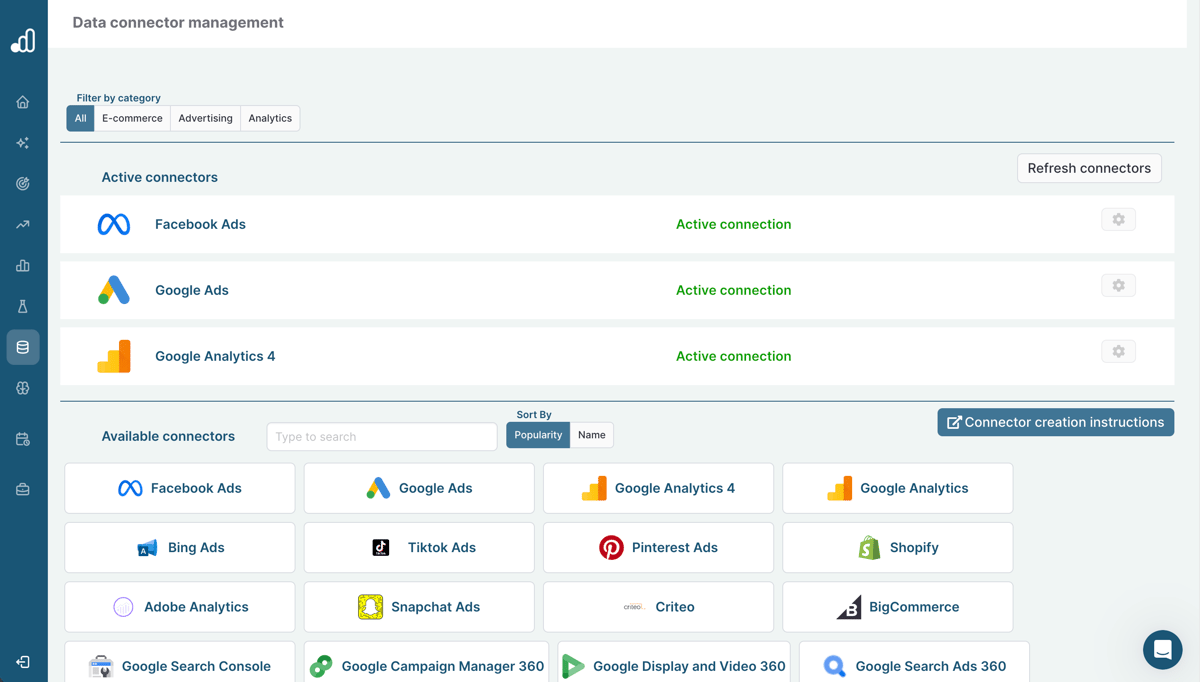
Step 1: Connect the data
Built-in connectors can automate data delivery. For a medium-sized ecommerce or DTC business using supported sources, connecting accounts can take 15 to 30 minutes. This is the connection step; it does not include all of the preparation, validation, and modeling work.
Step 2: Prepare and validate the data
Check sales coverage, currencies, date alignment, campaign mapping, missing periods, and the consistency of promotions and other business inputs. Platforms can automate many checks, while the customer may need to clarify unusual periods, supply missing data, or explain changes in the business.
Step 3: Fit, calibrate, and review the model
Prepare relevant calibration evidence, fit the model, and review the baseline, channel contributions, response curves, and uncertainty. Compare results with suitable experiments and assess how sensitive recommendations are to uncertain assumptions. A good sales fit is one check, not a complete validation of incremental effects.
Initial results can be available within one to two weeks in a straightforward ecommerce/DTC setup. The timetable depends on data readiness, scope, and the issues found during validation.
Step 4: Use the results and evaluate the changes
Translate the model's recommendations into feasible budget and bidding changes. Record the starting allocation, expected effect, constraints, and evaluation plan. Review results as new sales data and experimental evidence become available, using the pilot workflow to organize the first decisions.
How are AI agents influencing MMM?
AI Agents are today found in the most advanced MMM solutions. As an example, below are the agents Sellforte has announced:

Agentic MMM is driving a transformation in three distinct areas.
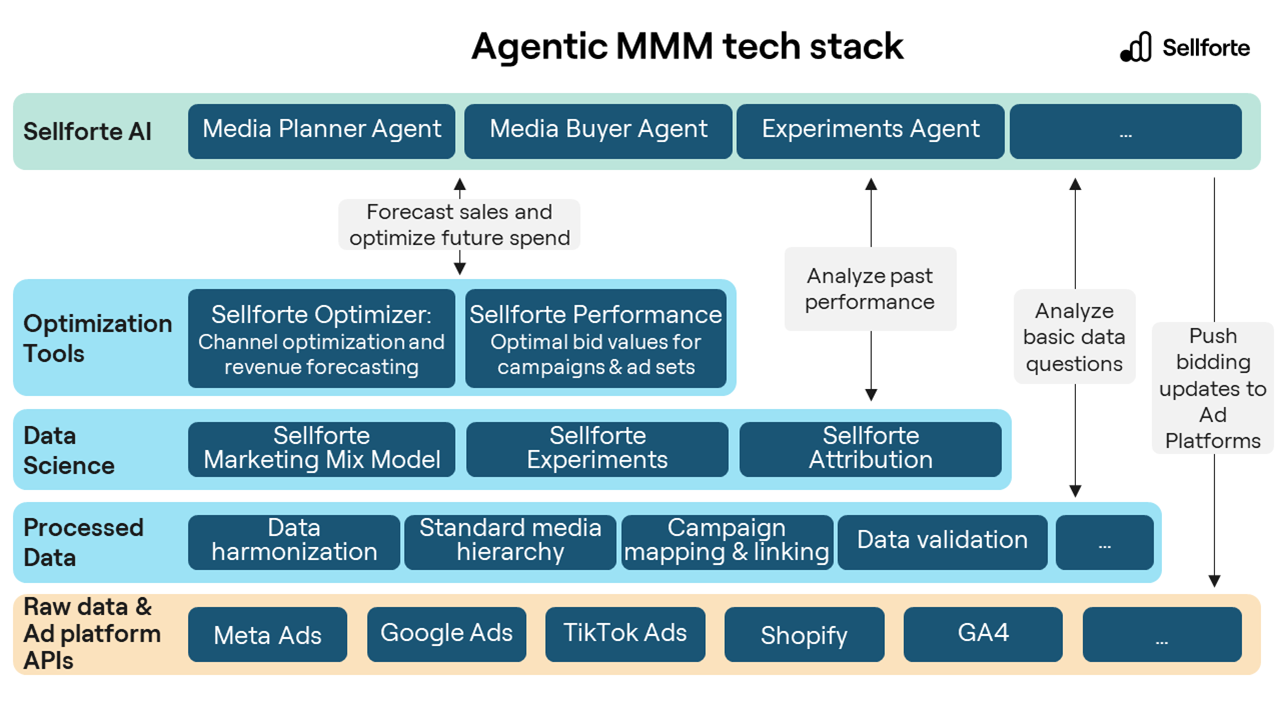
Agentic MMM adds a layer to the technology stack
Instead of replacing the analytical layers, AI agents are a new layer in the MMM technology stack. When conducting their tasks, AI Agents operate the analytical layers. As an example, when the Media Planner Agent needs to provide an optimal spend allocation across channels, it will interface with an optimizer tool. Below is an example of Sellforte's technology stack.
Agentic MMM changes how marketers interact with models
Agentic MMM brings a more natural interaction model via a chat interface. Marketers no longer need to learn complex dashboards. They can simply ask, "How should I allocate my budget next month to hit my revenue target?" As an example, below is a screenshot from Sellforte's AI interface with an active discussion on sales forecast.

Agentic MMM automates workflows
Beyond ease of use, AI Agents are increasing the tangible value marketers get from MMM by automating workflows. We are moving toward Media Buying Agents that can automatically buy media based on the specific objectives and constraints you provide.
This shifts the marketer's role from manual execution and spreadsheet tinkering to strategic oversight: setting the goals and letting the Agents handle the optimization.
How to choose an MMM tool or platform
Sellforte’s Buyers Guide to MMM Tools and Platforms provides a full in-depth explanation of what to look for when evaluating Marketing Mix Modeling tools or platforms. Below you'll find the summary with icon ✅ indicating a basic feature in most MMMs, and icon 💎 indicating features you typically find in the most advanced MMM platforms, Next Gen MMMs.
1. Choose a platform that helps you drive more sales
Your first objective is to ensure that the Marketing Mix Modeling solution has optimization capabilities that help you drive more sales. Here's a checklist from basic features to Next Gen features:
Basic features:
✅ Advertising channel-level optimization
Next Gen MMM features:
💎 Campaign-level optimization
💎 Optimal weekly budget pacing
2. Choose a platform that produces high-quality results
When you’re confident that the platform you’re evaluating has the right optimization capabilities, it’s time to check whether you can trust the Marketing Mix Modeling results enough to start acting based on the recommendations.
I’ll be honest with you: there are many Marketing Mix Models generating low quality, nonsensical, modeling results in the market. Why? Generating MMM results is easier than ever before, for example with open-source modeling libraries like Meridian and Robyn. Today, it can even be done by a non-technical person without knowledge of statistics or econometrics, just by following simple tutorials. At the same time, the challenge of building MMMs that produce high quality results has remained, because MMM datasets are noisy and can have strong multicollinearity effects that need to be managed, as Google Research pointed out already in 2017.
Luckily, there are a few things you can easily check from any MMM vendor, that make it likely that the MMM produces high quality results. Here's a checklist from basic features to Next Gen features:
Basic features:
✅ Statistical model validation
✅ Bayesian approach
Next Gen MMM features:
💎 MMM is calibrated with informative priors
💎 Systematic method for generating informative priors from experiments and attribution data
💎 Advanced model validation based on model outputs
3. Choose a platform that is easy to test and start with
Now that you're convinced that you have an MMM, which helps you with the right optimization decisions and produces high quality modeling results, you should evaluate the effort of getting started with the platform. This is a topic we at Sellforte are especially passionate about - making MMMs easy to use and start without compromising the quality of MMM results. Here's a checklist from basic features to Next Gen features:
Basic features:
✅ Data connectors
Next Gen MMM features:
💎 Delivers high quality results in 1-2 weeks
💎 Provides a Free Trial
4. Other considerations
Build or Buy. If you are in a position where you have the capabilities and financial muscle to invest millions of dollars to build a Marketing Mix Modeling platform described in this article, as well as patience to wait for its development, consider yourself lucky - you are in a unique situation! While building your own MMM platform gives you the ultimate freedom and flexibility, most companies decide to purchase a subscription to an MMM platform from a specialized vendor, after evaluating the cost and effort of building and operating an MMM platform themselves.
Consulting projects or SaaS. Since Sellforte was founded in 2017, we've witnessed a major transition from consultant-delivered MMM PowerPoints to modern SaaS tools. If you're still considering MMM consulting projects today, you should ensure you have a strong rationale and conviction about why your consulting partner can deliver superior service against modern MMM SaaS vendors.
Key takeaways
- MMM estimates how marketing and other business drivers contribute to sales. Reliable interpretation requires suitable data, explicit assumptions, and review of uncertainty.
- Use iROAS to assess historical incremental revenue per unit of spend and miROAS to inform the next budget decision. Use full response curves for larger changes.
- Sellforte's research identified 6.5% modeled sales improvement potential in a sample of 27 ecommerce/DTC advertisers at unchanged media budgets. It describes an optimization opportunity, with realized results dependent on implementation.
- Connecting supported accounts can be quick, while data preparation and validation determine the broader timetable. A pilot should connect model review with budget changes your team can evaluate.
To discuss how MMM could support your business, book a demo with Sellforte.
Further Reading & Resources on MMM
Explore guides, research papers, tools, and product resources to deepen your understanding of MMM.
Marketing Mix Modeling in Retail
Incrementality testing
Conversational AI for MMM & incrementality testing
MCP servers for MMM & incrementality testing
MMM Methodology
- Calibrating Marketing Mix Models with Experiments and Attribution data
- Advertising response curves: What are they and why do you need them?
- What is Causal Marketing Mix Modeling (MMM)?
- Understanding R2 in Marketing Mix Modeling: A Guide for Marketers
- MMM for Ecommerce: How Marketing Mix Modeling (MMM) Works for Online DTC Brands
- What does "Enterprise-Grade" Mean in Marketing Mix Modeling (MMM)?
- What is Incrementality Testing? Guide for Marketers
- Marginal Incremental ROAS (miROAS): What is it? And why does it matter to marketers?
- How Much Ad Spend Is Needed for Marketing Mix Modeling?
MMM, AI and Agents
Using MMM to Optimize Media Spend
- 11 Benefits of Marketing Mix Modeling (MMM) Every Marketer Should Know
- 6 Reasons eCommerce & DTC Brands Should Use Marketing Mix Modeling (MMM)
- The Shift in Marketing Mix Modeling: Why Campaign-Level Optimization is Taking Over
- The Five Requirements of Autonomous Media Buying and Optimization: M.A.G.I.C.
- Bid Optimization: How to Calculate the Optimal Bid Values for Your Campaigns Using miROAS
- ROAS, iROAS, miROAS: Choosing the Right KPI for Optimizing Media Spend
Original MMM Research by Sellforte Labs
- The 3 Danger Zones of Last-Click (And How to Avoid Them)
- How to measure Meta correctly? GA4 vs. MTA vs. MMM
- How to Measure the True Effectiveness of TikTok Ads?
- From Last-click to Marketing Mix Modeling (MMM): Unlock +6.5% more sales
- The Missing 24%: Why MMM Without Promotions Behaves Like Last-Click
Practical MMM Guides
MMM Tools for Ecommerce
MMM Tools and Vendor Comparisons
Explore Sellforte
Research Papers and Whitepapers
- Challenges And Opportunities In Media Mix Modeling (2017, Google - Chan et al.)
- Bayesian Methods for Media Mix Modeling with Carryover and Shape Effects (2017, Google - Jin et al.)
- Geo-level Bayesian Hierarchical Media Mix Modeling (2017, Google - Sun et al.)
- Hierarchical Bayesian Approach to Improve Media Mix Models Using Category Data (2017, Google, Wang et. al)
- Bayesian Time Varying Coefficient Model with Applications to Marketing Mix Modeling (2021, Uber - Ng et al.)
- Hierarchical Marketing Mix Models with Sign Constraints (2020, Cheng et al.)
- Bayesian Hierarchical Media Mix Model Incorporating Reach and Frequency Data (2023, Google - Zhang et al.)
- Media Mix Model Calibration With Bayesian Priors (2024, Zhang et al.)
About the author

Lauri Potka is the Chief Operating Officer at Sellforte, with over 15 years of experience in Marketing Mix Modeling, marketing measurement and media spend optimization. Before joining Sellforte, he worked as a management consultant at the Boston Consulting Group, advising some of the world’s largest advertisers on marketing optimization. Follow Lauri on LinkedIn.

11 Benefits of Marketing Mix Modeling (MMM) Every Marketer Should Know

How should we cut our marketing budget while protecting growth?