

Incrementality testing uses experiments to estimate the additional sales, conversions, or customers caused by a marketing activity. You compare what happened when you changed the marketing with an estimate of what would have happened without that change. The difference is the incremental impact.
If you cut retargeting spend, how much revenue would you lose? You can ask the same question about increasing prospecting spend or stopping a catalog mailing: how much business would change as a result?
The answer needs an uncertainty estimate and enough context to help you decide what to do. This guide covers choosing a test, calculating incremental return on ad spend (iROAS), and interpreting the results. It also explains how experiments work with attribution and Marketing Mix Modeling (MMM).
Why does incrementality testing matter?
Retargeting can report a high ROAS by reaching people who already intend to buy. Prospecting may create demand that later shows up as a branded search or a direct visit. Attribution assigns credit based on what it can track and the rules it uses. An experiment estimates how sales or other outcomes change when you change the marketing.
That can change your budget decision. The campaign with the highest attributed ROAS may generate less additional business than another campaign, giving you a reason to reconsider which budgets to protect, cut, or increase.
Tests can help answer questions such as:
- How much revenue would we lose if we stopped an existing marketing activity?
- Would a budget increase generate enough additional revenue to justify the spend?
- Does digital advertising increase store sales or purchases through other sales channels?
- Does a controlled experiment support an uncertain return estimate from our MMM?
- Do catalogs, email, or push notifications create additional purchases, or mainly reach customers who would buy anyway?
Be specific about the decision you need to make. A question such as “Can we increase Meta prospecting spend and still meet our required incremental return?” gives you more to work with than “Understand Meta better.”
How do you calculate incrementality? A worked example
In this hypothetical example, a retailer randomly assigns 100,000 eligible customers to an advertising treatment and another 100,000 to a holdout. It measures both groups over the same period using the same sales definition.
Swipe or scroll sideways to read the full table.
| Metric | Treatment | Control |
|---|---|---|
| Eligible customers | 100,000 | 100,000 |
| Purchases | 1,200 | 1,000 |
| Revenue | €120,000 | €100,000 |
| Spend on the tested advertising | €5,000 | €0 |
Because the groups are equally sized and randomly assigned, we can use the control group to estimate what would have happened without the tested advertising:
- Incremental purchases: 1,200 − 1,000 = 200.
- Relative conversion lift: 200 ÷ 1,000 × 100 = 20%.
- Incremental revenue: €120,000 − €100,000 = €20,000.
- iROAS: €20,000 ÷ €5,000 = 4.0.
- Incremental cost per action (iCPA): €5,000 ÷ 200 = €25 per additional purchase.
These are point estimates. The experiment also needs an uncertainty interval before the team can judge how precise the result is.
iROAS = estimated incremental revenue ÷ the corresponding difference in advertising spend.
The denominator depends on what you test. When you compare advertising with no advertising, use the relevant advertising spend. For a budget increase, use the extra spend relative to what would have been spent without the test. For a shutdown, report the revenue lost per euro of spend withheld and label the direction clearly.
Do not subtract raw totals when groups differ in size or baseline behavior. Unequal randomized groups require appropriate normalization; geo tests often require a modeled counterfactual.
How is iROAS different from attributed ROAS?
Suppose the ad platform credits the same €5,000 spend with €40,000 of revenue. Its attributed ROAS is 8.0. The experiment estimates iROAS at 4.0 because it measures additional revenue, whereas the platform assigns credit for observed purchases.
You can calculate an incrementality factor by dividing incremental revenue by attributed revenue: €20,000 ÷ €40,000 = 0.5. First, check that both numbers cover the same campaigns, population, revenue definition, and measurement window. The factor can help calibrate attribution for those conditions. Applying it to other campaigns or future periods requires further assumptions.
Does a positive iROAS mean the campaign is profitable?
A campaign can generate additional revenue and still lose money. Here, a 40% contribution margin before advertising would turn €20,000 of incremental revenue into €8,000 of contribution. Subtract the €5,000 advertising spend and you have €3,000 left, before any additional test or operating costs.
With that simplified cost structure, break-even revenue iROAS is 1 ÷ 40% = 2.5. Agree with finance on the relevant margin, returns, discounts, fulfillment costs, and customer-value horizon before setting a target.
What are the main types of incrementality tests?
The common options are geo tests, platform conversion lift studies, and audience holdouts for owned media. The labels overlap. A platform’s lift product, for example, may assign people or entire regions to groups. Check how each test builds its comparison.
1. Geo lift tests
Geo lift tests change marketing in selected regions and compare the resulting outcomes with a credible estimate of what would otherwise have happened there. You might pause paid social in some regions, increase video spend, or change catalog distribution.
Some designs allow you to assign regions randomly. Others select comparable markets and build a synthetic control: a combination of control regions that reproduces how the treatment regions behaved historically. To interpret the result as a causal effect, you need a sound design and a counterfactual that remains credible during the test.
Geo tests are useful when spend can be controlled regionally and consistent regional sales data is available. They can measure ecommerce and store outcomes without requiring every purchase to be matched to an ad exposure. Geographic leakage, regional promotions, and weak historical fit can undermine the comparison.
2. Platform conversion lift studies
A conversion lift study estimates the additional outcomes caused by advertising on a platform. In a randomized user-based study, the platform assigns eligible people to treatment or holdout groups and withholds the tested ads from the holdout. People assigned to treatment are eligible to receive the ads, though some may never see an impression.
Inspect the platform’s assignment method, conversion coverage, modeling, and reporting window. Avoid treating an ordinary comparison of people who saw ads with people who did not as equivalent to random assignment.
Availability depends on the platform, account, and campaign setup. A platform study’s results apply to the activity and outcomes included in that study.
3. Audience holdouts for email, catalogs, and other owned media
If you control who receives a message, you can randomly withhold it from some eligible customers and compare outcomes. For an email campaign, that means comparing recipients with a no-email holdout. The same approach works for catalogs and push notifications.
Measure purchases or customer value over the planned window, including purchases that happen through other routes. Counting only clicks or orders attributed to the message can miss substitution between channels.
A conventional A/B test comparing two subject lines answers which version performs better. It does not establish the incremental value of sending the email unless the comparison includes the relevant no-send or business-as-usual condition.
What about natural experiments and before-and-after comparisons?
An outage or an externally imposed budget change can give you an opportunity to measure an effect. You still need to account for other explanations: sales may have changed because of seasonality, promotions, competitors, or underlying demand. The timing of a spend change alone does not establish causation.
A credible natural experiment needs a defensible comparison and explicit assumptions about why the change is unrelated to other drivers of the outcome. Treat simple before-and-after reporting as descriptive unless that causal case can be established.
How do you choose the right incrementality test?
| Your question | Potential design | What must be true |
|---|---|---|
| Does advertising on one platform create additional conversions? | Platform conversion lift study | Eligible account and campaigns; suitable assignment and conversion measurement. |
| Does digital advertising increase total online and store sales? | Geo lift test | Regional media control and consistent sales data covering both sales channels. |
| Does a catalog or email create additional purchases? | Randomized audience holdout | Reliable audience assignment, suppression, and outcome tracking. |
| Will a higher budget deliver an acceptable return? | Spend-increase experiment | Enough separation in actual spend and enough data to detect the added outcome. |
| Is an MMM estimate credible? | An experiment matched to the model’s scope | Comparable channels, markets, periods, KPIs, and spending contrasts. |
Start where better evidence could change a substantial investment. A major budget cut or expansion may deserve a test before a small activity whose performance is already well understood. Check that a workable design is available before committing to it. Our guide to prioritizing tests across markets and channels explains how to weigh those choices.
How to run an incrementality test: seven steps
1. Define the decision and the intervention
Write down the change you will make and the decision the result should support. For example: “Increase prospecting spend in selected markets to find out whether the extra investment meets our agreed iROAS threshold.” Describe what happens in the comparison group just as precisely.
2. Choose one primary outcome
Select the KPI that matches the decision: net revenue, contribution margin, purchases, or new customers. Define how taxes, refunds, cancellations, and discounts are handled. A marketplace’s gross merchandise value and a brand’s own revenue are not interchangeable.
For omnichannel retail, decide whether the outcome includes stores, ecommerce, and marketplaces. For acquisition campaigns, allow for the delay between a lead or app install and a purchase. If you estimate future customer value, show those modeled assumptions separately and avoid counting the same revenue twice. Our Full iROAS guide explains how to account for value realized later.
3. Check data readiness and construct the comparison
Check that your spend and sales records use consistent dates and geographic or audience identifiers. Check historical coverage, missing values, tracking changes, and whether enough purchases can be assigned to the experimental units.
For geo designs, assess whether control markets reproduce treatment-market behavior before the test, and validate the model on historical periods not used for fitting. For audience experiments, check randomization, group balance, and suppression. Define how you will monitor contamination.
4. Estimate power, budget, and duration together
Statistical power is the probability of detecting an effect of a specified size under the planned design. The minimum detectable effect (MDE) describes the effect size the design is built to detect at the chosen power and statistical threshold.
Use historical data to compare different test sizes, spending changes, and durations. A design that can reliably detect only a 15% lift is unlikely to tell you whether a 3% lift occurred. If that smaller effect matters to your decision, revise the design before you launch.
There is no universal minimum budget or test length. Conversion volume, sales variability, effect size, market comparability, and conversion delay all matter. The GeoLift methodology walkthrough shows how prospective power analysis informs market selection, duration, investment, and MDE.
5. Agree on the analysis and decision rules
Document the primary KPI, treatment and control units, exclusions, analysis method, dates, uncertainty reporting, and decision threshold before viewing results. Include any post-test observation period needed to capture delayed effects.
Check the schedule for promotions and other experiments. If only the treatment markets receive a discount, you may be unable to separate its effect from the advertising effect. A promotion running across both groups raises a different question, since both groups are exposed to it.
6. Run the test and monitor implementation
Check that spend changes by the amount you intended. Watch for targeting leakage, broken tracking, stockouts, and unplanned changes in prices or other media. Keep a record of anything that departs from the plan.
Keep checking that the test is running as intended. Use the statistical stopping rules you agreed on beforehand. Repeatedly checking the result and stopping when it first looks favorable can distort the analysis.
7. Use the results and keep a record
Report the incremental outcomes and iROAS alongside the uncertainty and design diagnostics. Include actual spend and the estimated counterfactual spend where relevant, so readers can see how the return was calculated. Compare the result with your commercial threshold and record the action it supports.
Store the test conditions and results in a shared experiment library. Include the decision taken and when the evidence should be revisited. This makes past work usable for later experiments, attribution calibration, and MMM.
For more detail on regional experiments, see how to design a geo lift experiment.
How should you interpret incrementality test results?
An iROAS estimate of 4.0 is only part of the result. If its uncertainty interval includes negative effects, you have less reason to act than if the interval sits entirely above your business target. Read all three together: the estimate, its uncertainty, and the return you need.
A confidence interval describes uncertainty under a frequentist procedure; a Bayesian credible interval summarizes a posterior distribution conditional on the data and model assumptions. Check which your tool reports and at what level. Neither protects against a broken experiment design.
| Result | Interpretation and next step |
|---|---|
| Credible positive effect above the business threshold | The result supports the tested investment or spending change under those conditions. Before increasing spend again, consider the expected return on that next increase. |
| Positive effect, below the required return | The activity creates additional business but may fall short of the return you need. Review its cost, targeting, creative, or spend. |
| Wide interval covering both poor and attractive returns | The test is inconclusive for the decision. Examine precision and design before deciding whether another test is worth the cost. |
| Narrow interval near zero | The test may rule out a commercially meaningful effect within the measured scope and window. |
| Negative estimated effect | Check implementation and competing changes. If the evidence is credible, investigate whether the activity harmed the chosen outcome. |
When a report says “no statistically significant lift,” check the interval before concluding that marketing had no effect. The test may have had too little information to separate the effect from noise. The reverse problem also occurs: a statistically detectable effect can be too small to matter commercially.
When you share the results, describe the marketing change and the additional outcome you estimate it caused. Explain the uncertainty, whether the result meets the business threshold, and what you recommend doing next.
What are the limitations and common mistakes?
- A result applies to the market, audience, campaign mix, period, outcome, and spending change you tested. Using it in another setting requires judgment about how well those conditions match. It cannot establish a permanent return for a channel.
- An on/off test estimates the return over the tested spend range; a spend-increase test estimates the return on the extra spend. Neither gives you the full response curve or guarantees the same return on another budget increase.
- You can test campaigns and ad sets when you can isolate the change and get enough statistical power. Small campaigns often have too little signal to make a separate test worthwhile.
- Customers may cross regional boundaries or encounter the advertising through another route. They may also switch from paid search to organic search. Your outcome measure needs to capture these spillovers and substitutions if they affect the question you are testing.
- A short purchase window can miss later conversions or customer value. A longer observation period helps only if the design and analysis account for carryover and other changes during that time.
- Picking the best-looking region, KPI, or time window after seeing the results increases the risk of a false finding. Define your primary analyses in advance and account for multiple comparisons where needed.
- Testing has costs. A holdout may forgo profitable sales, while a spend-increase test requires extra investment. Both take staff time. Compare those costs with the value of getting the budget decision right.
You can run experiments repeatedly to keep learning. Each one measures a particular intervention, so the program will still have gaps if you need continuous measurement across the entire marketing mix.
How do incrementality testing, MMM, and attribution work together?
Standalone testing can answer a specific question. When you need ongoing reporting or budget planning across channels, you can use the findings alongside MMM and attribution.
| Method | Main job | What to watch |
|---|---|---|
| Incrementality testing | Estimate the causal effect of a defined intervention. | Design validity, precision, cost, and relevance beyond the test. |
| Marketing Mix Modeling | Estimate contributions across marketing and other business drivers; support budget scenarios and response curves. | Data quality, causal assumptions, model specification, and calibration evidence. |
| Attribution and incremental attribution | Provide granular operational reporting; use causal evidence to calibrate attributed performance where supported. | Tracking coverage and the assumptions used to transfer causal estimates to campaigns and ad sets. |
Test an investment you are uncertain about, then use the evidence in your ongoing measurement. The questions that remain when you make the next budget decision can help you choose what to test next.
Validation and calibration are different
Validation means comparing a model’s estimate with independent experimental evidence under comparable conditions. Calibration means using that evidence to inform the model, for example through Bayesian priors. Once you have used a test for calibration, you cannot also count it as independent validation of the same model.
Before comparing results, align the channel and campaign scope, geography, dates, outcome definition, conversion lag, and spend contrast. A national annual MMM return and a short regional spend-increase test can legitimately answer different questions.
If you have several tests, weigh their precision, design quality, age, and relevance. The model does not need to reproduce every point estimate, and a valid result deserves consideration even if it is inconvenient. Google’s Meridian calibration guidance explains that translating experiments into MMM priors adds uncertainty.
For implementation detail, read how Sellforte calibrates MMM with experiments and attribution data and our guide to weighting multiple incrementality tests.
From iROAS to the next budget decision
Average iROAS describes the return over the measured investment. Marginal incremental ROAS (miROAS) concerns the return from an additional unit of spend at the current level.
A spend-increase experiment gives you evidence about the return over that particular increase. A model with credible response curves can help estimate returns across a wider range of budgets. In either case, allow for uncertainty and the limits your business places on budget changes.
Example: BrandAlley used a lift test to validate MMM
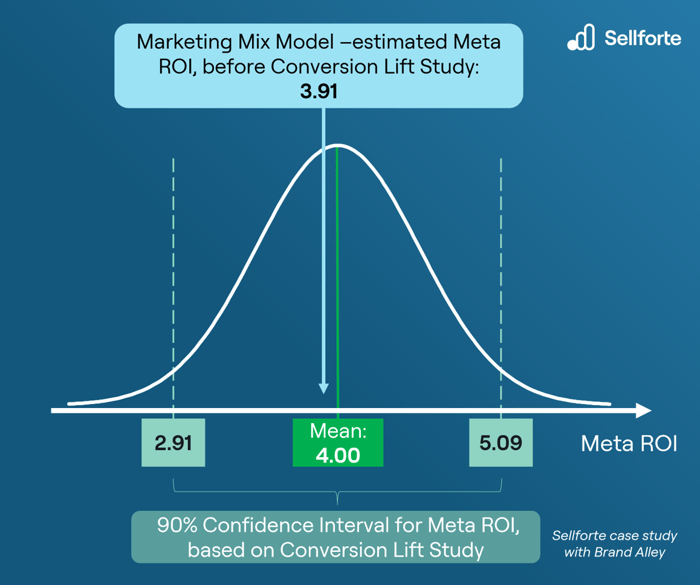
BrandAlley used a four-week Meta Conversion Lift study covering its Meta campaigns to compare experimental results with Sellforte’s MMM estimate. The reported study ROI was 4.00, with a 90% confidence interval of 2.91 to 5.09. The MMM estimate was 3.91.
The MMM estimate fell within the study’s uncertainty interval, supporting the Meta measurement for the tested conditions. The comparison could not validate other channels or establish what future returns would be.
Read the BrandAlley case study for the broader measurement approach.
How to get started with incrementality testing
Choose a channel or activity where a test result could change how much you invest. Before committing to the test, check that it can give you a sufficiently precise answer and agree on how you will use the result.
Ask a testing vendor how it calculates the counterfactual and spend, reports uncertainty, and checks whether a result is reliable. Check which KPIs it supports and how it handles delayed effects. You may also need a place to keep geo tests, platform lift studies, and audience experiments together, or help designing tests as well as analyzing them. Our 31-criterion incrementality testing tool guide covers these questions in detail.
In Sellforte Experiments, you can review geo lift, conversion lift, and A/B tests in one place. Reports include incremental outcomes, iROAS, uncertainty estimates, and diagnostics, with charts and AI-generated summaries to help explain the results.
Sellforte offers Incrementality Testing as a standalone package. Incremental Attribution adds ongoing paid-media measurement. Full-Funnel MMM covers broader questions about promotions, brand marketing, offline channels, and other business drivers. Read about Sellforte’s Incrementality Testing and Incremental Attribution packages to see where each fits.
You can book a demo to discuss a test you have in mind, or explore the product tour.
Frequently asked questions about incrementality testing
What is the difference between incrementality and attribution?
Attribution assigns credit for observed conversions using defined rules or models. Incrementality estimates how many additional outcomes marketing caused compared with a counterfactual. Attribution can be calibrated using causal evidence, but attributed ROAS alone does not establish incrementality.
Is incrementality testing the same as A/B testing?
An A/B design can measure incrementality when its comparison matches the causal question, such as email versus no email. Testing two active ads or landing pages measures their relative performance; it does not automatically measure the value of advertising versus no advertising.
How long should an incrementality test run?
The test needs enough time to detect an effect that matters to the business and capture the relevant conversion delay. Use power analysis and your business cycle to set the duration. Specify both the period when marketing changes and any additional observation window.
How much budget do you need?
There is no universal minimum. Required investment depends on outcome volume and variability, expected effect size, treatment contrast, and design quality. Check feasibility using your own data, and include analysis fees, staff time, and the opportunity cost of withholding marketing.
Can you test individual campaigns or ad sets?
Yes, if you can isolate the intervention and obtain adequate statistical power. Smaller budgets and overlapping audiences can make this difficult. A channel-level result also does not automatically identify each campaign’s causal contribution.
Can incrementality testing measure offline sales?
Yes. Geo experiments can use store sales or other regional business outcomes when those outcomes are measured consistently and the intervention can be separated across regions. Choose geographic units that account for customer travel and advertising spillovers.
Do you need MMM before running a test?
No. Standalone experiments can answer specific causal questions. MMM becomes useful when you need a broader view of marketing and other sales drivers, budget scenarios, and a framework for combining evidence from multiple tests.
How often should you repeat an incrementality test?
Repeat a test when the decision changes or the old result becomes less relevant. A major change in spend, audience, creative, market conditions, or product mix may justify a new test. Base the timing on what you need to learn rather than a fixed calendar.
Further reading: Asked by Marketers
For more detail on test design, interpreting results, and using the evidence in budget decisions, explore these questions from Sellforte’s Asked by Marketers series.
Planning and designing a test
- How should we prioritize incrementality tests across markets and channels?
- What is the right holdout-group size for an incrementality test?
- Should we run a full marketing blackout or a partial holdout test?
- When is a market or channel too small to justify an incrementality test?
- How can you turn a mandatory budget cut into an incrementality testing opportunity?
Interpreting results and measuring sales
- Why do platform ROAS and incremental ROAS tell such different stories?
- Can you trust Meta Conversion Lift tests for MMM calibration?
- Why can a calibrated MMM show a different incremental ROAS than a conversion-lift study?
- Can MMM and Incrementality testing measure the full sales impact of mid-funnel and top-of-funnel campaigns?
- How can MMM measure the impact of digital advertising on offline store sales?
- What does it mean when MMM says media drives only a small share of total sales?
Using tests to calibrate MMM
- How should geo-lift and conversion-lift studies be combined when calibrating MMM?
- How should we weight multiple incrementality tests when calibrating an MMM?
- Should MMM calibration separate traffic, engagement, awareness, and sales campaigns?
- Can we use incrementality evidence from one country to calibrate an MMM in another?
Making measurement and budget decisions
- When should an omnichannel retailer use MMM, MTA, or incrementality testing?
- Is attribution enough on its own? Why MMM and incrementality testing are required
- What changes when an ecommerce or retail company adopts incrementality?
- How should we cut our marketing budget while protecting growth?
- Can MMM help us set a budget for a channel we've never used?
About the author

Lauri Potka is the Chief Operating Officer at Sellforte. He has over 15 years of experience in Marketing Mix Modeling, marketing measurement, and media spend optimization. Before joining Sellforte, he worked as a management consultant at the Boston Consulting Group, advising some of the world’s largest advertisers on how to use data to optimize marketing. Follow Lauri on LinkedIn.

Can you trust Meta Conversion Lift tests for MMM calibration?

What is the right holdout-group size for an incrementality test?