Marketing Mix Modeling (MMM) is becoming the go-to solution for eCommerce & DTC brands looking to understand what truly drives their sales. But most models are still missing a crucial piece of the puzzle: Promotions.
According to new Sellforte Labs research, promotions are driving an average of 24% out of total revenue for eCommerce and DTC brands. Yet many MMM frameworks exclude promotions, discounts and other temporary price reductions entirely. This omission doesn’t just leave a gap, it creates systematic errors that makes your MMM behave like Last-Click attribution, favoring Bottom-of-Funnel channels and making branding and awareness campaigns look weak in comparison.
In this article, we share Sellforte’s original research on how promotions influence media performance and why including them in measurement is essential for accuracy and scale.
.png?width=771&height=436&name=Promo%20blog%20(1).png)
You’ll learn:
- How much revenue promotions actually drive for eCommerce and DTC brands
- What happens when promotions are excluded from MMM
- The key benefits of integrating promotions into your media measurement
- Why most MMM vendors fail to account for promotions
- How promotions appear in advanced measurement and optimization tools
Let’s unpack the data behind the missing 24% and explore how measuring it can give you a truer picture of marketing effectiveness.
Understanding Promotions as a Revenue Driver in eCommerce and DTC
To understand how promotions influence revenue, we analyzed a sample of 15 eCommerce and DTC brands who are using Marketing Mix Modeling to measure and optimize media spend.
The sample consists of high-growth brands with an average annual revenue of $70M coming from various eCommerce sectors, such as fashion, apparel, beauty, travel, outdoor, and home/design.
What Portion of eCommerce and DTC revenue is Typically Driven by Promotions?
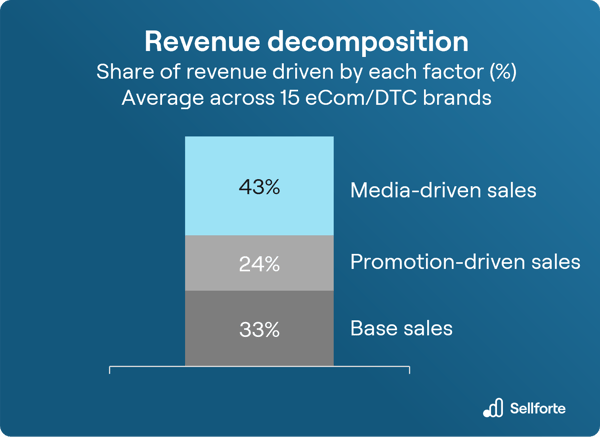
We first analyzed how much revenue promotions are driving, and how does that compare to media-driven revenue. We found out that the average revenue decomposition for the brands in the sample is as follows:
- 24% of revenue is driven by promotions.
- 43% of revenue is driven by media.
- 33% of revenue is base sales, i.e. revenue the business would get without media or promotions.
The findings of the analysis are also summarized in the revenue decomposition chart below:
While the average promotion-driven revenue in the sample was 24% out of the total revenue, there was large variance across the analyzed companies. For the most promotion-intensive businesses in the sample, promotions were driving almost half of the revenue, around 45%, which made them a bigger revenue-driver than media. On the other end of the spectrum, there were brands who were less reliant on promotions, with lowest promotion-driven sales at 8%.
Let's next talk about the relationship between media and promotions.
💡Takeaway: Promotions can be a major driver of revenue. If you are an eCommerce or DTC brand, excluding promotional activity from media measurement distorts ROIs and spend change recommendations.
How Are Media Activities Connected to Promotions?
When brands activate promotions, they use media to communicate them to consumers. This leads to high correlation between media activity and promotional activity. But how big is the correlation? And is it all media or just a part of them?
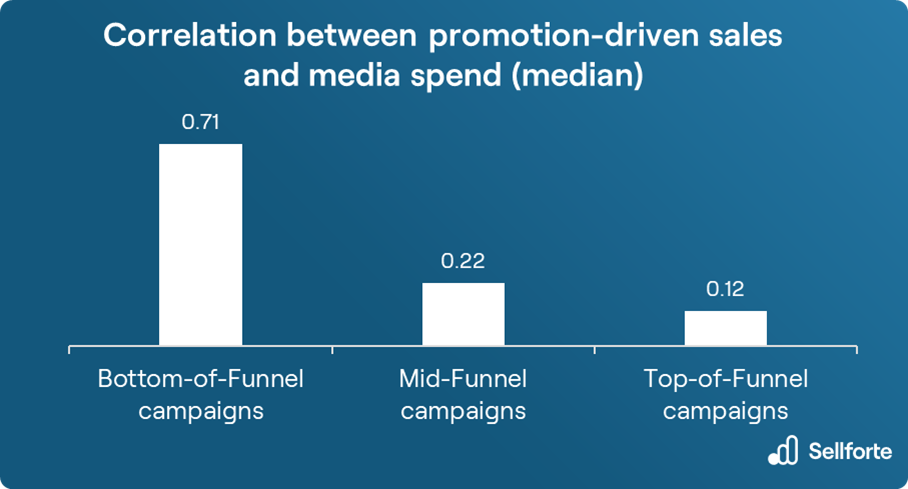
Among the analyzed companies, correlation between promotion-driven revenue and media spend was by far the highest for bottom-of-funnel campaigns, at 0.71 (median). First quartile was 0.59, third quartile was 0.77.
Correlation was much lower for mid-funnel and top-of-funnel campaigns, with medians at 0.22 and 0.12 respectively. This is also summarized in the chart below:
What's included in the funnel definitions in the standard Sellforte hierarchy:
- Bottom-of-funnel: Campaigns having conversions or revenue as their target KPI. Typically covers for example tons of branded search, Performance Max, retargeting, and Advantage+ campaigns.
- Mid-Funnel: Mostly campaigns with clicks as target KPI, for example Meta Traffic.
- Top-of-funnel: Campaigns targeting impressions, reach and views. Covers often Meta awareness, Paid video campaigns and so on.
The finding that promotions have such a high correlation with bottom-of-funnel campaigns makes intuitive sense: if your creative and messaging focuses on communicating a promotion, it's logical to ask the ad platform algorithms to optimize delivery to consumers which are most likely to convert.
💡Takeaway: High correlation between promotions and media spend implies that accurate estimation of media ROI and revenue impact of promotions requires advanced modeling capabilities and intimate understanding of promotion mechanics.
When Promotions are Excluded, MMM Starts Behaving Like Last-Click Attribution
We have now established that promotions can be a major revenue driver for eCommerce and DTC businesses, and that promotional activity is correlated with bottom-of-funnel media spend.
But what does this mean for your MMM outputs, i.e. media ROIs and spend allocation optimization? What happens if you exclude promotions from your Marketing Mix Model? In short, it starts behaving like Last-Click attribution:
⚠️ Inflated ROIs for Bottom-of-Funnel Channels. When promotions are missing from your media measurement there's a high likelihood that large share of promotions' revenue impact is allocated to bottom-of-funnel channels, because they are highly correlated with promotional activity. This leads to unrealistically high ROIs for bottom-of-funnel channels.
⚠️ Weak ROIs for Branding and Awareness channels. When your bottom-of-funnel campaigns have inflated ROIs, your brand-building and awareness campaigns, e.g. Meta Awareness campaigns, start to look weak in comparison.
⚠️ MMM Suggests Re-allocating Spend to Bottom-of-Funnel Channels. Because tactical performance channels appears to be performing so well, the model thinks you can scale them even further. When you ask for spend re-allocation recommendations, it is likely to recommend moving budgets from branding and awareness campaigns to tactical performance campaigns.
⚠️ MMM Suggests Re-allocating Spend to BFCM / Peak and Other Promotional Events. When promotions are excluded, your model might think that the revenue driven by promotions during seasonal promo events was actually driven by media. In such cases, you will have unrealistically high media ROIs during Black Friday, Cyber Monday and other similar events. When you ask the model to optimize budget pacing throughout the year, it will suggest re-allocating spend from other parts of the year to such events.
💡Takeaway: If you don't want your MMM to have the same biases than last-click attribution (overestimating ROIs of bottom-of-funnel channels), make sure your Marketing Mix Model includes promotions.
What are the Benefits of Including Promotions in Media measurement?
If you're leveraging promotions to drive revenue in your business, integrating promotions into your Marketing Mix Model has four advantages.
✅ Accurate ROIs for all channels. When revenue impact of promotions is properly quantified and separated for media, your measurement model is better positioned to understand how media is driving your revenue, and calculate accurate ROIs for each channel.
✅ Drive more revenue by getting better spend allocation recommendations. When your measurement model understands accurately how each channel is driving your revenue, it is able to to give better spend allocation recommendations that help you accelerate growth.
✅ Drive more revenue by getting better budget pacing recommendations. When your measurement model understand how promotions drive revenue during promotional events, it will have more accurate understanding of the impact of media during those events. This enables more accurate budget pacing recommendations throughout the year that help you drive growth.
✅ Optimize promotions themselves. Promotion optimization might not be in marketers' job descriptions. But if your measurement model gives insights on promotions' revenue impact, it opens up the door for better optimization of promotions themselves. Larger eCom/DTC businesses might have dedicated promotion optimization tools in place for this, but for small and medium-sized eCom and DTC brands this might an avenue to explore.
Why are most Marketing Mix Modeling Vendors Excluding Promotions?
If excluding promotions from media measurement has such severe ramifications, why are most Marketing Mix Modeling vendors falling into this trap? Here are five reasons why.
1. Promotions are challenging to model properly. How to address multicollinearity? What data should be used for constructing promotion features in the model? How to model non-direct effects, such as halo effect? How to model interactions between media and promotions? Most MMM providers are not capable of handling this complexity, and open-source tools like Meridian don't provide off-the-shelf support for this. Modeling promotions is especially challenging for MTA vendors who have only recently started implementing light MMM on top of their solution.
2. No access to promotion data. Another reason is data availability. Simpler MMMs might not have a data connection to an eCommerce platform at all, if they use sales data from Google Analytics 4. At the same time, bigger eCommerce and DTC companies might have promotion data as part of their receipt-level revenue data sitting in a data warehouse or in a promotion planning tool, and connecting to that requires data integration expertise and tools. Enterprise-grade solutions, such as Sellforte, can handle this, but it can be challenging for simpler MMMs.
3. Prioritizing fast onboarding over results quality. Including promotions can require extra data collection work, extra data preparation work, extra modeling work, and extra validation work. That slows down MMM vendors who don't have experience in promotion modeling. Rather than spending a few additional days on onboarding, some vendors choose to exclude promotions altogether.
4. Underestimating how impactful promotions are. Marketing Mix Modeling vendors without experience from promotions might not know how impactful promotions are in influencing revenue.
5. Not requested by the customers. Marketing teams are typically the buyers of marketing measurement solutions, and promotions could be managed in a different team. If the marketing team is not used to analyzing promotions, they might not realize how important they can be in media measurement. We hope this article helps marketers understand how important promotions are to media measurement.
What do Promotions Look Like in Marketing Mix Modeling Tools?
Ok, you get it, promotions are important. Let's move on. Next, you are probably interested to understand what promotions actually look like in your media measurement platform. Let's take a look!
Promotions In the Revenue Decomposition Chart
Promotions are always shown in the most classic Marketing Mix Modeling output: revenue decomposition chart. Revenue decomposition chart helps you see exactly how much of your total sales uplift came from promotions , compared media and base sales.
Below is an example of a revenue decomposition chart, taken from the public Sellforte demo. Promotions is the highlight light gray color on the chart.
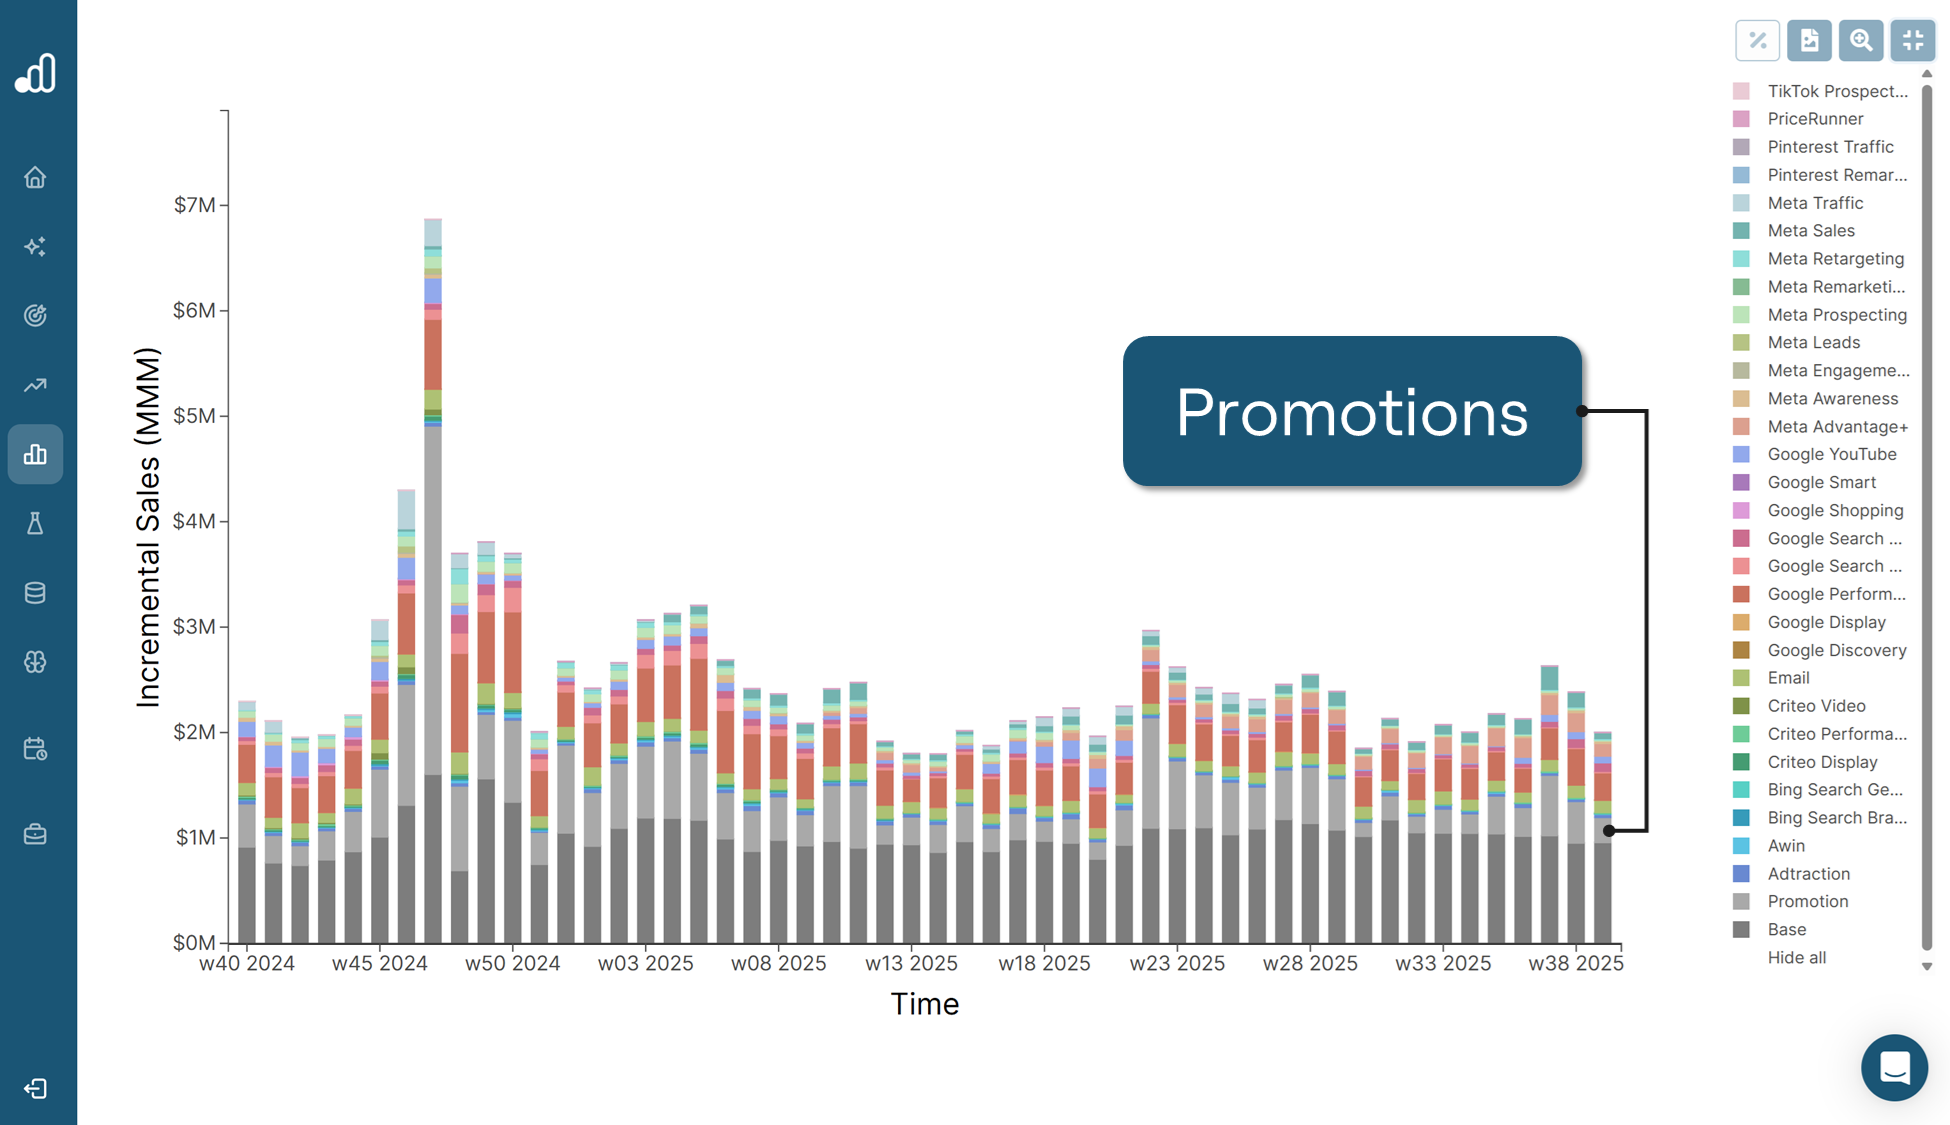
For instance, you might notice that during key campaign periods, such as Black Friday, promotion-driven revenue forms a large part of the total uplift. You can see this in the demo data above, around weeks 46-47.
Promotions In the Budget Optimization Tool
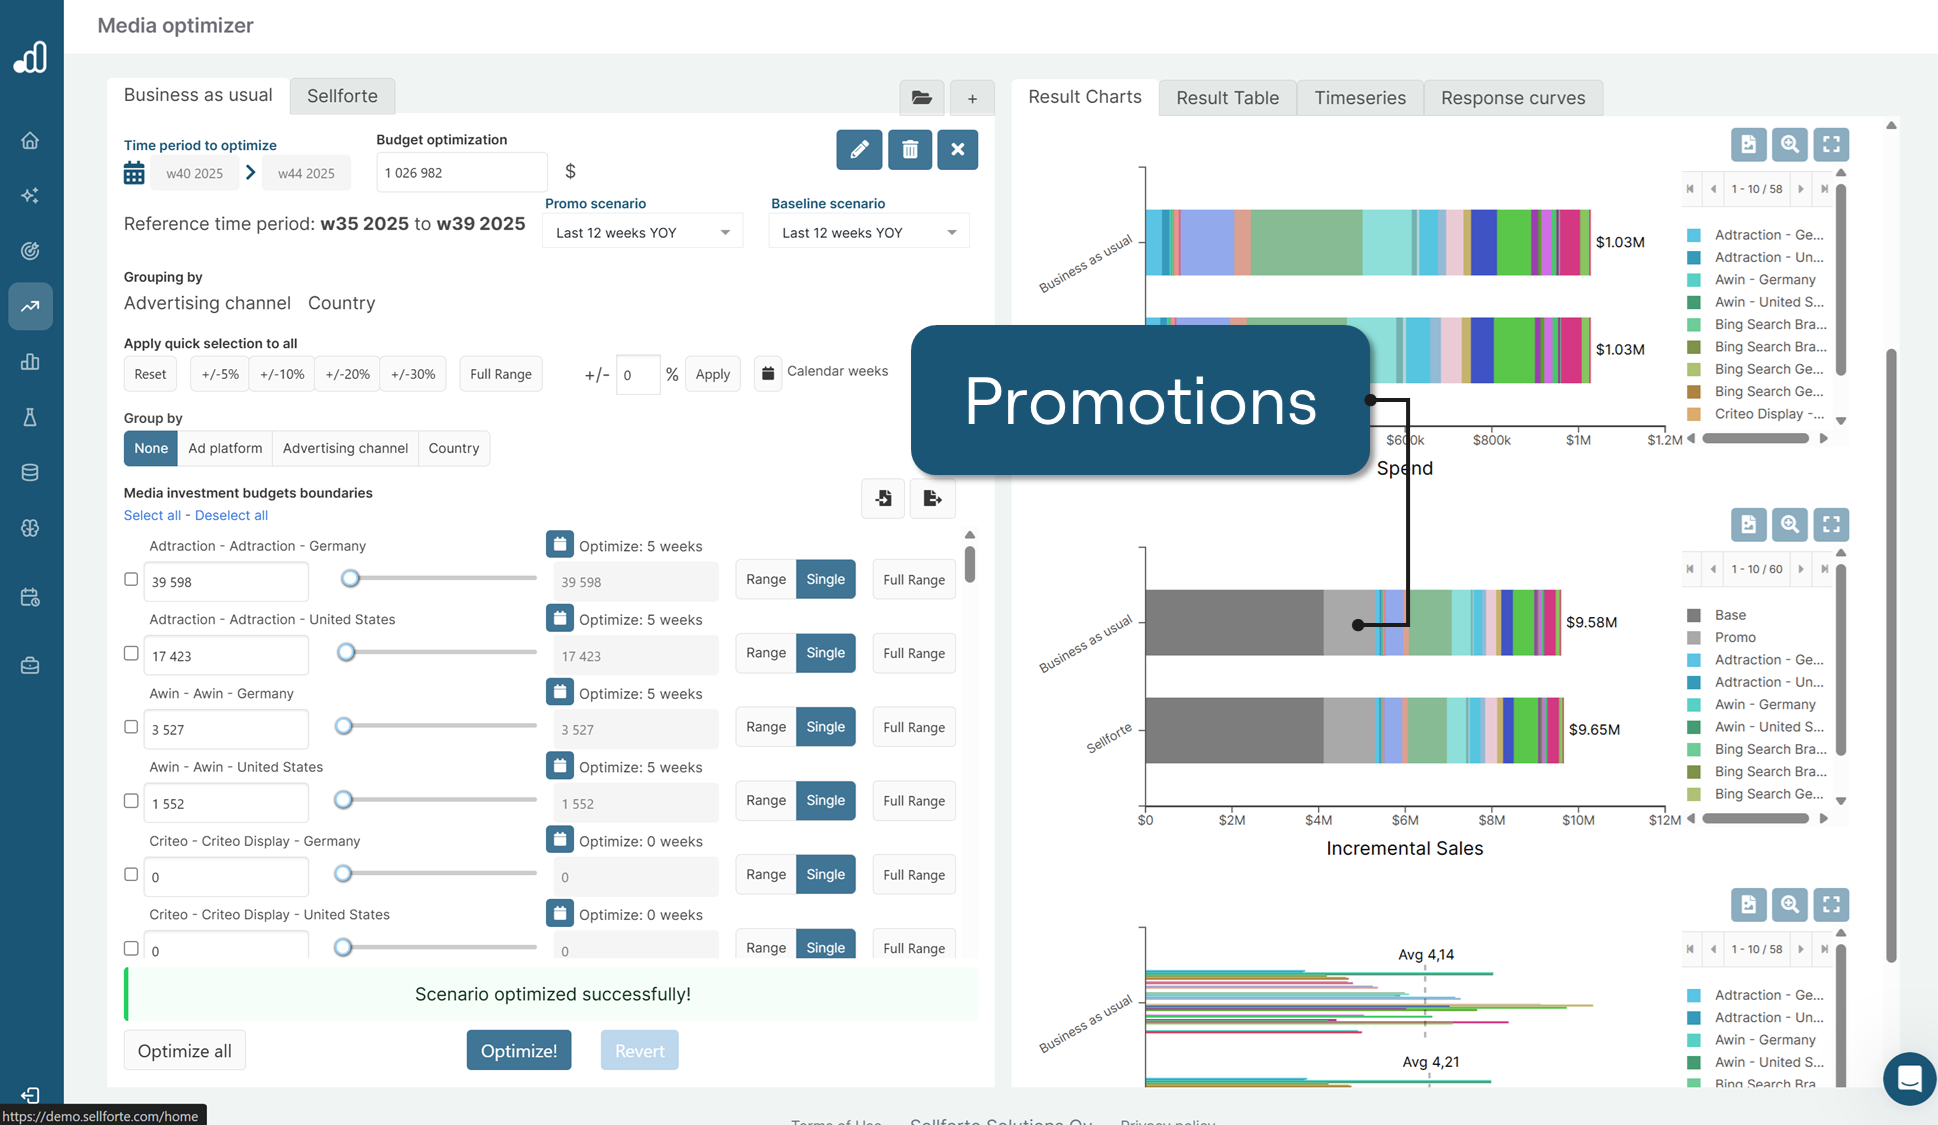
When promotions are included in the model, they also become part of the optimization engine. This means that you can simulate scenarios that combine both media and promotions. For example, you can explore the how your total sales forecast for next year develops in specific media budget allocation and promotional activity scenarios.
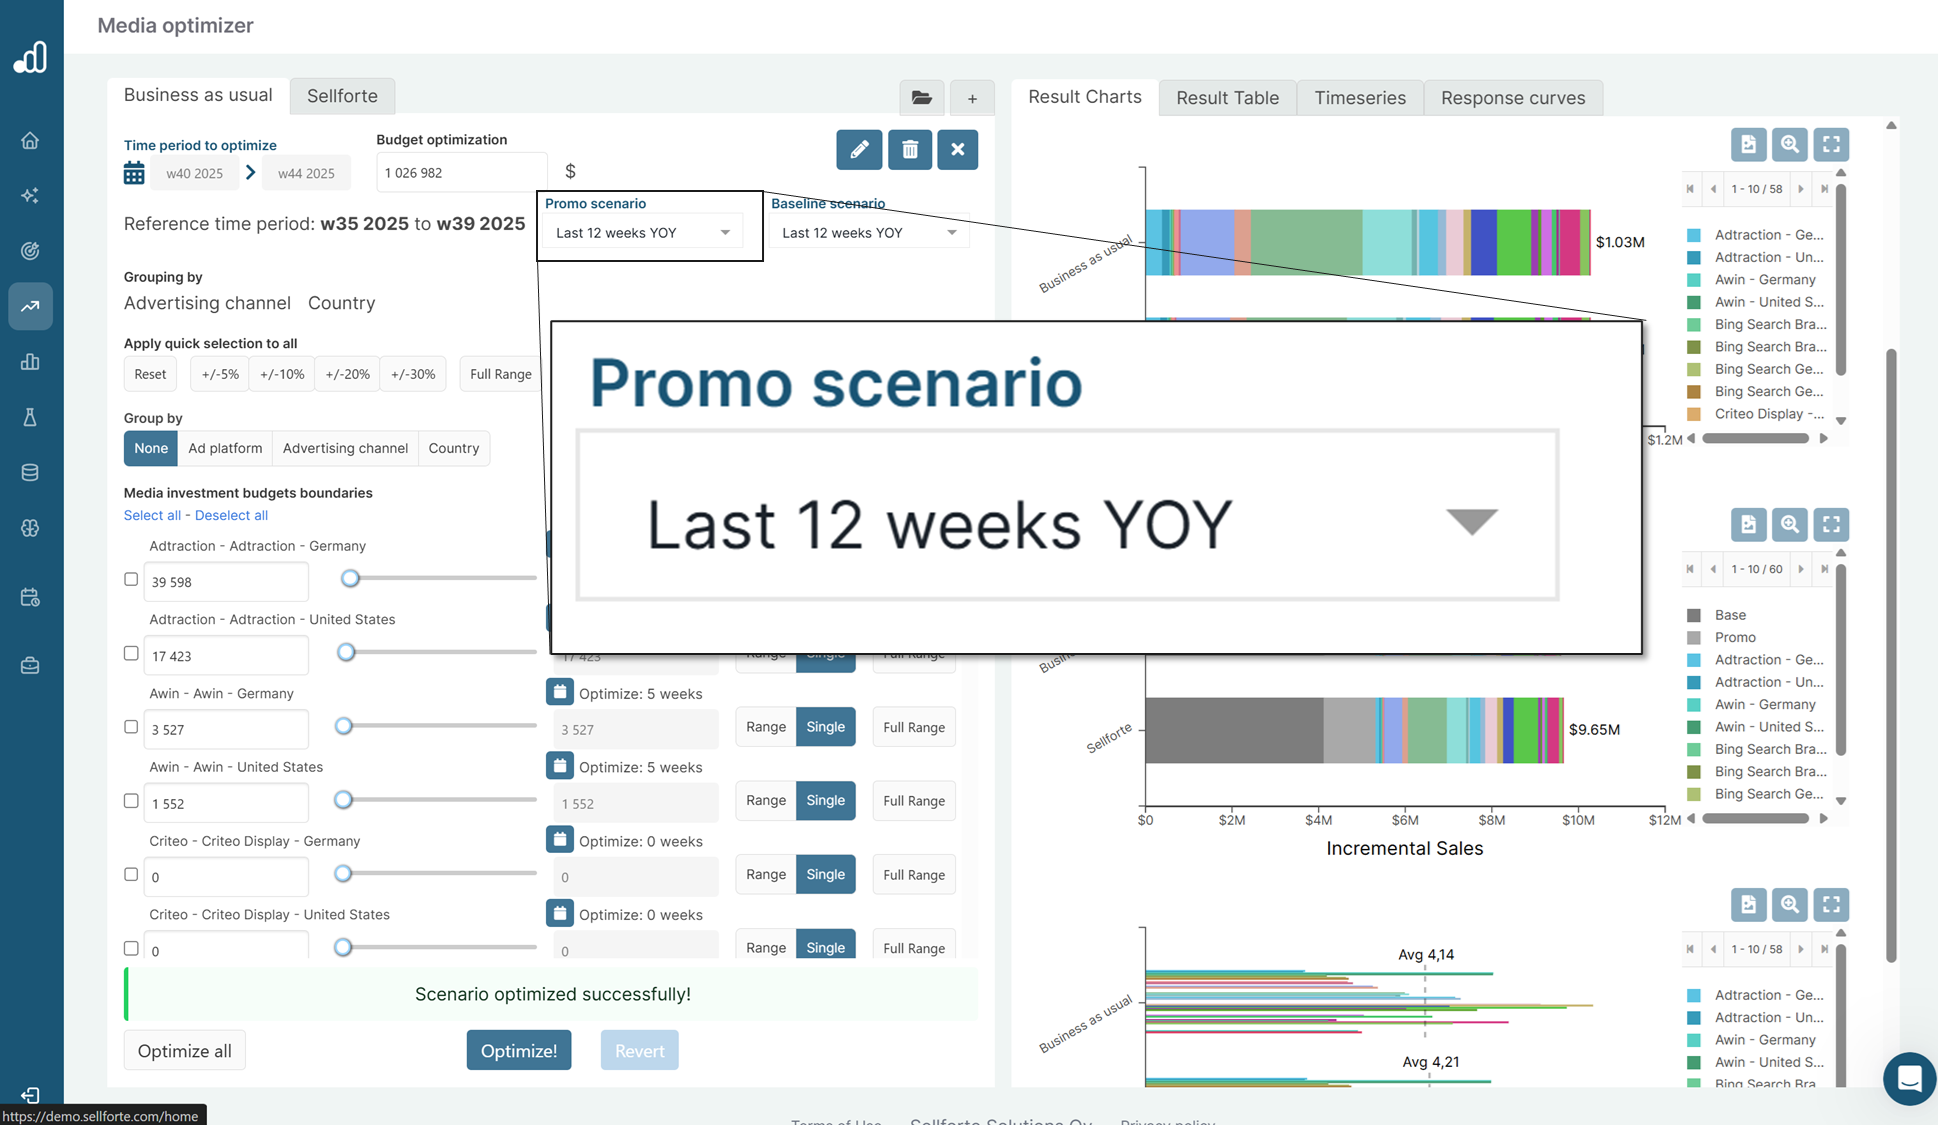
Below is an example screenshot from the Sellforte Optimizer (taken from the public Sellforte demo) that highlights promotion-driven revenue in the total revenue forecast.
Below is another example screenshot from the Sellforte Optimizer (taken from the public Sellforte demo) that highlights that ability to define different promotion scenarios as an input for the Optimizer.
Bonus: What Explains the Large Differences in Promotion-intensity Across Segments?
While the decision to do promotions is deeply tied to the commercial strategy of a brand, some segments tend to be more promotion-intensive than others. Based on our experience, promotion-intensity is primarily driven by how profitable the promotional activity is. If promotions are not profitable, it's less likely for companies to use them to drive revenue.
Profitability of promotions is determined by several aspects, but there are two primary factors that stand out:
- Base margin (before discounts): High margin segments can absorb larger promotions without becoming unprofitable, compared to low margin segments.
- Price elasticity of demand: Segments with high price elasticity have a larger chance to influence consumer purchase behavior with promotions compared to segments with low price elasticity.
The conceptual chart below illustrates these two factors on a chart, and shows example segments and product categories.
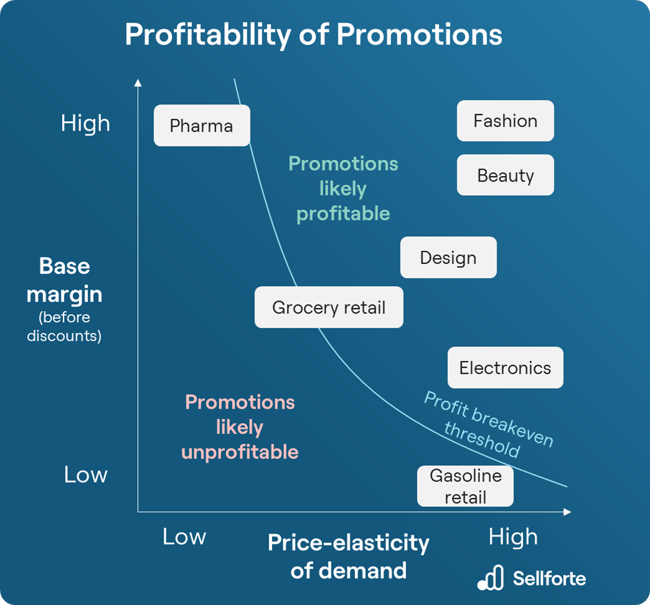
Most promotion-intensive businesses can be found in segments with high margins and high price elasticity of demand. These segments include for example fashion and beauty eCommerce. You can capture a lot of impulse buyers by having a relevant and well-timed promotion.
Companies selling electronics typically have much lower margins but they still use promotions because they can drive more volume with promotions, and thus keep the promotional activity profitable.
Pharma, i.e. companies selling medicine, have high margins, but they have limited ability to influence consumers' need for medicine with promotions, which is why promotions are less common in that segment.
In Gasoline retail, you can influence consumers' buying volume in the short-term, but the margins are so slim that promotions would be costly.
Conclusions: How to Capture the Missing 24%
For most eCommerce and DTC brands, the missing 24% represents a major blind spot in marketing measurement. Promotions are not a minor detail; they are a key revenue driver that deserves the same analytical rigor as media.
When promotions are excluded, measurement results become distorted and your MMM starts acting like Last-Click: Bottom-of-funnel ROIs look inflated, brand-building channels appear weak, and spend recommendations skew toward the wrong areas.
By contrast, brands that include promotions in their Marketing Mix Modeling uncover the full story behind their growth. They gain more accurate insights, smarter budget allocation, and a deeper understanding of how media and promotions work together to drive revenue.
If you are ready to close the gap and account for the missing 24%, it is time to include promotions in your media measurement.
Book a demo with Sellforte to see how our platform helps eCommerce and DTC brands measure every driver of growth.
Frequently Asked Questions
What are Promotions?
Promotions are short-term marketing activities designed to stimulate immediate sales or demand, typically by creating urgency, offering additional value, or lowering the effective price of a product or service.
In practice, “promotions” can include a wide variety of tactics such as discount campaigns (e.g., 20% off sales), buy-one-get-one (BOGO) offers, flash sales, coupon codes, bundle deals, loyalty point multipliers, or even temporary free shipping. What ties all of these together is that they temporarily change the perceived value exchange to encourage customers to act now rather than later.
From a Marketing Mix Modeling perspective, promotions are not simply “price changes”, they’re distinct demand drivers that can heavily influence conversion rates and channel performance.
Does Sellforte include Promotions in Marketing Mix Modeling?
Yes. Sellforte's standard model configuration for Marketing Mix Modeling includes promotions. Sellforte strongly recommends modeling promotions as part of MMM to ensure accurate measurement of media ROI.
Are Promotions included Google Meridian Marketing Mix Modeling?
No. Google's Meridian enables inclusion of non-media variables, but promotions is not just another non-media variable you can plug into MMM.
Integrating promotions into MMM requires expertise in data selection, feature engineering, model calibration, model validation and so on. If the agency implementing Meridian has these capabilities, you're lucky. But it is more likely they won't have similar level of expertise than a dedicated MMM vendor.
Do most Marketing Mix Modeling vendors include Promotions?
No.
What should I ask my MMM vendor or internal measurement team regarding promotions?
Here's questions you can ask to understand more if/how promotions are part of the Marketing Mix Model:-
What type of promotional have you integreted with MMM?
-
How do you handle collinearity and isolate the effect of promotions vs media?
-
Can I simulate combined scenarios of media + promotions (budget/promotion planning)?
-
How are seasonal/promotional events (e.g., Black Friday) handled in forecasting and optimization?
Authors

Lauri Potka is the Chief Operating Officer at Sellforte, with over 15 years of experience in Marketing Mix Modeling, marketing measurement, and media spend optimization. Before joining Sellforte, he worked as a management consultant at the Boston Consulting Group, advising some of the world’s largest advertisers on data-driven marketing optimization. Follow Lauri in LinkedIn, where he is one of the leading voices in MMM and marketing measurement.
.png)
Top 5 SMB MMM Software for Small Ecommerce Brands ($0–$50M Annual Revenue)
.png)
Top 5 Mid-Market MMM Software for Medium-Sized Ecommerce Brands ($50M–$1B Revenue)
.png)