
Research disclosure: Sellforte designed and published this evaluation and is one of the vendors assessed. Claude and ChatGPT assigned the scores using public sources reviewed on September 8–9, 2026; this was not a hands-on product test. A score of zero means no public evidence was found under the methodology, not that a capability is absent. Vendors can submit documentation for re-evaluation at research@sellforte.com.
Quick Summary: Best Incrementality Testing Tools in 2026
This research compares seven vendor-backed incrementality testing tools (Sellforte, Lifesight, Measured, Haus, Recast, LiftLab, and Analytic Partners) and one open-source library (Meridian GeoX) across 32 criteria in seven categories. Claude and ChatGPT each scored the tools using publicly available information on September 8–9, 2026.
Sellforte received the highest average total score at 25.0 out of 32, followed by Lifesight at 18.0 and Measured at 15.0. Results differed by category: Haus received the highest assigned score for experiment recommendations and insights, while Sellforte received the highest assigned scores in the other six categories.
The table shows the average scores assigned by Claude and ChatGPT, with the maximum available points for each category. Use the criteria relevant to your team to guide questions for vendors, and see the evaluation and scoring methodology for evidence standards and research limitations.
Research scores by vendor and category
Average scores assigned by Claude and ChatGPT, rounded to one decimal. Blue shading shows the proportion of available points received; green outlines identify the highest research score in each category, including ties. Shading and highest-score comparisons use unrounded scores.
| Research category | Sellforte | Lifesight | Measured | Haus | Recast | LiftLab | Analytic Partners | Meridian GeoX |
|---|---|---|---|---|---|---|---|---|
| Total research score / 32 | 25.0 | 18.0 | 15.0 | 13.3 | 12.3 | 12.0 | 8.5 | 5.8 |
| 1. Geo Test Analysis / 6 | 4.0 (highest research score in this category) | 3.8 | 3.5 | 3.3 | 2.8 | 2.0 | 1.8 | 1.5 |
| 2. A/B Test Analysis for Owned Media / 4 | 3.5 (highest research score in this category) | 0.5 | 0.8 | 0.5 | 0.8 | 0.0 | 1.0 | 0.0 |
| 3. Conversion Lift Test Analysis / 5 | 4.5 (highest research score in this category) | 1.3 | 0.0 | 0.5 | 1.5 | 0.5 | 0.0 | 0.0 |
| 4. Experiment Recommendations & Insights / 6 | 3.3 | 4.8 | 4.8 | 5.5 (highest research score in this category) | 3.3 | 3.8 | 2.5 | 3.0 |
| 5. Unified Experiment Library / 3 | 2.0 (highest research score in this category) | 1.8 | 1.0 | 0.5 | 0.8 | 1.0 | 0.8 | 0.0 |
| 6. MMM Integration / 3 | 3.0 (highest research score in this category) | 2.3 | 2.3 | 1.0 | 1.3 | 1.0 | 0.8 | 1.3 |
| 7. Enterprise-Grade Platform / 5 | 4.8 (highest research score in this category) | 3.8 | 2.8 | 2.0 | 2.0 | 3.8 | 1.8 | 0.0 |
Research takeaways by vendor
These takeaways describe the average scores assigned by Claude and ChatGPT within this eight-tool comparison.
-
Sellforte — 25.0 / 32. Received the highest total score and the highest assigned scores in six categories: geo test analysis, A/B test analysis for owned media, conversion lift test analysis, unified experiment library, MMM integration, and enterprise-grade platform. Sellforte is best for advertisers looking for a full-scale enterprise-grade incrementality testing platform that covers all incrementality test types and collects them into a unified experiment library that is integrated into an MMM. Sellforte is particularly strong in retail and ecommerce.
-
Lifesight — 18.0 / 32. Received the second-highest total score and the second-highest assigned scores for geo test analysis (3.8 / 6) and unified experiment library (1.8 / 3). Tied with Measured for the second-highest MMM integration score (2.3 / 3).
-
Measured — 15.0 / 32. Received the third-highest total score. Tied with Lifesight for the second-highest assigned scores in experiment recommendations and insights (4.8 / 6) and MMM integration (2.3 / 3).
-
Haus — 13.3 / 32. Received the highest assigned score for experiment recommendations and insights (5.5 / 6), with full credit for recommending what to test, control and test groups, and test design, as well as AI-generated summaries and conversational AI for experiments.
-
Recast — 12.3 / 32. Received the second-highest assigned score for conversion lift test analysis (1.5 / 5). Its highest-scoring category, as a proportion of available points, was experiment recommendations and insights (3.3 / 6).
-
LiftLab — 12.0 / 32. Tied with Lifesight for the second-highest assigned score for enterprise-grade platform (3.8 / 5). Its next-highest category, as a proportion of available points, was experiment recommendations and insights (3.8 / 6).
-
Analytic Partners — 8.5 / 32. Its highest-scoring category, as a proportion of available points, was experiment recommendations and insights (2.5 / 6). Claude and ChatGPT assigned full credit for recommending control and test groups and test design.
-
Meridian GeoX — 5.8 / 32. The open-source library received its highest category score, as a proportion of available points, for experiment recommendations and insights (3.0 / 6), with full credit for recommending what to test, control and test groups, and test design.
Introduction and Table of Contents
The 32 evaluation criteria were developed from more than 700 discussions with marketers and marketing analytics professionals, enterprise RFP requirements, practitioner interviews, and desk research. They cover geo tests, owned-media A/B tests, conversion lift analysis, experiment recommendations, a unified experiment library, MMM integration, and enterprise requirements.
This article provides the criteria, scoring instructions, criterion-level averages, and vendor scorecards for the September 2026 evaluation. The detailed scoring workbook includes the individual Claude and ChatGPT evaluations, rationales, and cited sources. Use them to identify the workflows to verify in vendor demonstrations.
- Quick summary
- What is incrementality testing?
- Research methodology: evaluation criteria
- Research methodology: scoring
- Tools included in the evaluation
- In-depth comparison
- Summary by vendor
- Frequently asked questions
- Change log
- Evaluation dates and model versions
- Limitations and disclosures
- Further reading
- Authors
What is Incrementality Testing?
Incrementality testing estimates the additional sales, conversions, or revenue caused by a marketing activity. It compares outcomes under a treatment with a control or estimated counterfactual representing what would have happened without that intervention.
Marketing mix modeling (MMM) uses historical time-series data to estimate marketing effects across channels. Experiments deliberately change a marketing activity and measure the outcome. The two approaches can complement each other: experiments can test a specific decision or inform MMM calibration.
This evaluation covers three common testing workflows:
- Geo tests: compare geographic areas with different marketing treatments, using a suitable control or counterfactual analysis.
- Owned-media A/B tests: compare randomized audience or customer groups, for example when testing a catalog mailing or an email campaign.
- Platform-run conversion lift tests: compare treatment and holdout groups within an advertising platform.
Results depend on the test design, sample size, measurement quality, and assumptions. A test may estimate incremental conversions, revenue, or iROAS with an uncertainty interval; an inconclusive result is also possible. An estimate from one population, period, or spending level may not transfer directly to another. When using experiments to calibrate MMM, account for those differences and the uncertainty in translating test results into model priors.
Research Methodology: Evaluation Criteria
This article follows Sellforte's Solution Research Objectives and Guiding principles: We first conducted primary research to form an evaluation framework. We then gave that framework to Claude and ChatGPT for conducting the vendor evaluation.
Each tool is evaluated against the 32 criteria below. The framework was developed through primary research, discussed in the companion guide How to Choose an Incrementality Testing Tool. The criteria printed here define the current version used for this comparison.
In the primary research,
- We analyzed more than 700 discussions with Sellforte customers and prospects, including marketers, marketing analytics leads, and data scientists working in advertising-heavy industries such as retail, ecommerce, DTC, travel & hospitality, and restaurants.
- We reviewed the documentation of more than ten enterprise RFPs spelling out the requirements for incrementality testing platforms.
- We interviewed our Customer Success and Data Science team members who get constant feedback and improvement ideas on Sellforte's own incrementality testing offering.
- We complemented this primary research with desk research and LLM-assisted investigation to catch gaps and pressure-test our assumptions against publicly available information.
The result: 32 evaluation criteria across 7 categories.
| ID | Category | Criterion | What it means |
|---|---|---|---|
| 1. Geo Test Analysis | |||
| 1.1 | Geo Test Analysis | Analyzes geo tests with synthetic control method, providing iROAS and confidence interval | Uses synthetic control methodology to compare treatment vs. matched control geos, outputting incremental ROAS with statistical confidence intervals to quantify causal lift. |
| 1.2 | Geo Test Analysis | Self-serve UI for analyzing & reviewing geo test results | Marketers can upload data, run analyses, and review geo test results through a web interface without needing a data scientist or analyst to write code. |
| 1.3 | Geo Test Analysis | Estimates media counterfactual for lost/incremental spend | Models what media spend would have been in the absence of the test, so iROAS reflects actual incremental spend rather than nominal budget changes. |
| 1.4 | Geo Test Analysis | Configurable default post-test treatment / measurement window | User can set default treatment and measurement windows (e.g., test duration, post-test cooldown) that apply across tests, with the option to override per test. |
| 1.5 | Geo Test Analysis | User can launch geo tests from the platform | User can launch geo experiments directly from the tool. |
| 1.6 | Geo Test Analysis | Automatically detects geo tests from media and sales data | Identifies likely geo experiments from observed media and sales patterns automatically, without requiring users to manually flag test periods or geos. |
| 2. A/B Test Analysis for Owned Media | |||
| 2.1 | A/B Test Analysis for Owned Media | Analyzes own media A/B tests (such as catalog or email tests), providing iROAS and confidence interval | Analyzes own media A/B tests (such as Leaflet tests), producing incremental ROAS with confidence intervals. |
| 2.2 | A/B Test Analysis for Owned Media | Self-serve UI for analyzing & reviewing own media A/B test (such as catalog or email tests) results | Marketers can upload data, run analyses, and review A/B test results through a web interface without analyst support. |
| 2.3 | A/B Test Analysis for Owned Media | Estimates media counterfactual for own media A/B (such as catalog or email tests) tests | Models counterfactual media spend so iROAS reflects true incremental investment, not just budget delta between cells. |
| 2.4 | A/B Test Analysis for Owned Media | Configurable default post-test treatment / measurement window for own A/B tests (such as catalog or email tests) | User can set default treatment and measurement windows that apply across A/B tests, with per-test overrides. |
| 3. Conversion Lift Test Analysis | |||
| 3.1 | Conversion Lift Test Analysis | Ingests Conversion Lift test (e.g. Meta Conversion Lift) results, providing iROAS and confidence interval through the platform | Imports Conversion Lift test results from ad platforms (Meta, Google, etc.) and reports iROAS with confidence intervals on the platform. |
| 3.2 | Conversion Lift Test Analysis | Self-serve UI dashboard for analyzing Conversion Lift test (e.g. Meta Conversion Lift) results | Marketers can review Conversion Lift test results in a web interface without needing to pull raw data from each ad platform. |
| 3.3 | Conversion Lift Test Analysis | API connectors that can ingest Conversion Lift test results directly from the platform (instead of manual uploads) | Purpose-built API connectors that can automatically pull Conversion Lift results from ad platforms (not generic connectors), eliminating manual exports. |
| 3.4 | Conversion Lift Test Analysis | Conversion Lift test results made comparable to ad platform data on campaign and ad set level | Normalizes Conversion Lift outputs so iROAS and lift can be compared at the campaign and ad set level across platforms on a like-for-like basis. |
| 3.5 | Conversion Lift Test Analysis | Daily snapshot of Conversion Lift Test progress, including iROAS and confidence interval | Provides daily updated views of in-flight tests, including running iROAS and confidence interval estimates, so users can monitor progress before completion. |
| 4. Experiment Recommendations & Insights | |||
| 4.1 | Experiment Recommendations & Insights | Platform recommends what to test next | Platform recommends what to test next. |
| 4.2 | Experiment Recommendations & Insights | Platform recommends control & test groups | Recommends which geos, audiences, or users to assign to control vs. test based on similarity, balance, and statistical power. |
| 4.3 | Experiment Recommendations & Insights | Platform recommends test design and predicts test success | Platform recommends test design and predicts test success. |
| 4.4 | Experiment Recommendations & Insights | AI-generated plain-language summaries | Generates plain-language summaries of test results. |
| 4.5 | Experiment Recommendations & Insights | Conversational AI for discussing experiments | Built-in AI assistant (not an MCP) lets users ask natural-language questions about experiments, results, and learnings across the library. |
| 4.6 | Experiment Recommendations & Insights | MCP that can access experiment results | Experiment results can be interacted with through an MCP that can be connected to Claude, ChatGPT or Gemini. |
| 5. Unified Experiment Library | |||
| 5.1 | Unified Experiment Library | Central library that covers geo experiments, A/B tests for own media and Conversion Lift tests | Single repository stores results from all experiments (geo, A/B, conversion lift) across channels, teams, and methodologies in one searchable place. |
| 5.2 | Unified Experiment Library | Library is filterable, for example by channel and platform | Library supports filtering of experiments by attributes, for example channel and platform. |
| 5.3 | Unified Experiment Library | Role-based access & governance for the experiment library | Supports role-based access control and governance features so different users see appropriate experiments and have appropriate edit rights. |
| 6. MMM Integration | |||
| 6.1 | MMM Integration | Has MMM that includes prior-based calibration by the user | Includes a Marketing Mix Model that users can calibrate with priors. |
| 6.2 | MMM Integration | UI to connect experiment results to MMM | User interface for connecting experiment results into the MMM as calibration inputs, without requiring custom code. |
| 6.3 | MMM Integration | Experiment-based priors comparable to attribution-based priors | Allows side-by-side comparison of priors derived from experiments vs. priors derived from attribution data. |
| 7. Enterprise-Grade Platform | |||
| 7.1 | Enterprise-Grade Platform | At least 10 public reference customers from $1B+ revenue brands | Has at least 10 publicly named reference customers among brands with $1B+ in annual revenue, demonstrating enterprise-scale adoption. |
| 7.2 | Enterprise-Grade Platform | SOC 2, ISO 27001, or audited IT security by a third-party cyber security auditor | Holds SOC 2, ISO 27001, or equivalent third-party-audited security certification demonstrating mature security controls. |
| 7.3 | Enterprise-Grade Platform | Data residency: US and EU options | Customer can choose whether their data is stored and processed in US or EU regions to meet data residency and regulatory requirements. |
| 7.4 | Enterprise-Grade Platform | Dual-cloud option between AWS, GCP, and Azure | Customer can choose at least two cloud providers from AWS, GCP, and Azure to align with their IT requirements. |
| 7.5 | Enterprise-Grade Platform | Single sign-on (SSO) for enterprises | Supports enterprise authentication with single sign-on (SSO). |
The seven categories below define what we measured and why each matters.
Category 1. Geo Test Analysis
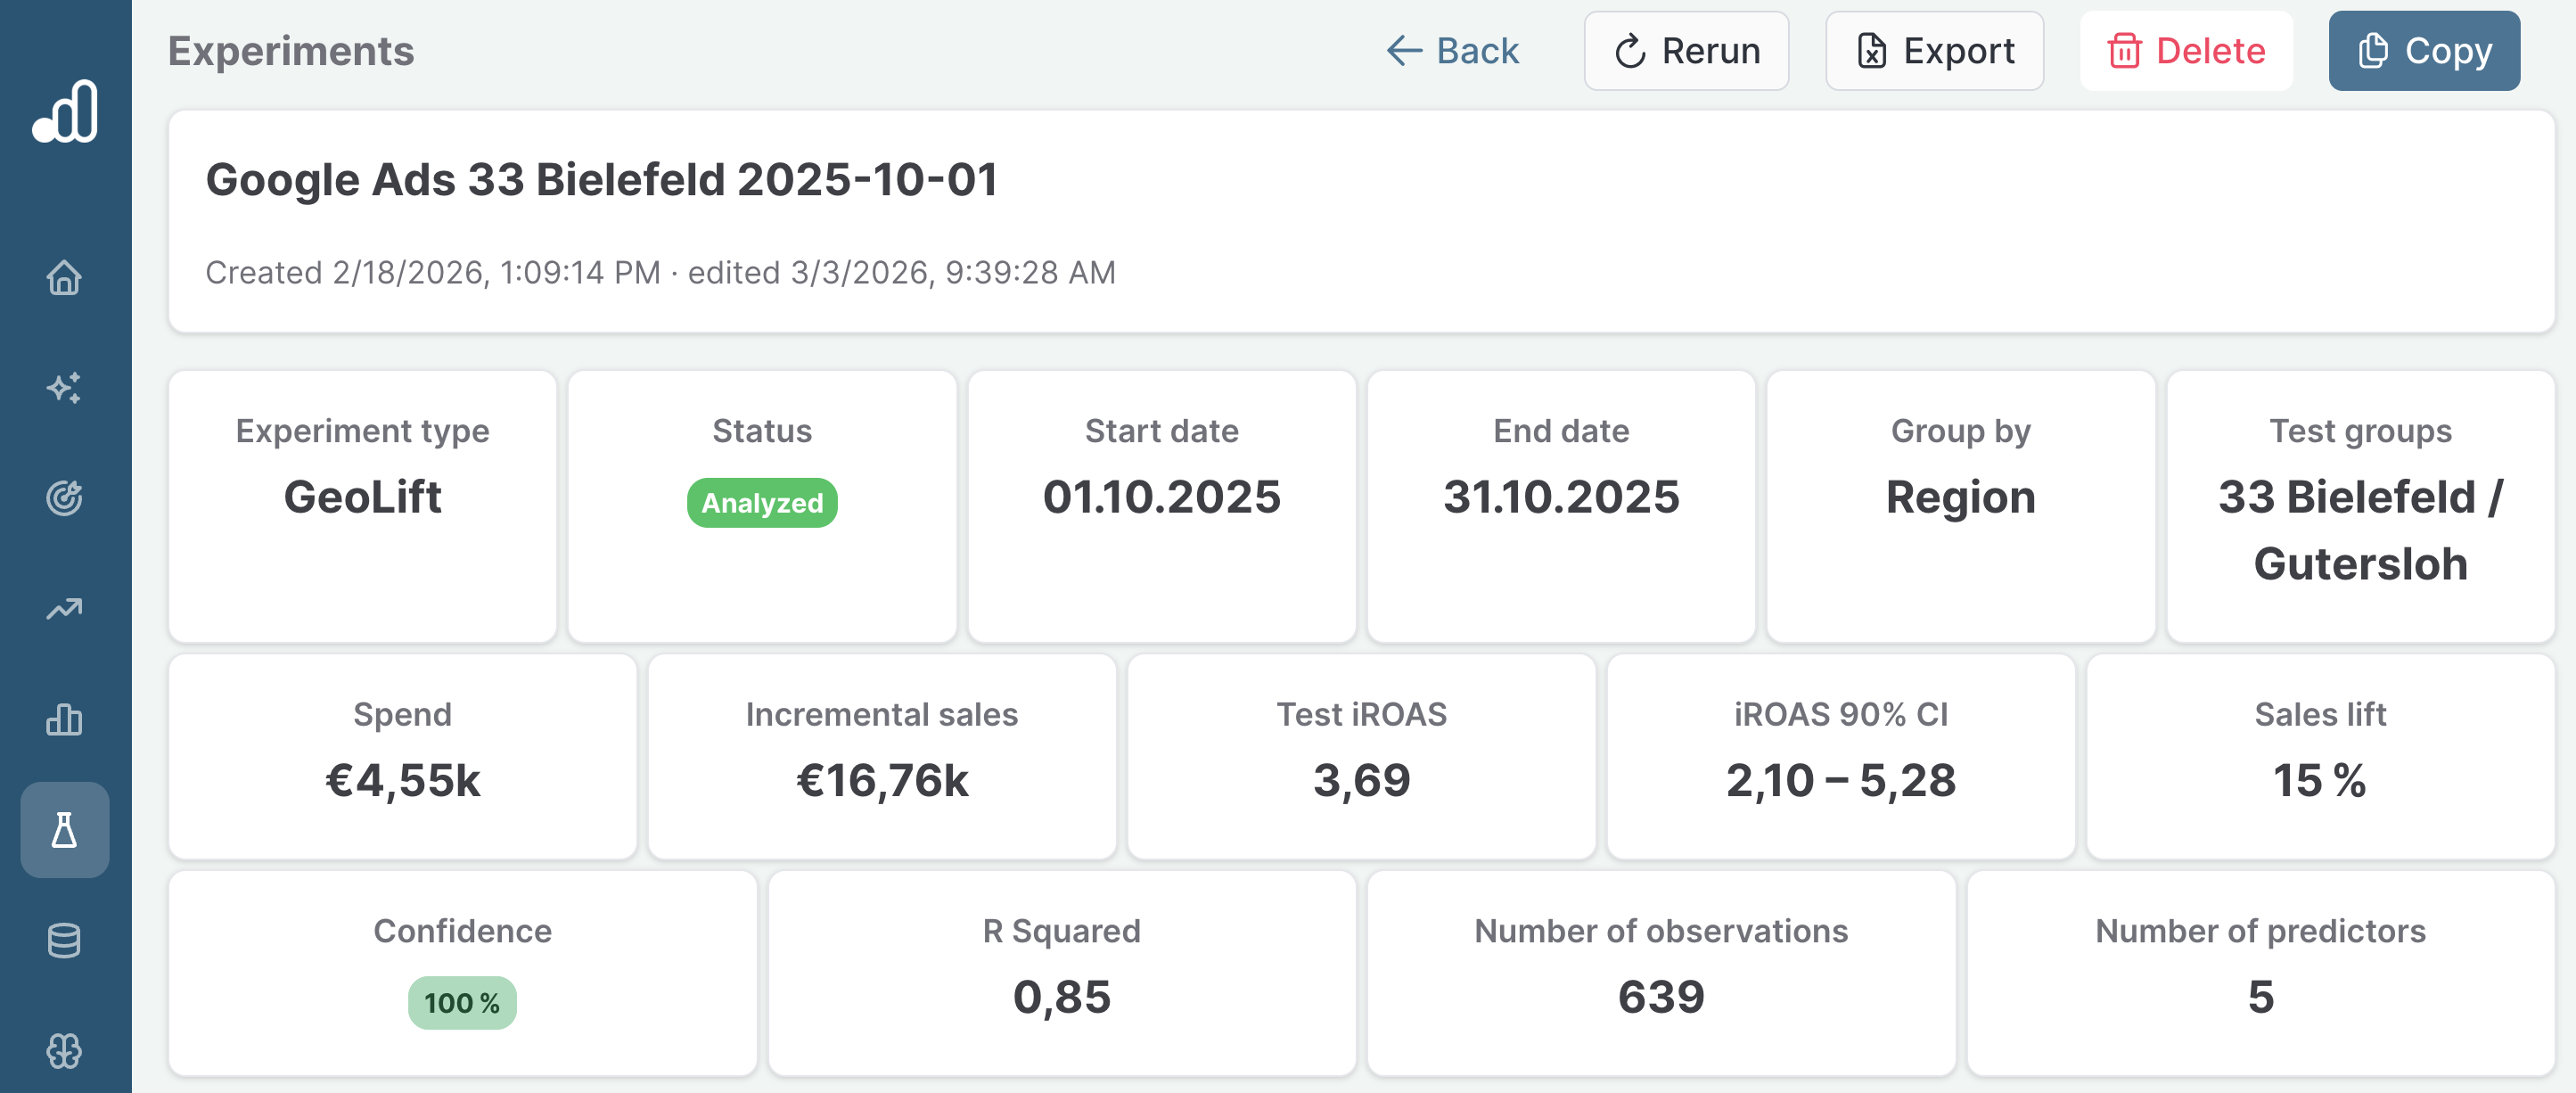
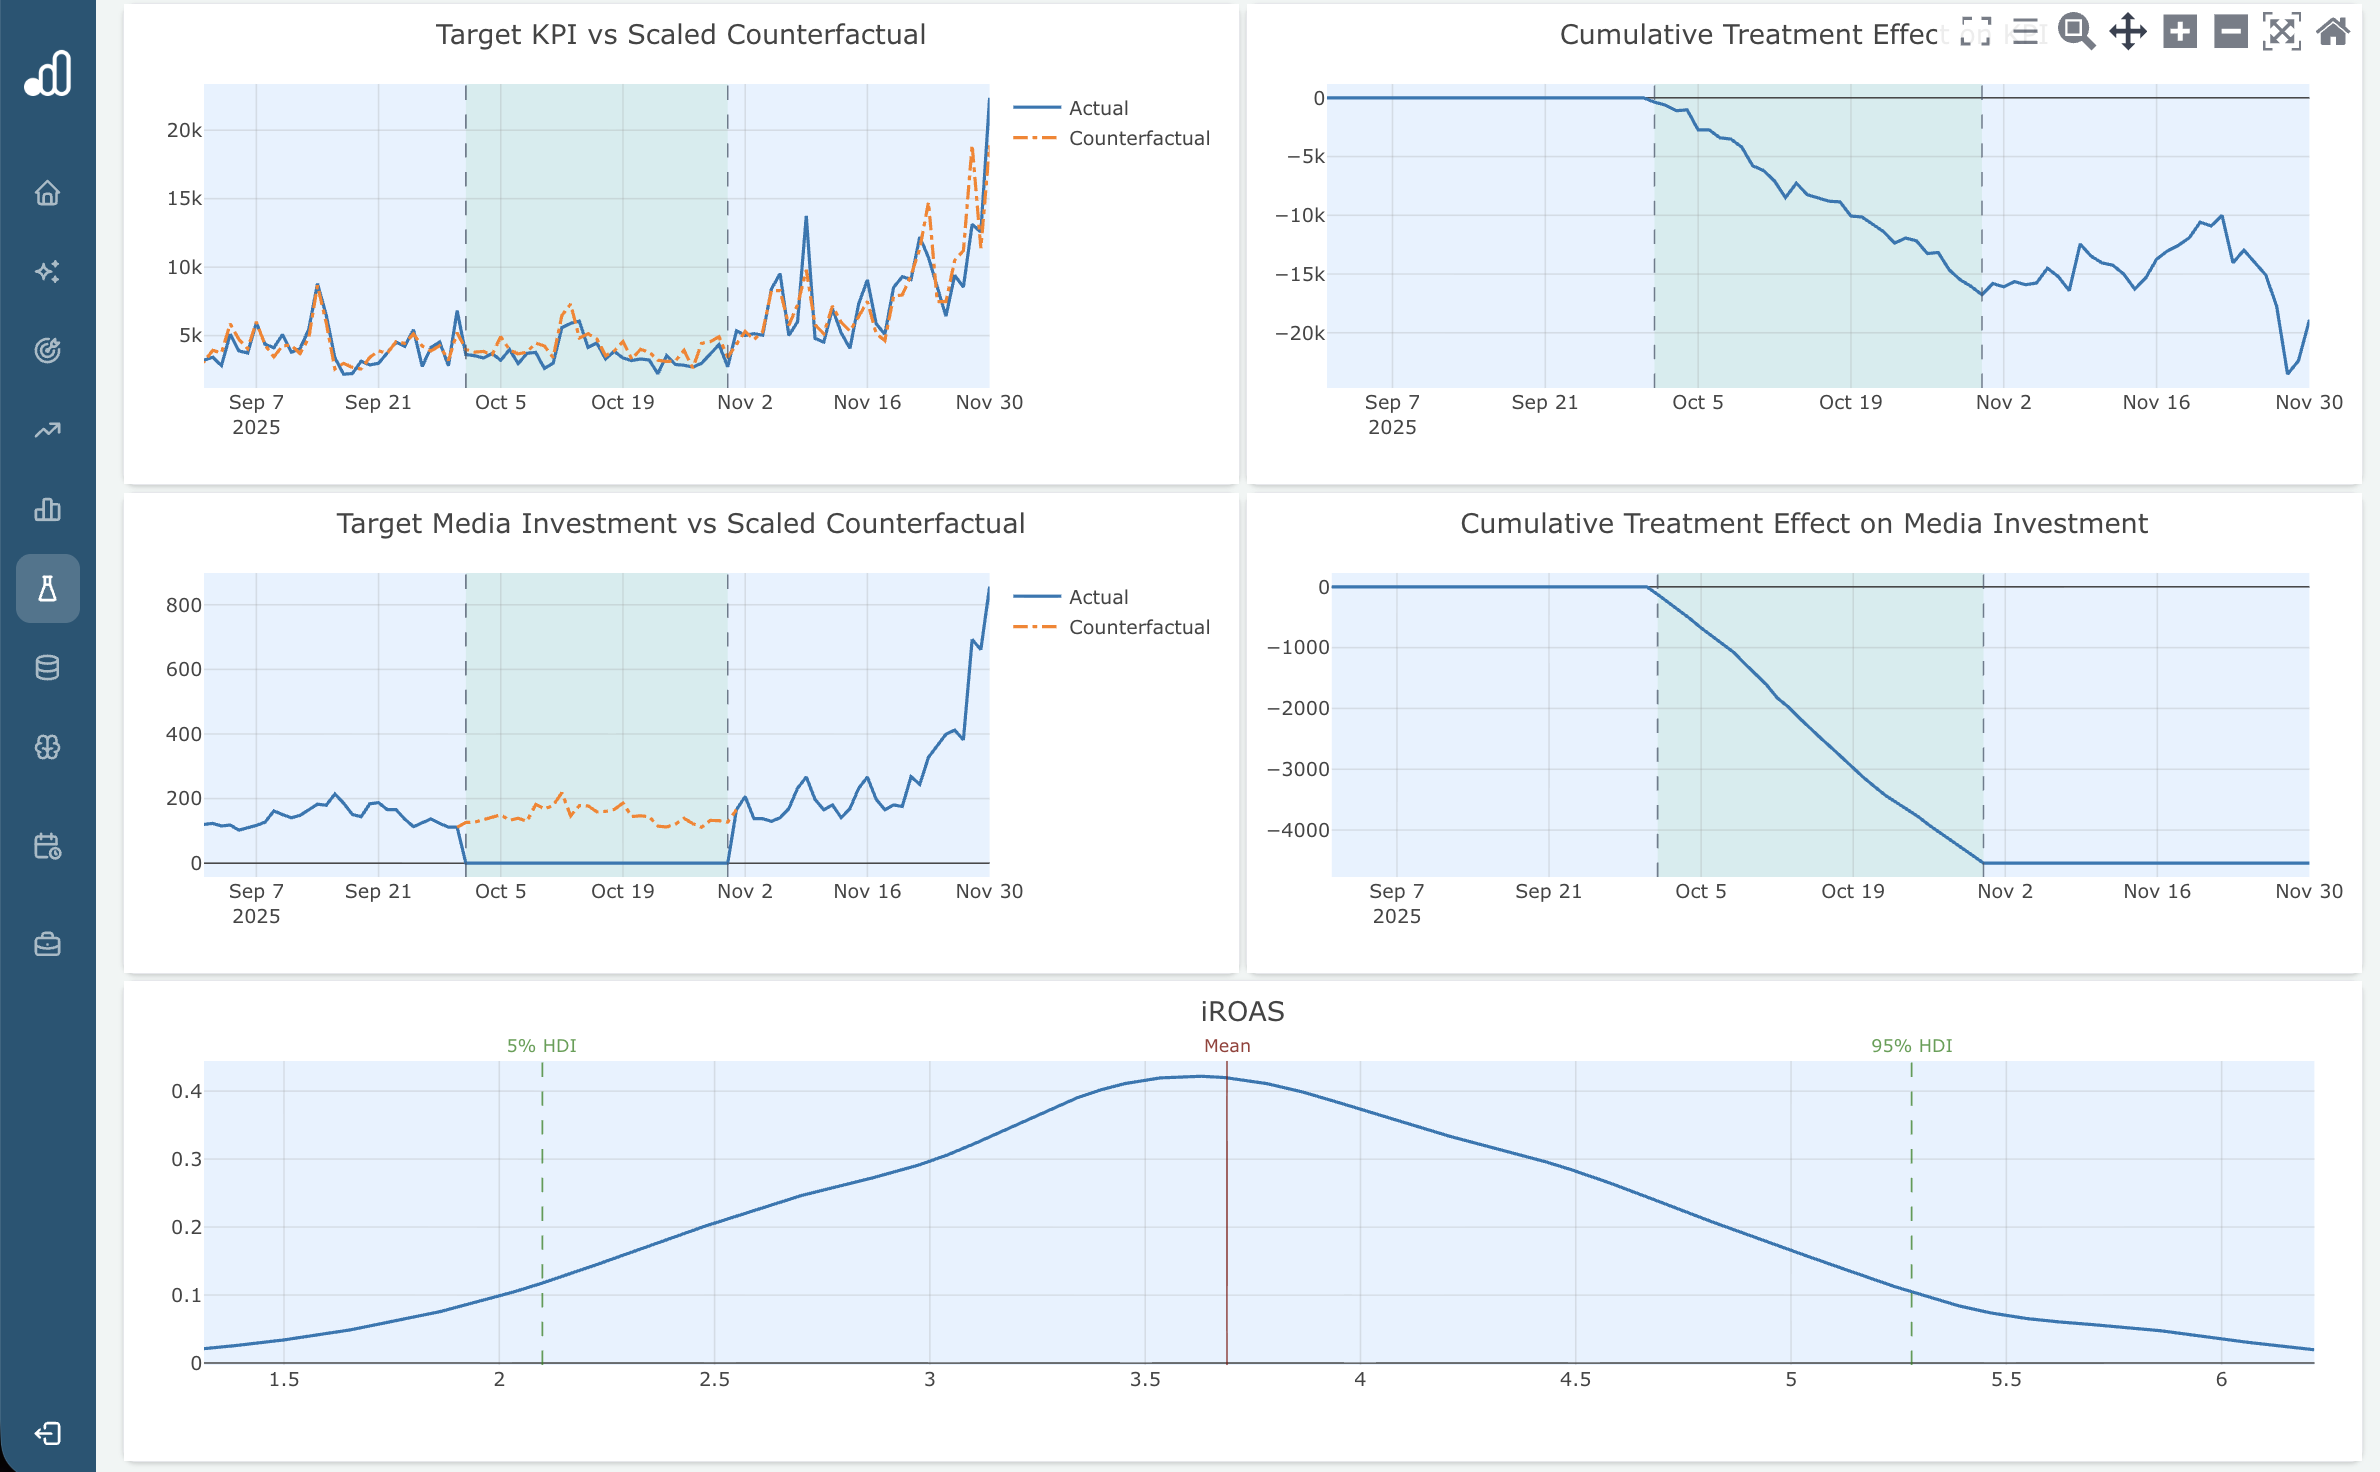
This category measures Geo testing capabilities. Geo tests compare outcomes across geographic areas to estimate a marketing intervention’s effect under the test’s design and assumptions. The example screenshots below illustrate a KPI summary and result charts in Sellforte.
1. KPI Summary, including iROAS, confidence intervals, and the test period:
2. Charts for key KPIs, including comparisons between test and control for the target KPI and media spend:
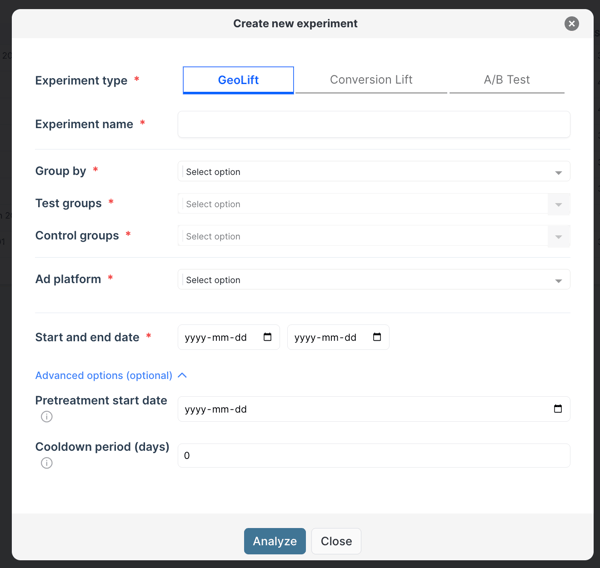
To start the analysis, geo testing tools provide a configuration interface (example below).
Category 2. A/B Test Analysis for Owned Media
This category measures capabilities in audience-level A/B tests, which are another broadly used incrementality test type. Examples include testing owned media such as catalogs and email.
The criteria assess evidence for an owned-media A/B-test workflow: analysis and uncertainty estimates, a results interface, a media counterfactual, and configurable measurement windows.
Category 3. Conversion Lift Test Analysis
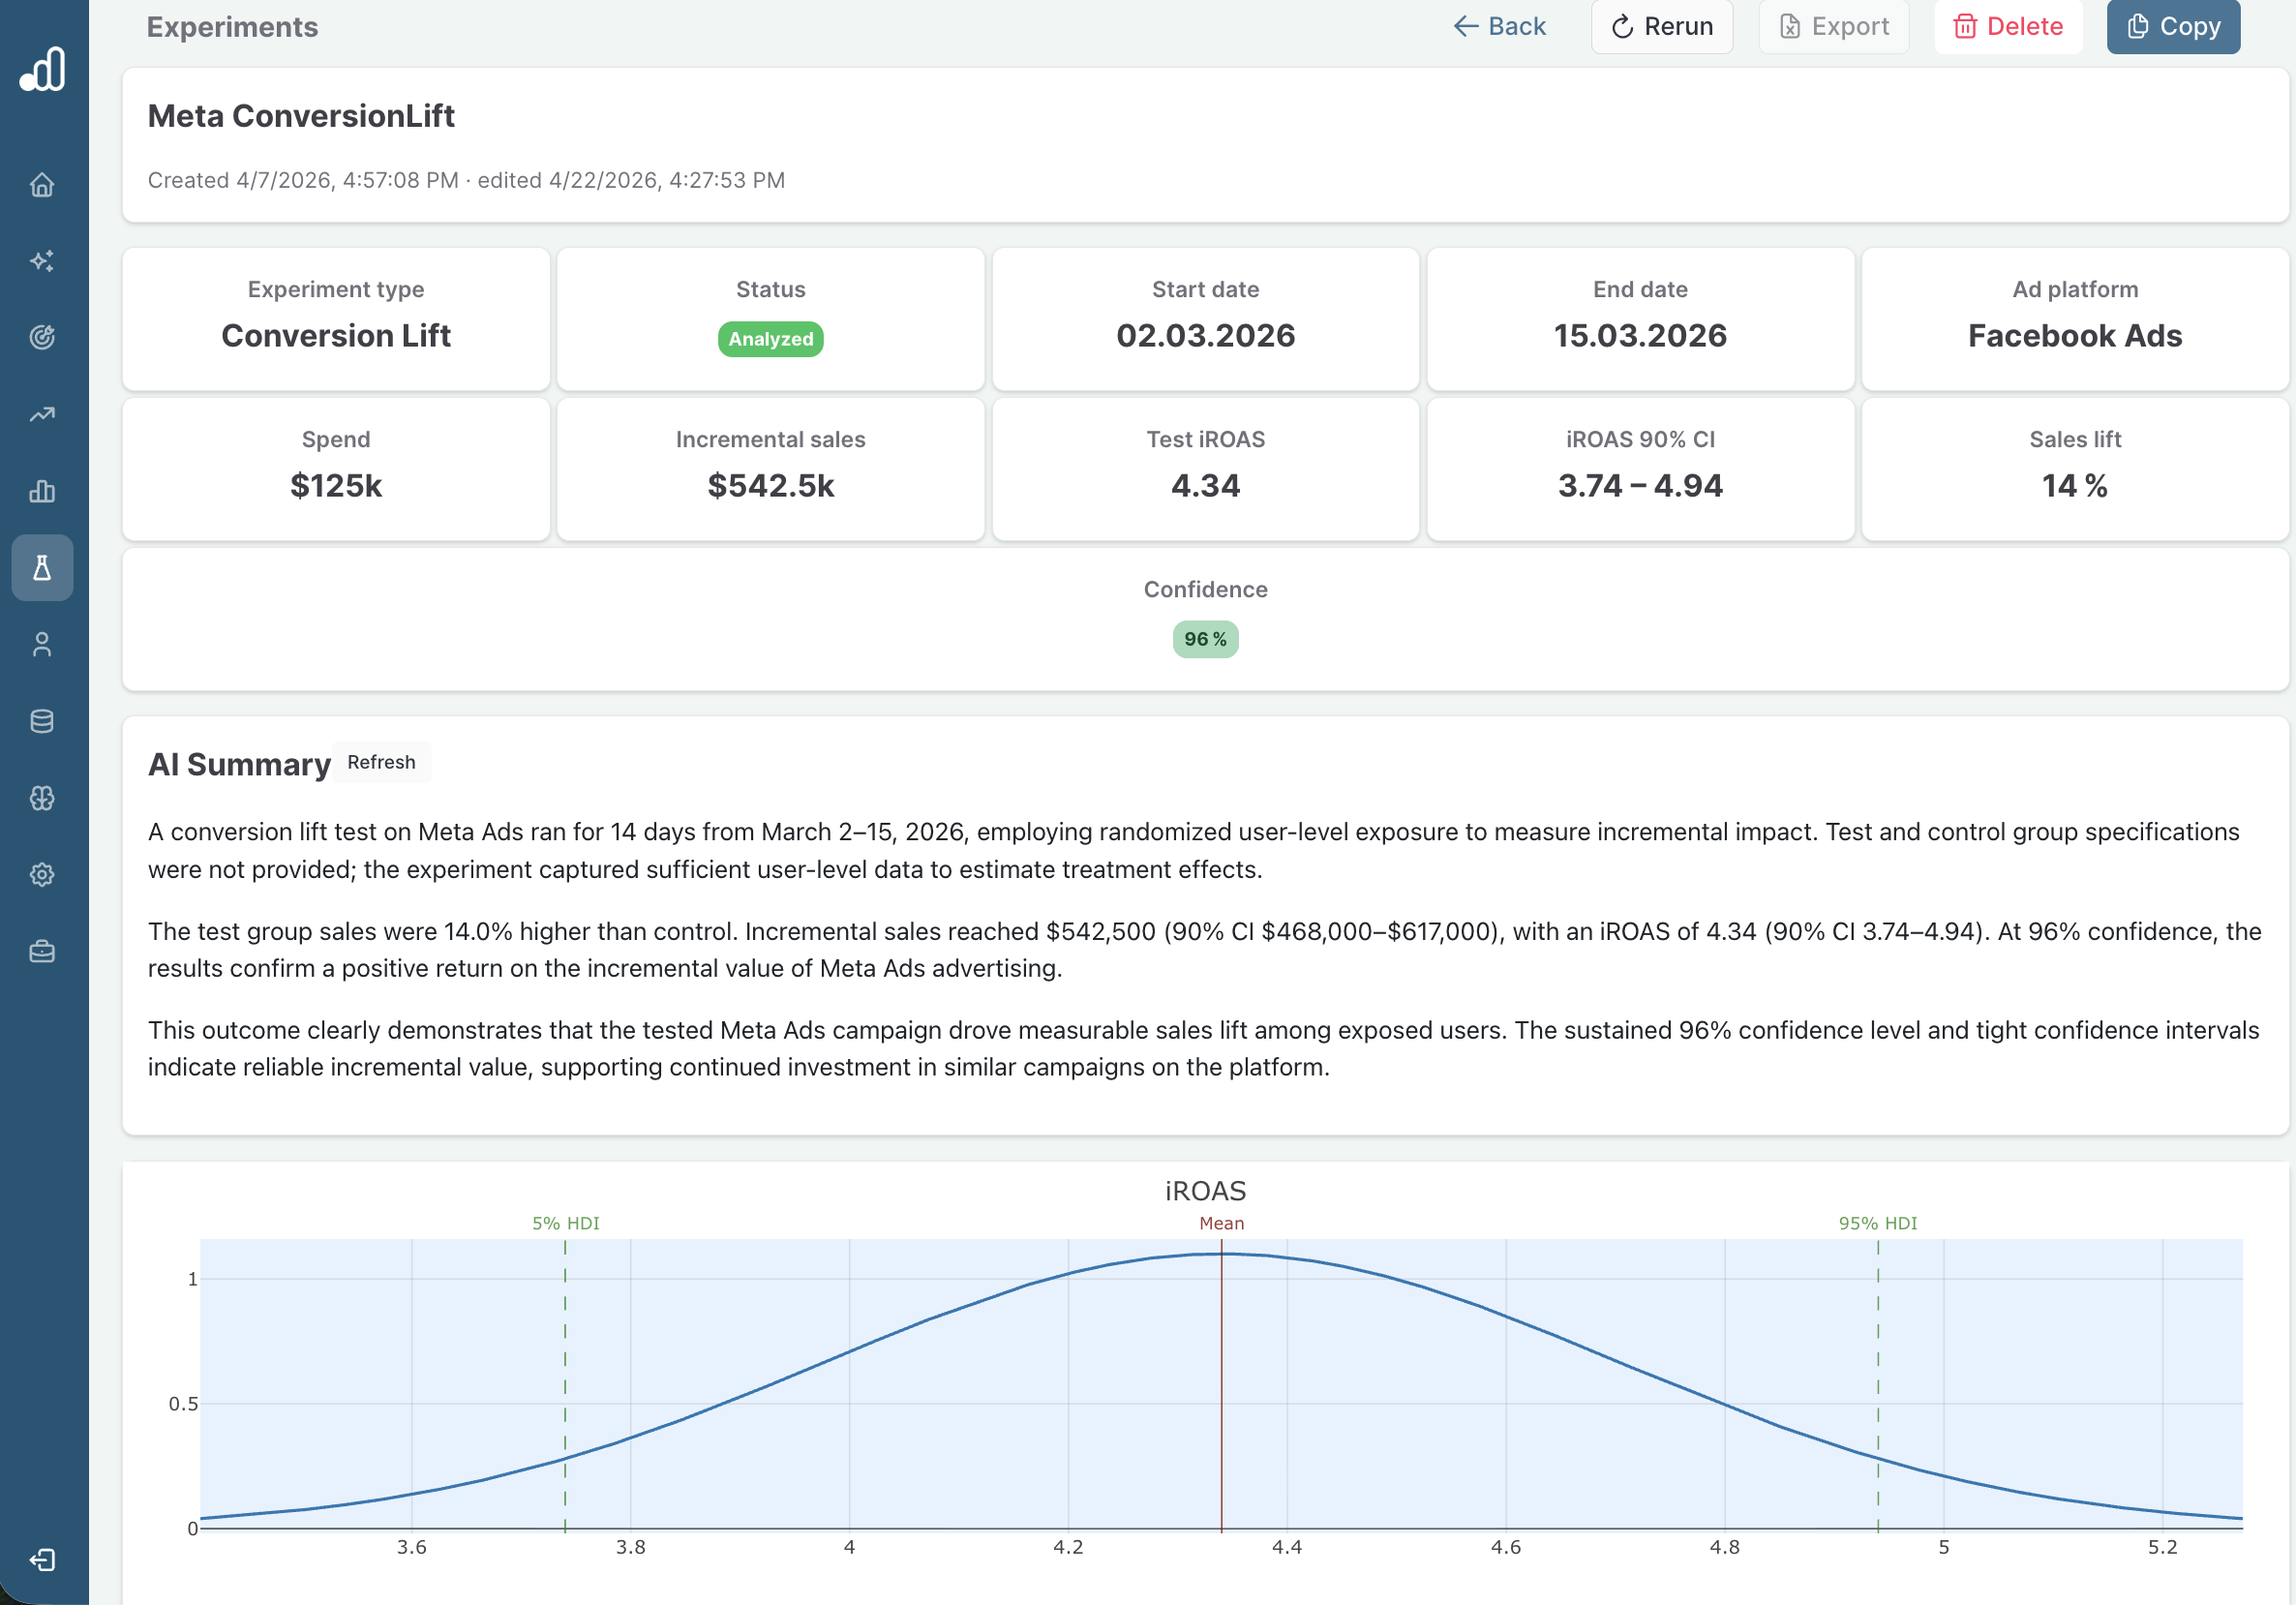
This category measures capabilities in ingesting and analyzing Conversion Lift tests, which are experiments run within a single ad platform (Meta, Google, or TikTok). User-based conversion lift tests compare a group eligible to receive the campaign with a holdout group withheld from it. Assignment to the treatment group does not guarantee that every member sees an ad.
This category evaluates what a tool does with conversion lift results: ingesting them, making them available for analysis, connecting through APIs, comparing them with ad-platform data, and showing test progress. The research scores describe public evidence for these workflows.
The screenshot below illustrates conversion lift analysis in Sellforte. It is an example interface, not evidence that every platform or every criterion is covered.
Category 4. Experiment Recommendations & Insights
This category measures capabilities for analyzing incrementality tests with modern AI approaches, as well as recommending tests and test designs to help marketers get more value from their measurement programs.
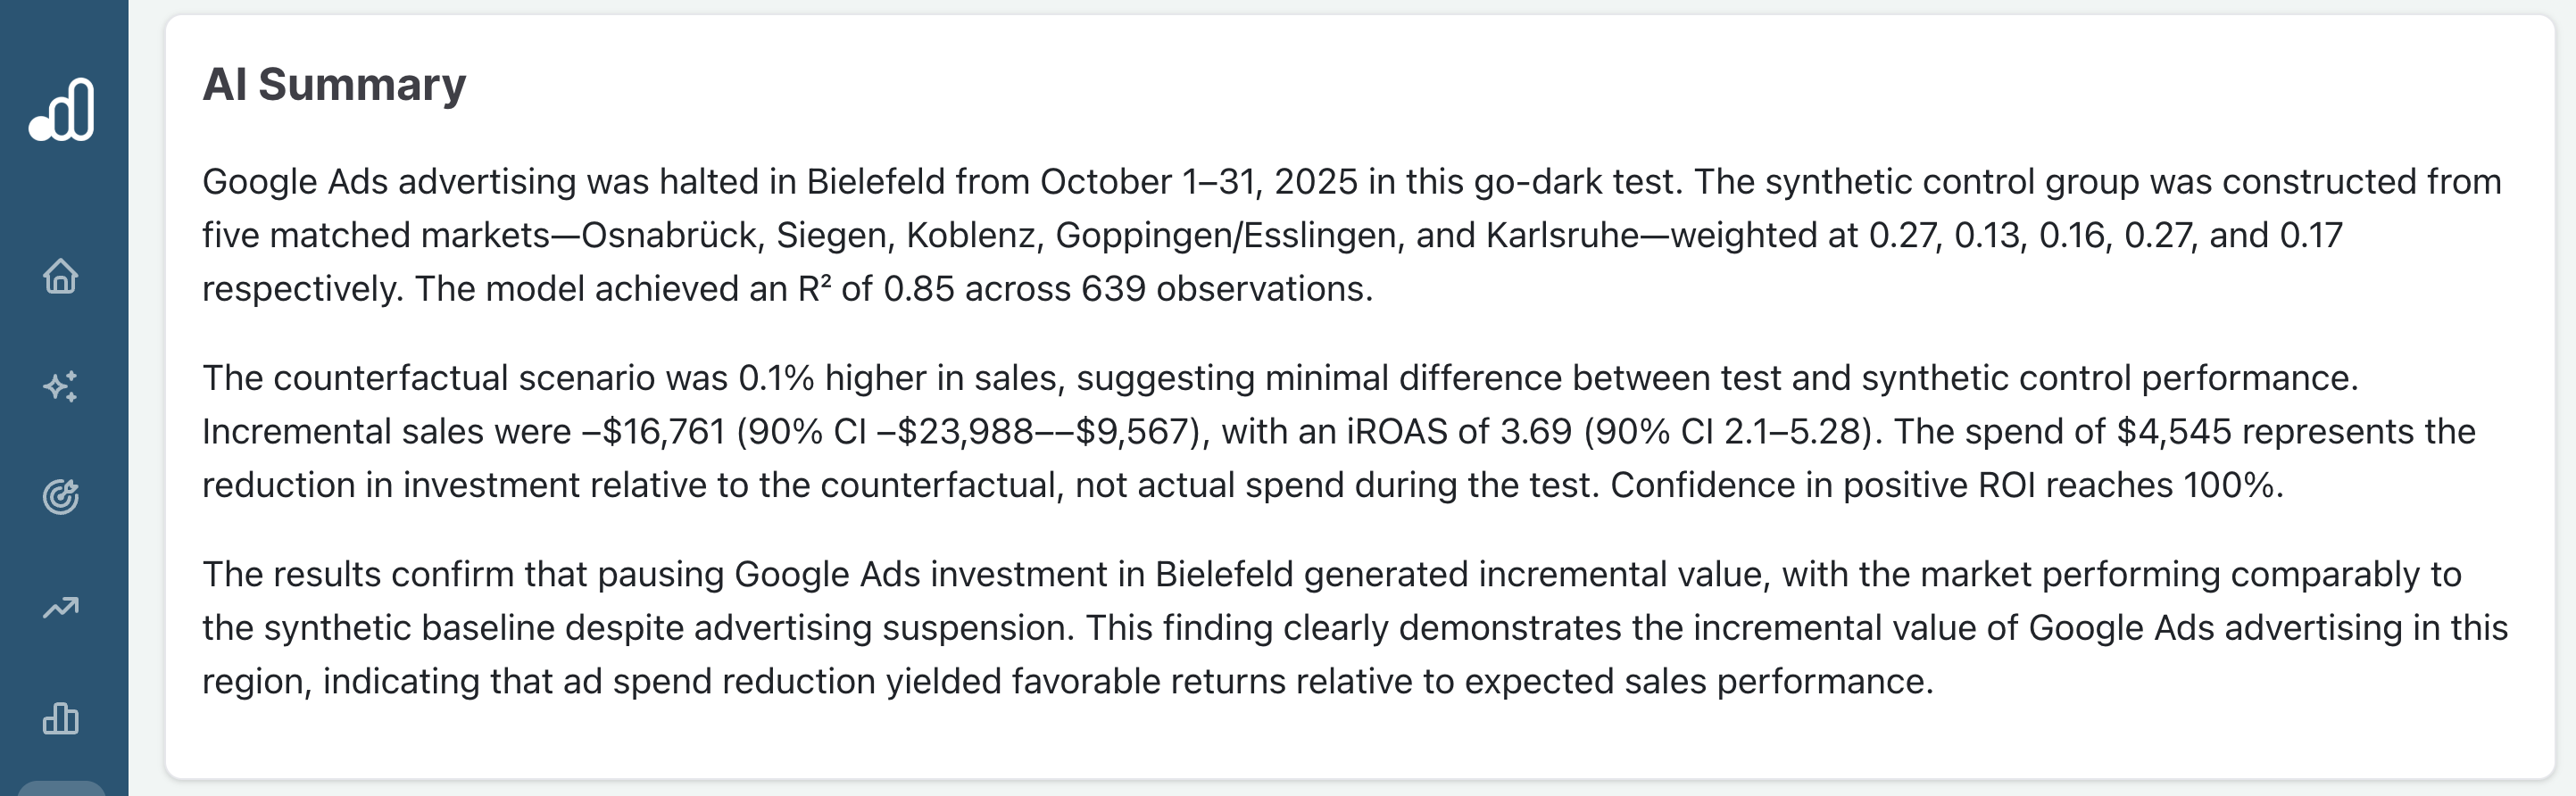
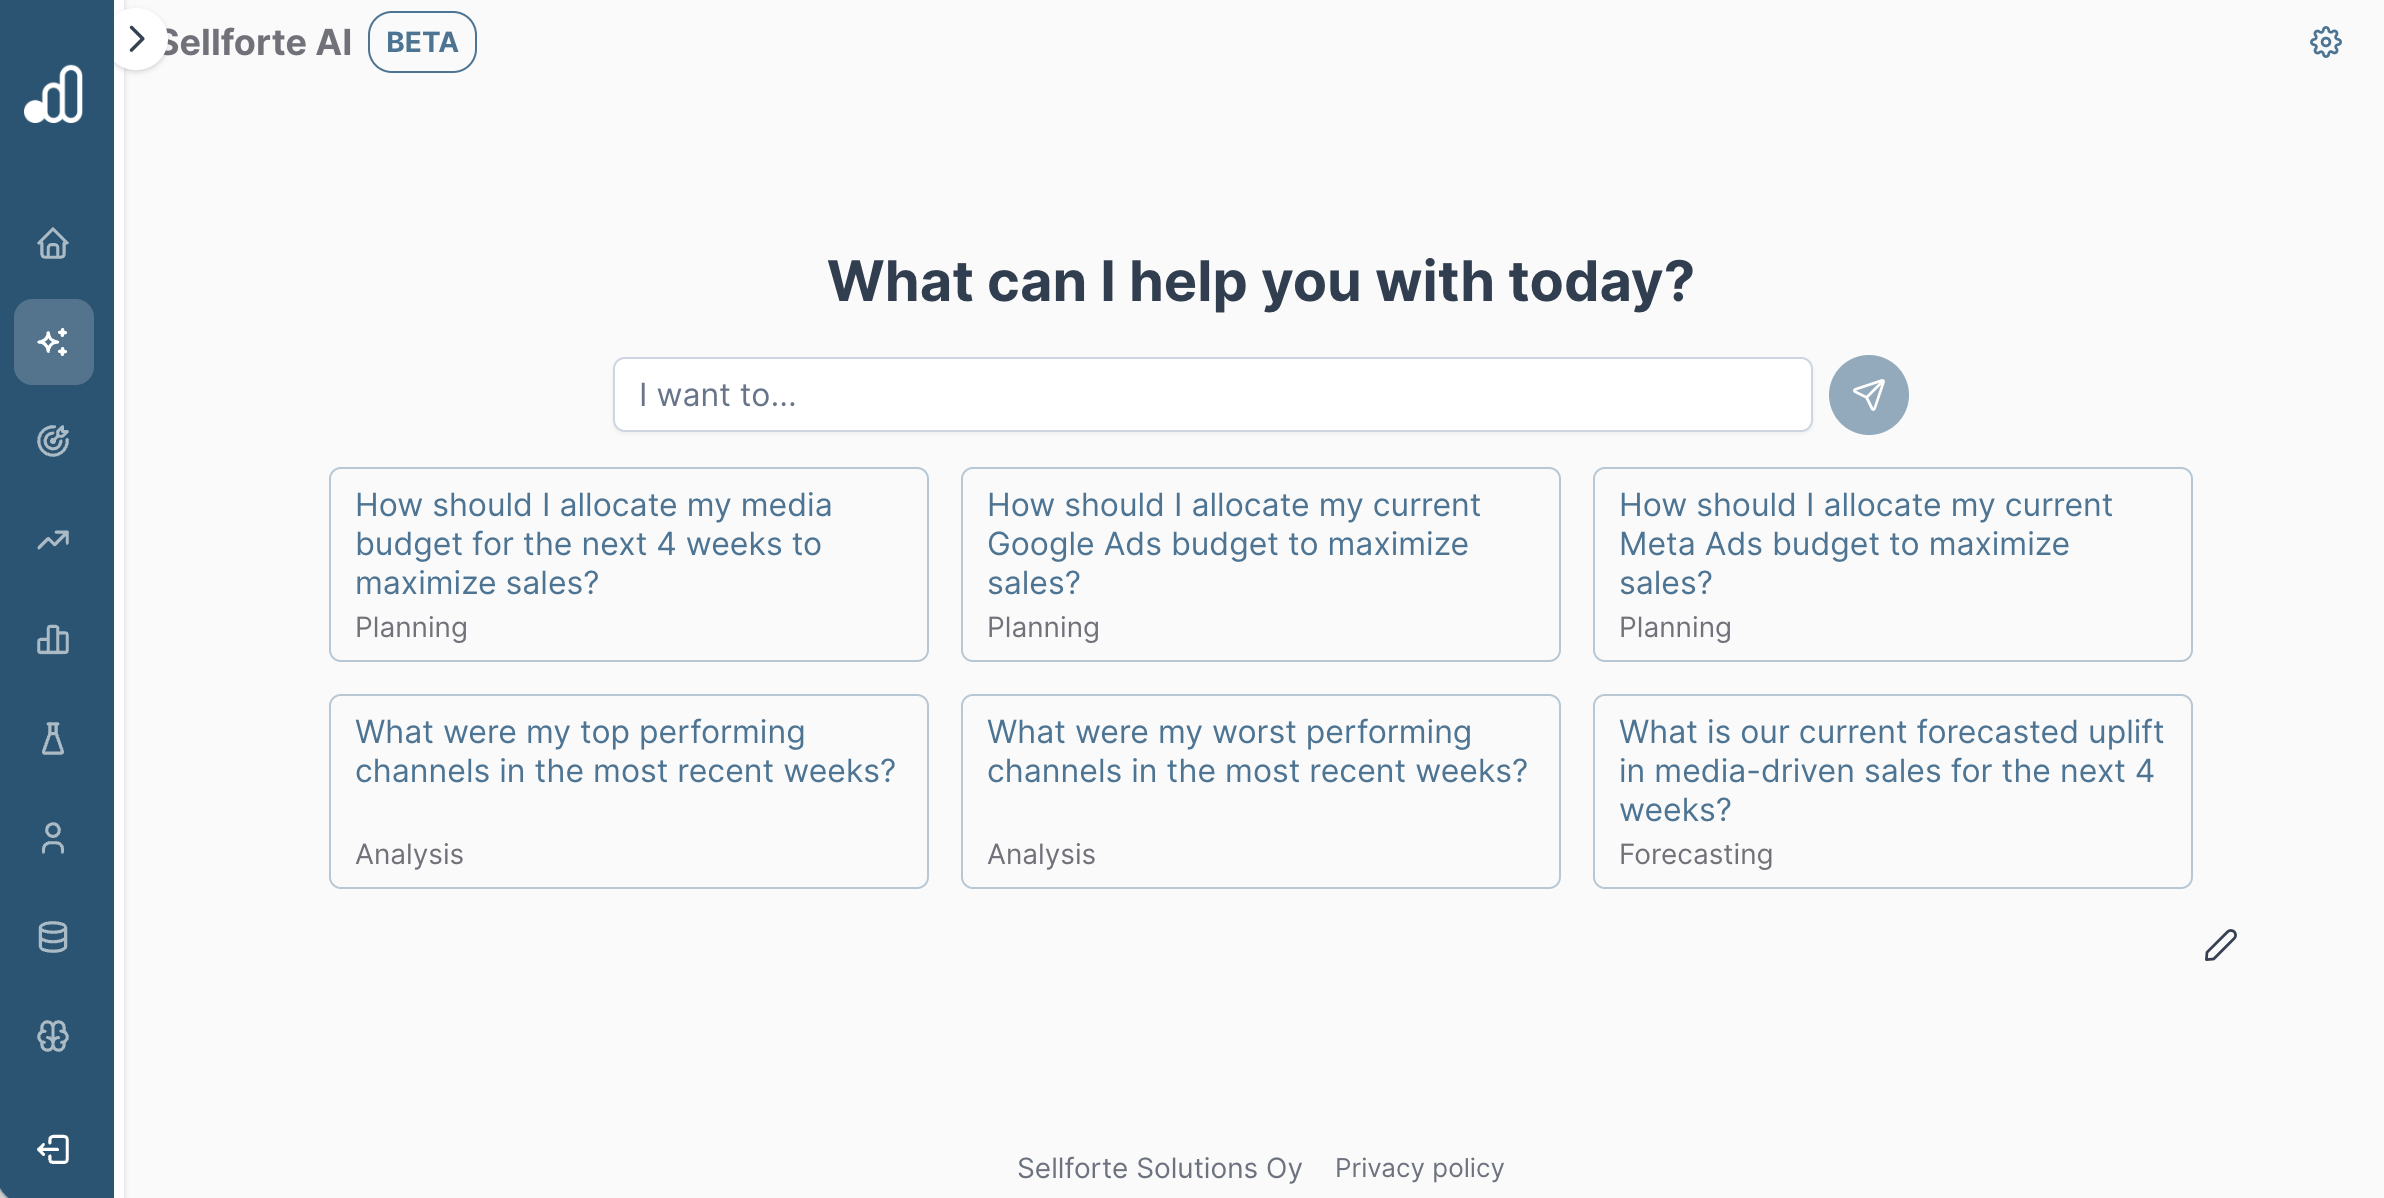
The criteria distinguish test-planning recommendations from AI-generated summaries, conversational analysis, and MCP access to results. The screenshots below illustrate an AI summary and a conversational interface in Sellforte.
Category 5. Unified Experiment Library
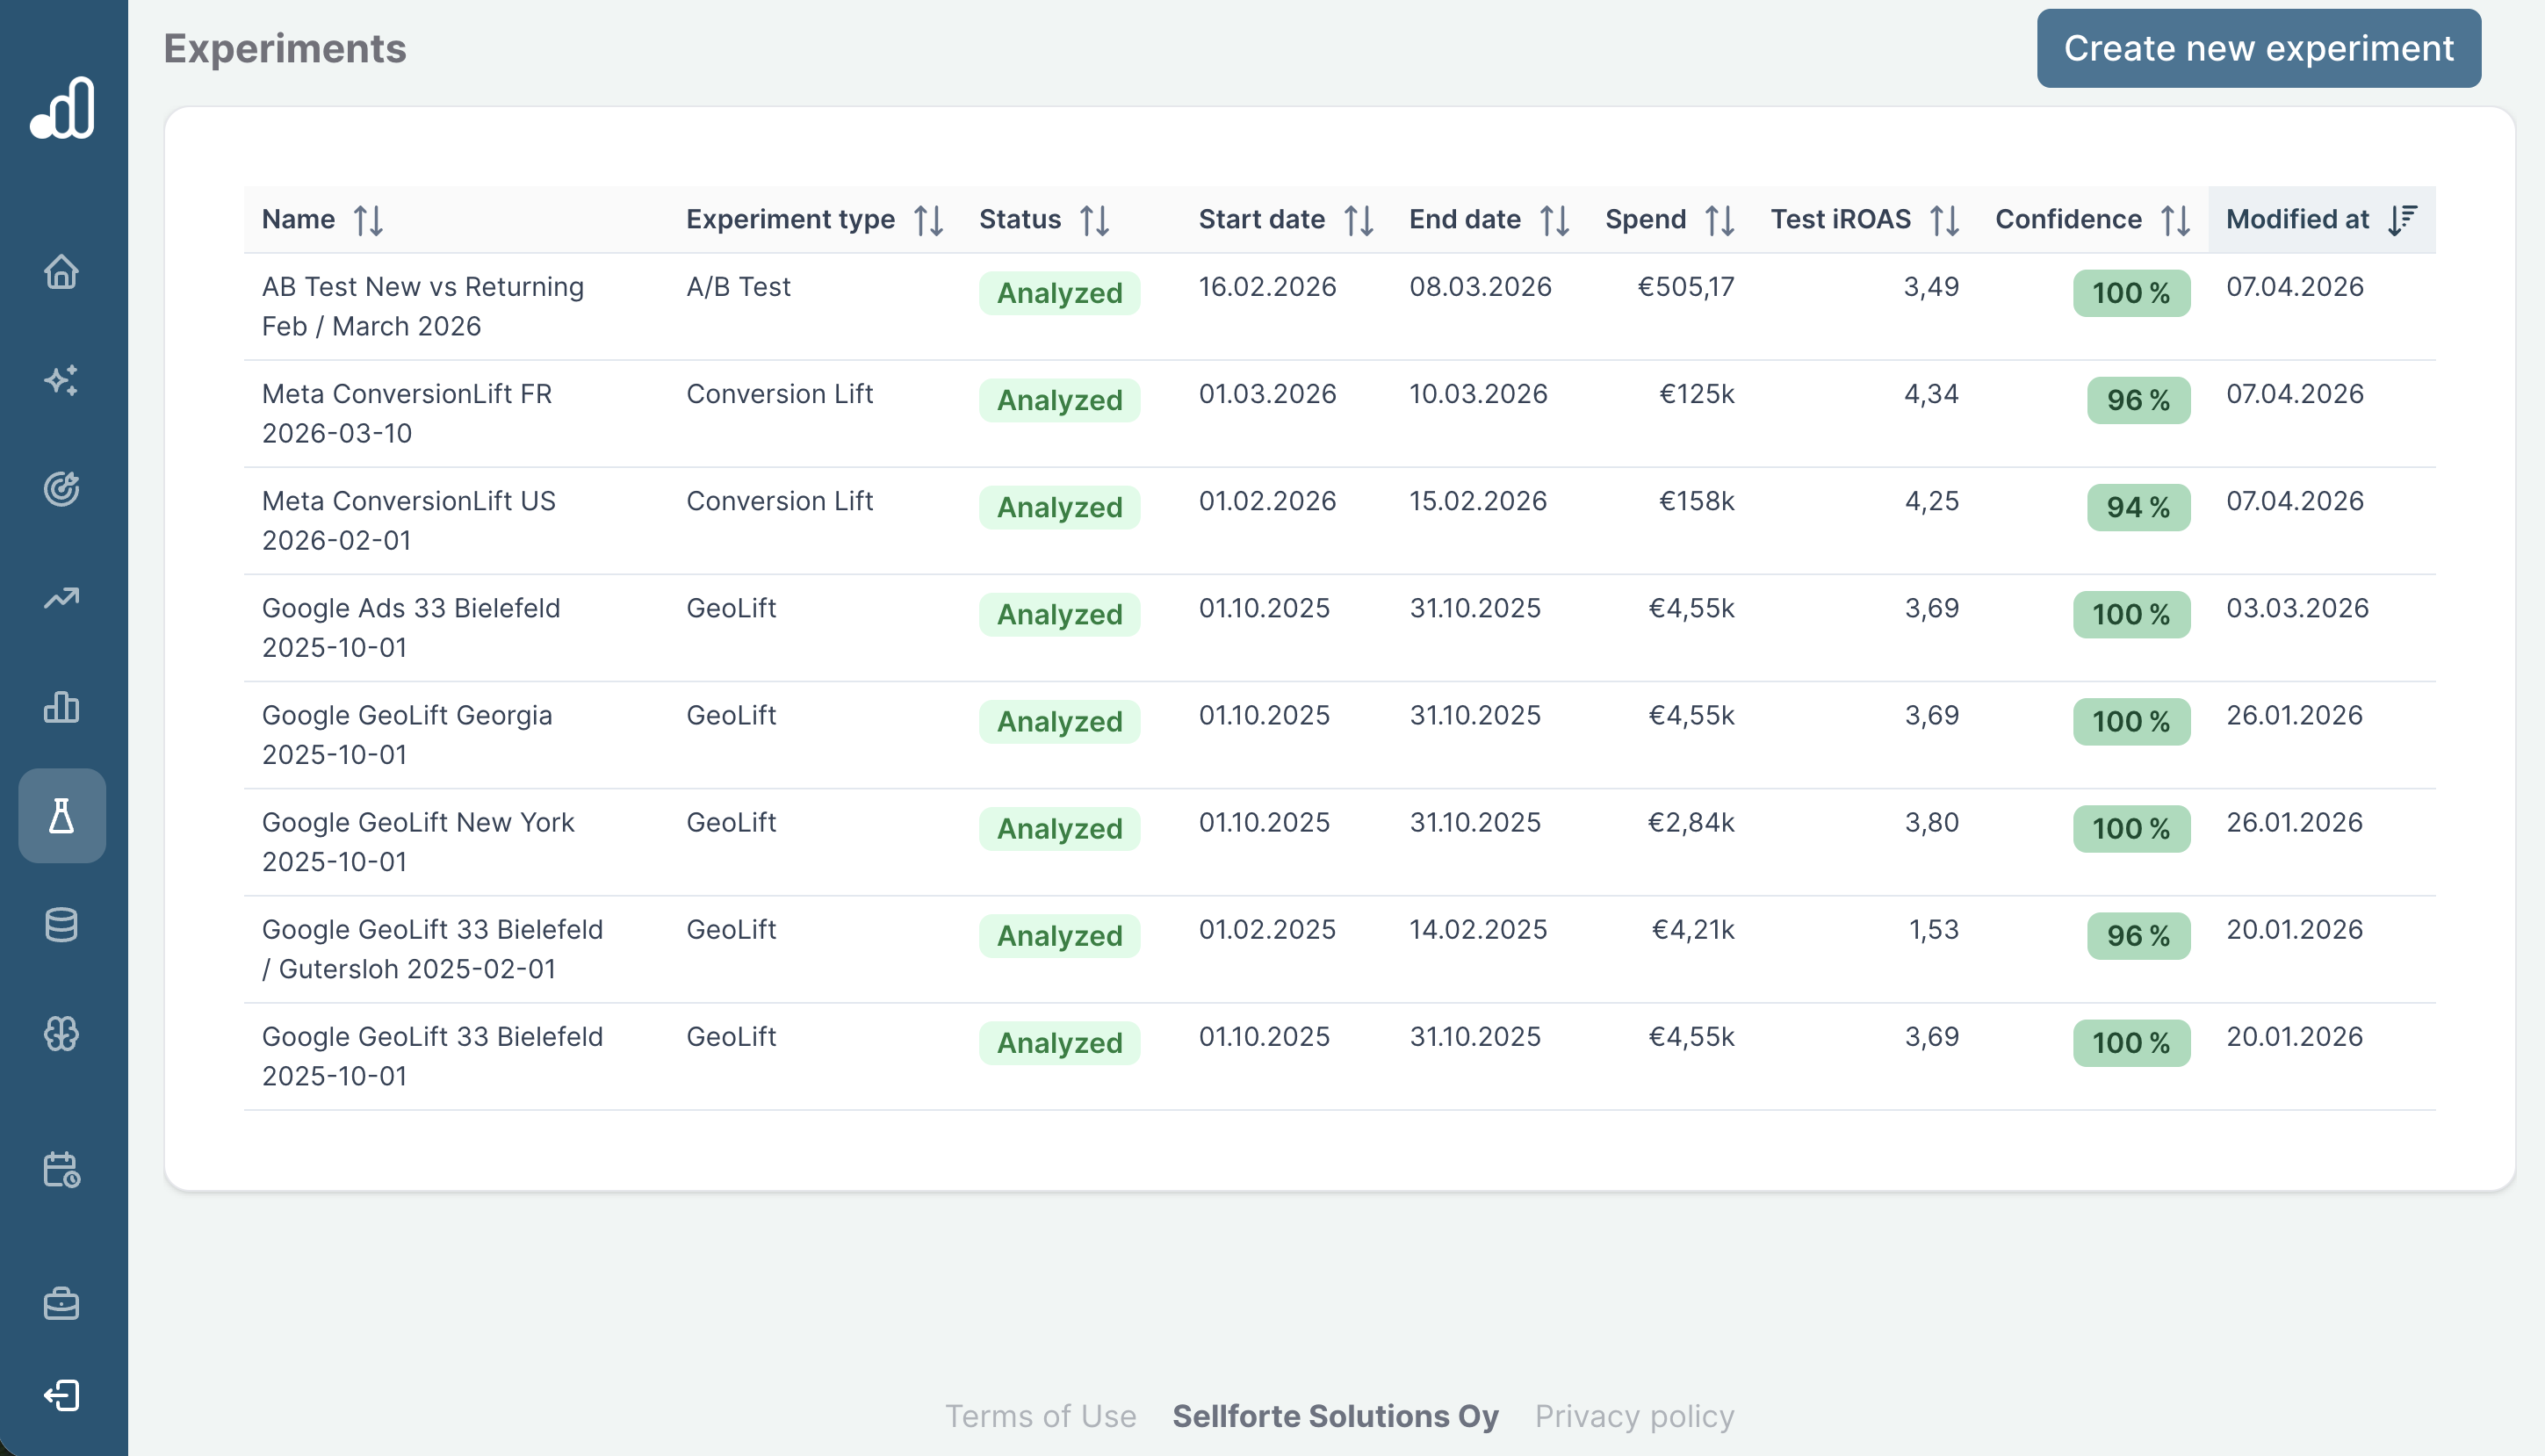
This category assesses whether a platform can store geo tests, owned-media A/B tests, and conversion lift tests in a central library, and whether that library supports filtering and access controls.
A unified library stores every experiment, including geo tests, A/B tests, and conversion lift tests, in one searchable and filterable place. This prevents costly re-runs of tests already completed, makes organizational learning compound over time, and supports governance through role-based access controls. Below is an example screenshot of a unified experiment library covering Geo Tests, Conversion Lift tests and A/B tests.
Category 6. MMM Integration
This category assesses how a tool connects experiment results with MMM calibration. Experiments estimate effects for a particular design and context; MMM calibration uses that evidence with assumptions about how it transfers to the model’s scope.
The criteria distinguish prior-based calibration, an interface for connecting experiment results to MMM, and comparability between experiment-based and attribution-based priors.
Category 7. Enterprise-Grade Platform
This category measures vendors' capabilities to serve large organizations with mature IT policies. The dimensions scored include security certifications (SOC 2, ISO 27001), data residency options between US and EU regions, a choice of at least two cloud providers from AWS, GCP, and Azure, and enterprise authentication via single sign-on.
The relevance of these requirements depends on the buyer’s IT policies, procurement process, and deployment needs. A lower enterprise score does not establish that a tool is unsuitable for every organization.
Research Methodology: Scoring
Claude and ChatGPT separately scored each of the eight tools against 32 criteria. The evaluation log lists the model versions and completion dates. The detailed scoring workbook contains category and criterion-level scores, each model’s original assessments, rationales, and source URLs.
- Score each criterion: each model used the rubric presented in this article, recording a score, rationale, source URL, and source type.
- Average the two model scores: the criterion average is (Claude score + ChatGPT score) / 2. Keep this value unrounded for calculations.
- Calculate category and total scores: sum the unrounded criterion averages within each category, then sum the seven category scores. Every criterion has equal weight; categories with more criteria contribute more points.
- Format the results: tables and chart labels display one decimal. Rankings, ties, color shading, and chart positions use unrounded scores. The eight-tool average includes all eight tools. A normalized category score is its score divided by its maximum, expressed as a percentage.
For example, model scores of 1 and 0.5 produce a criterion average of 0.75, displayed as 0.8. The unrounded 0.75 is used in totals. This explains the quarter-point averages in the research and why adding displayed rounded values may not reproduce a displayed total.
Why is the scoring done by Claude and ChatGPT?
Simulating evaluation a buyer might make based on public materials. By using only vendor-provided materials on their website and technical documentation in the assessment, Claude and ChatGPT -based evaluation simulates how a buyer without prior knowledge of the vendor might assess the vendor prior to a sales call or demo meeting.
Transparent methodology and reproducible assessment. Because the evaluation instructions are published alongside this article, any reader can re-run the evaluation for any vendor and verify or challenge the results. This is a higher standard of transparency than conventional analyst-style research, where the scoring rationale is typically not disclosed.
Equal treatment of vendors. Claude and ChatGPT apply the same instructions, the same criteria, the same scoring scale, and the same source prioritization rules to every vendor in the comparison.
Instructions given to Claude and ChatGPT
The following instructions reproduce the evaluation workbook used for the September assessment.
| ID | Instruction |
|---|---|
| 1 | You are an independent evaluator of Incrementality Testing Tools. |
| 2 | Use evaluation criteria from sheet "Criteria". |
| 3 | In the evaluation, only use information available at the company website, and in the domain where technical documentation is located (if separately hosted). |
| 4 | Prioritize type of source materials in this order 1. Technical documentation (such as support center) 2. Product page 3. Marketing collateral (such as product launch blog posts) |
| 5 | Use scoring model from sheet "Scoring". |
| 6 | When interpreting terminology, you can assume that - ROI is the same thing as incremental ROAS or iROAS - Marginal ROI is the same thing as Marginal Incremental ROAS or miROAS - Diminishing return curves are the same thing as response curves |
| 7 | As an output, provide your evaluation in an excel file, using these columns: - Category ID - Category - Criteria ID - Criteria - Criteria Score - Two-sentence rationale for the score. If you found no evidence, comment that you did not find evidence, instead of claiming that the capability does not exist - URL to source - Type of source (Technical doc, Product page, Marketing collateral) |
Scoring model
The same three-level rubric applied to all 32 criteria. All 512 individual scores in the current research records use one of these values; 0.25 and 0.75 arise only after averaging the two models.
| Score | Definition |
|---|---|
| 1.0 | Strong evidence that the platform supports the capability |
| 0.5 | Partial evidence that the platform supports the capability |
| 0.0 | No evidence found that the platform supports the capability |
A score of zero means no public evidence was found under this methodology. It does not confirm that a capability is absent. Partial credit reflects the models’ interpretation of the evidence against the full criterion.
Source material and terminology
The instructions restrict evidence to the vendor’s website and separately hosted technical documentation. Technical documentation has first priority, product pages second, and marketing collateral third. Source restrictions support comparison under common rules, but they may exclude relevant evidence available privately or through other channels.
Instruction 6 permits specified terminology equivalences when interpreting vendor materials. These are rules for this evaluation, not a claim that ROI and iROAS are interchangeable in every business context. Buyers should confirm the numerator, cost basis, time window, and uncertainty behind any metric used in a decision.
How to reproduce the evaluation and scoring yourself with Claude or ChatGPT?
To reproduce the evaluation for any vendor in this study, you can follow the instructions in this section. They are accurate as of 9th September 2026. Reproducibility instructions may require updating as model versions change.
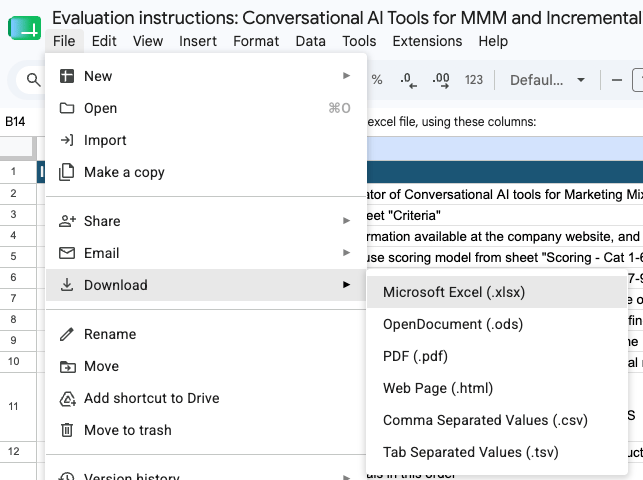
Step 1. Download the Evaluation Instructions Google Sheet as an Excel file (or other file format you can attach to an LLM prompt): Evaluation instructions.
Step 2. Open Claude in Incognito mode to disconnect its memory about your previous conversations that might influence the evaluation. To achieve the same in ChatGPT, you need to disable ChatGPT memory.

Step 3. Choose a model. See specific LLM-model versions we used in the evaluation log. 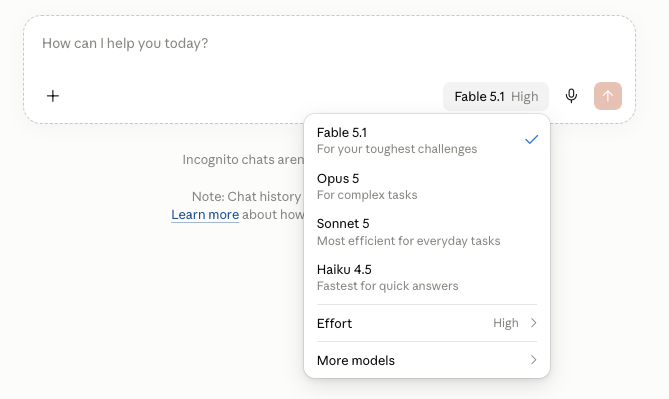
Step 4. Initiate the prompt: "Evaluate [add vendor name, e.g., Sellforte], based on the instructions in the attached Excel."
Repeating the instructions may produce different results because models, search results, public documentation, and interpretation can change. The published scores are a dated research snapshot.
What biases & limitations does our scoring approach have, and how are we addressing them?
While LLM-based evaluation reduces vendor bias and promotes equal treatment of vendors and reproducibility, there are four main limitations to be aware of.
1. Availability and of documentation that each vendor has made public. A vendor with extensive and detailed public documentation will naturally score higher than one that keeps product details behind a sales call gate, even if the underlying capabilities are comparable. Each vendor can affect their own scoring through public documentation.
2. LLMs' ability to find public documentation. Even with web search enabled, Claude and ChatGPT may not find every relevant page on a vendor's website. Documentation that is not well-indexed or that sits in obscure subdomains may be missed. We tried to address this by using advanced models from two separate LLMs, and added a specific point to the instructions to search for vendor-provided technical documentation that might sometimes be under a different sub-domain.
3. LLMs' ability to interpret public documentation against the scoring criteria. Matching a product description to a specific criterion requires judgment. We reduce interpretation variance by using advanced models from two separate LLMs, providing detailed criterion descriptions, and providing explicit terminology equivalences. However, edge cases may still exist.
4. Limitations of LLM technology, including hallucinations. LLMs are known to occasionally assert things that are not based on facts. To reduce this risk, we used advanced models from two separate LLMs, asked them to provide source URL for their assessment, and asked them to provide a rationale for the score in each criterion.
Which Incrementality Testing Tools Were Evaluated?
The September 2026 comparison covers seven commercial tools offering incrementality testing within a dedicated product or a broader measurement platform, plus one open-source library. The selection is not an exhaustive list of the market.
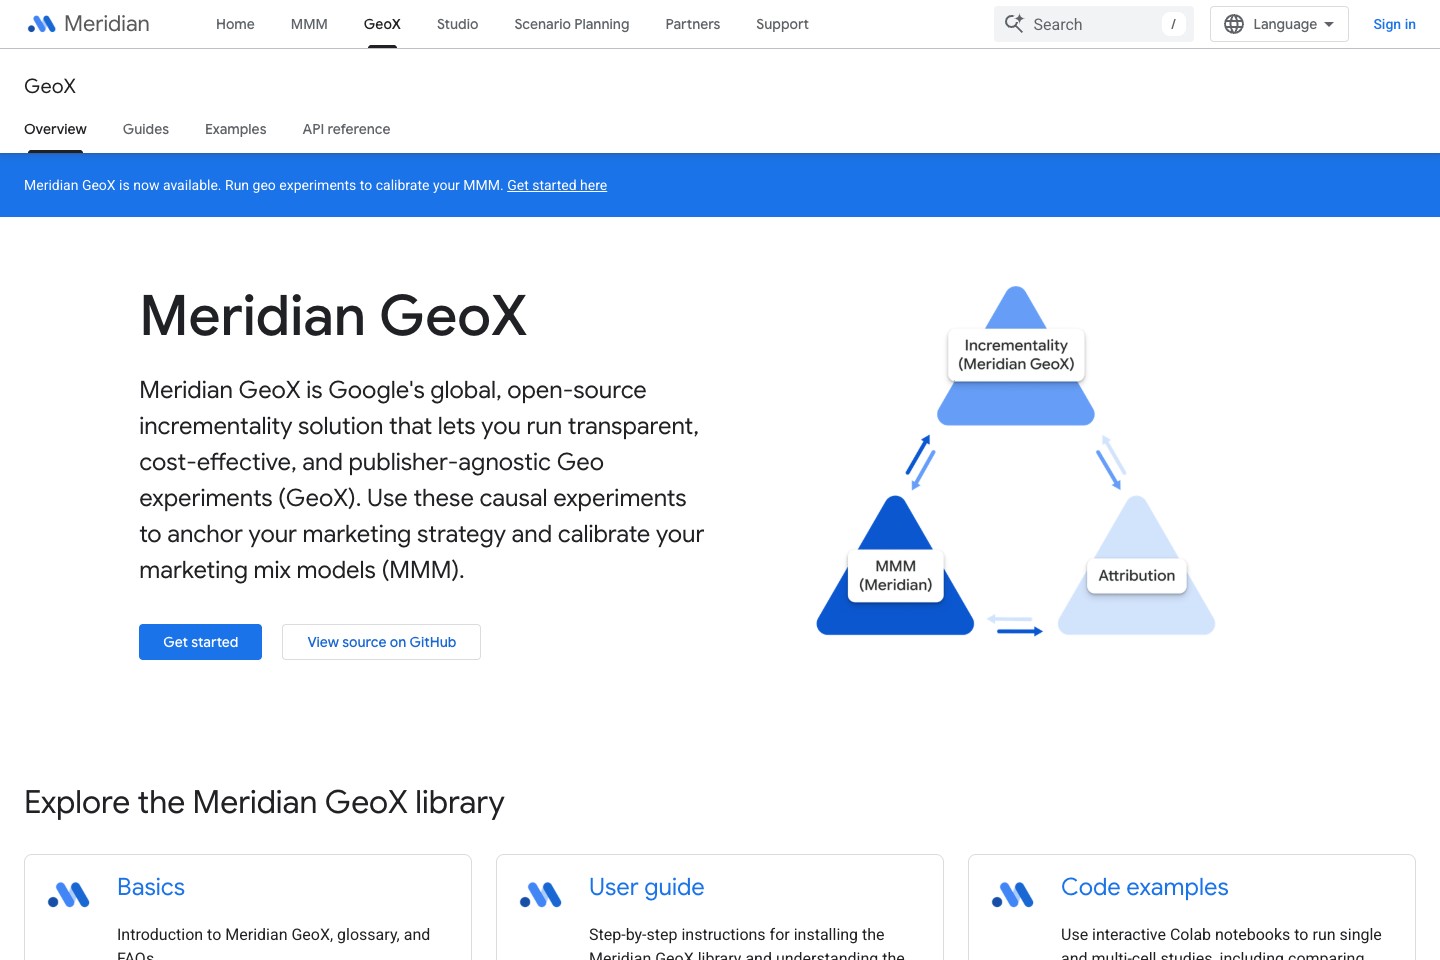
Google describes Meridian GeoX as an open-source geo-experiment solution. It is included to represent an option for teams building their own measurement workflows. Its narrower scope differs from the commercial platforms, particularly on hosted interfaces, experiment-library features, and enterprise controls.
All eight tools were assessed against the same 32 criteria. Inclusion does not establish that every tool covers all three test types or satisfies the enterprise requirements.
In-depth Comparison of Incrementality Testing Tools and Vendors
The charts and category-specific tables below break the evaluation into the total research score and seven evaluated categories. The comparison covers seven commercial tools and one open-source library, Meridian GeoX. Results use the latest Claude and ChatGPT evaluations, completed on September 8–9, 2026. See the evaluation and scoring methodology for the criteria and evidence standards, and the detailed scoring workbook for the underlying evaluations.
How to interpret this comparison: Sellforte designed and published this evaluation and is one of the vendors evaluated. Scores reflect the public evidence Claude and ChatGPT identified against predefined criteria; this was not a hands-on product test. A score of zero means no public evidence was found under the methodology, not that a capability is absent. Buyers should verify current capabilities directly with vendors.
Total research score across all 32 criteria
Average of Claude and ChatGPT scores from evaluations completed September 8–9, 2026. Bars and rankings use unrounded scores; labels are rounded to one decimal.
What we evaluated. The total research score combines 32 criteria across seven categories: geo test analysis, A/B test analysis for owned media, conversion lift test analysis, experiment recommendations and insights, a unified experiment library, MMM integration, and enterprise-grade platform capabilities.
What the research found. Within this evaluation, the scores from highest to lowest were Sellforte (25.0 / 32), Lifesight (18.0 / 32), Measured (15.0 / 32), Haus (13.3 / 32), Recast (12.3 / 32), LiftLab (12.0 / 32), Analytic Partners (8.5 / 32), and Meridian GeoX (5.8 / 32). Sellforte received the highest assigned score in six categories. Haus led experiment recommendations and insights, where Lifesight and Measured tied for second. Lifesight and LiftLab tied for second in enterprise-grade platform capabilities. The total ranking combines these different patterns, so a buyer focused on one workflow may find the category-level results more relevant than the overall score. Small differences and ties should be interpreted using the unrounded scores, since displayed figures are rounded to one decimal.
| Evaluated category | Sellforte | Lifesight | Measured | Haus | Recast | LiftLab | Analytic Partners | Meridian GeoX | Max |
|---|---|---|---|---|---|---|---|---|---|
| 1. Geo Test Analysis | 4.0 | 3.8 | 3.5 | 3.3 | 2.8 | 2.0 | 1.8 | 1.5 | 6 |
| 2. A/B Test Analysis for Owned Media | 3.5 | 0.5 | 0.8 | 0.5 | 0.8 | 0.0 | 1.0 | 0.0 | 4 |
| 3. Conversion Lift Test Analysis | 4.5 | 1.3 | 0.0 | 0.5 | 1.5 | 0.5 | 0.0 | 0.0 | 5 |
| 4. Experiment Recommendations & Insights | 3.3 | 4.8 | 4.8 | 5.5 | 3.3 | 3.8 | 2.5 | 3.0 | 6 |
| 5. Unified Experiment Library | 2.0 | 1.8 | 1.0 | 0.5 | 0.8 | 1.0 | 0.8 | 0.0 | 3 |
| 6. MMM Integration | 3.0 | 2.3 | 2.3 | 1.0 | 1.3 | 1.0 | 0.8 | 1.3 | 3 |
| 7. Enterprise-Grade Platform | 4.8 | 3.8 | 2.8 | 2.0 | 2.0 | 3.8 | 1.8 | 0.0 | 5 |
| Total score out of 32 | 25.0 | 18.0 | 15.0 | 13.3 | 12.3 | 12.0 | 8.5 | 5.8 | 32 |
1. Geo Test Analysis
Average of Claude and ChatGPT scores from evaluations completed September 8–9, 2026. Bars and rankings use unrounded scores; labels are rounded to one decimal.
What we evaluated. This category examines six criteria covering geo-test analysis with a synthetic control method, incremental return on ad spend (iROAS) and confidence intervals, a self-serve results interface, a media-spend counterfactual, configurable post-test measurement windows, test launching, and automatic detection of geo tests from media and sales data.
What the research found. Within this evaluation, the scores from highest to lowest were Sellforte (4.0 / 6), Lifesight (3.8 / 6), Measured (3.5 / 6), Haus (3.3 / 6), Recast (2.8 / 6), LiftLab (2.0 / 6), Analytic Partners (1.8 / 6), and Meridian GeoX (1.5 / 6). Six tools received full credit for the synthetic-control analysis criterion, and six received full credit for a self-serve results interface. Scores were lower for estimating a media-spend counterfactual and configuring post-test measurement windows. Lifesight and Measured received full credit for launching tests from the platform. Automatic test detection received the least evidence credit: seven tools scored zero, while Sellforte received partial credit. The results distinguish evidence for established analysis workflows from evidence for automating the wider testing process.
| Evaluated criterion | Sellforte | Lifesight | Measured | Haus | Recast | LiftLab | Analytic Partners | Meridian GeoX | Average |
|---|---|---|---|---|---|---|---|---|---|
| 1.1 Analyzes geo tests with synthetic control method, providing iROAS and confidence interval | 1.0 | 1.0 | 1.0 | 1.0 | 1.0 | 1.0 | 0.5 | 0.5 | 0.9 |
| 1.2 Self-serve UI for analyzing & reviewing geo test results | 1.0 | 1.0 | 1.0 | 1.0 | 1.0 | 0.5 | 1.0 | 0.0 | 0.8 |
| 1.3 Estimates media counterfactual for lost/incremental spend | 1.0 | 0.3 | 0.0 | 0.0 | 0.3 | 0.3 | 0.0 | 0.5 | 0.3 |
| 1.4 Configurable default post-test treatment / measurement window | 0.5 | 0.5 | 0.5 | 0.5 | 0.5 | 0.0 | 0.0 | 0.5 | 0.4 |
| 1.5 User can launch geo tests from the platform | 0.3 | 1.0 | 1.0 | 0.8 | 0.0 | 0.3 | 0.3 | 0.0 | 0.4 |
| 1.6 Automatically detects geo tests from media and sales data | 0.3 | 0.0 | 0.0 | 0.0 | 0.0 | 0.0 | 0.0 | 0.0 | 0.0 |
| Category total out of 6 | 4.0 | 3.8 | 3.5 | 3.3 | 2.8 | 2.0 | 1.8 | 1.5 | 2.8 |
2. A/B Test Analysis for Owned Media
Average of Claude and ChatGPT scores from evaluations completed September 8–9, 2026. Bars and rankings use unrounded scores; labels are rounded to one decimal.
What we evaluated. This category examines four criteria for owned-media A/B tests, such as catalog or email tests: analysis that reports iROAS and confidence intervals, a self-serve interface for reviewing results, a media counterfactual, and a configurable post-test treatment or measurement window.
What the research found. Within this evaluation, the scores from highest to lowest were Sellforte (3.5 / 4), Analytic Partners (1.0 / 4), Measured (0.8 / 4), Recast (0.8 / 4), Lifesight (0.5 / 4), Haus (0.5 / 4), LiftLab (0.0 / 4), and Meridian GeoX (0.0 / 4). Sellforte received full credit for analysis, the results interface, and the media-counterfactual criterion, plus partial credit for a configurable post-test window. Analytic Partners received partial credit for the first two criteria, giving it the second-highest category score. The remaining tools scored 0.8 or less. Only Sellforte received nonzero scores for the counterfactual and post-test-window criteria. This category therefore showed a larger gap in documented workflow coverage than the geo-test category.
| Evaluated criterion | Sellforte | Lifesight | Measured | Haus | Recast | LiftLab | Analytic Partners | Meridian GeoX | Average |
|---|---|---|---|---|---|---|---|---|---|
| 2.1 Analyzes own media A/B tests (such as catalog or email tests), providing iROAS and confidence interval | 1.0 | 0.3 | 0.5 | 0.3 | 0.5 | 0.0 | 0.5 | 0.0 | 0.4 |
| 2.2 Self-serve UI for analyzing & reviewing own media A/B test (such as catalog or email tests) results | 1.0 | 0.3 | 0.3 | 0.3 | 0.3 | 0.0 | 0.5 | 0.0 | 0.3 |
| 2.3 Estimates media counterfactual for own media A/B (such as catalog or email tests) tests | 1.0 | 0.0 | 0.0 | 0.0 | 0.0 | 0.0 | 0.0 | 0.0 | 0.1 |
| 2.4 Configurable default post-test treatment / measurement window for own A/B tests (such as catalog or email tests) | 0.5 | 0.0 | 0.0 | 0.0 | 0.0 | 0.0 | 0.0 | 0.0 | 0.1 |
| Category total out of 4 | 3.5 | 0.5 | 0.8 | 0.5 | 0.8 | 0.0 | 1.0 | 0.0 | 0.9 |
3. Conversion Lift Test Analysis
Average of Claude and ChatGPT scores from evaluations completed September 8–9, 2026. Bars and rankings use unrounded scores; labels are rounded to one decimal.
What we evaluated. This category examines five criteria covering ingestion of platform-run conversion lift results, such as Meta Conversion Lift, with iROAS and confidence intervals; a self-serve dashboard; direct API ingestion; comparison with campaign and ad set-level ad-platform data; and daily snapshots of test progress.
What the research found. Within this evaluation, the scores from highest to lowest were Sellforte (4.5 / 5), Recast (1.5 / 5), Lifesight (1.3 / 5), Haus (0.5 / 5), LiftLab (0.5 / 5), Measured (0.0 / 5), Analytic Partners (0.0 / 5), and Meridian GeoX (0.0 / 5). Sellforte received full credit for results ingestion, the analysis dashboard, API connectors, and daily progress snapshots, with partial credit for comparability to campaign and ad set-level ad-platform data. Recast received partial credit for ingestion and the dashboard, producing the second-highest total. Only Sellforte received nonzero scores for direct API ingestion and daily snapshots. Lifesight and Sellforte both received partial credit for comparison with ad-platform data. Across the eight tools, this was the lowest-scoring category as a proportion of available points.
| Evaluated criterion | Sellforte | Lifesight | Measured | Haus | Recast | LiftLab | Analytic Partners | Meridian GeoX | Average |
|---|---|---|---|---|---|---|---|---|---|
| 3.1 Ingests Conversion Lift test (e.g. Meta Conversion Lift) results, providing iROAS and confidence interval through the platform | 1.0 | 0.5 | 0.0 | 0.5 | 0.8 | 0.5 | 0.0 | 0.0 | 0.4 |
| 3.2 Self-serve UI dashboard for analyzing Conversion Lift test (e.g. Meta Conversion Lift) results | 1.0 | 0.3 | 0.0 | 0.0 | 0.8 | 0.0 | 0.0 | 0.0 | 0.3 |
| 3.3 API connectors that can ingest Conversion Lift test results directly from the platform (instead of manual uploads) | 1.0 | 0.0 | 0.0 | 0.0 | 0.0 | 0.0 | 0.0 | 0.0 | 0.1 |
| 3.4 Conversion Lift test results made comparable to ad platform data on campaign and ad set level | 0.5 | 0.5 | 0.0 | 0.0 | 0.0 | 0.0 | 0.0 | 0.0 | 0.1 |
| 3.5 Daily snapshot of Conversion Lift Test progress, including iROAS and confidence interval | 1.0 | 0.0 | 0.0 | 0.0 | 0.0 | 0.0 | 0.0 | 0.0 | 0.1 |
| Category total out of 5 | 4.5 | 1.3 | 0.0 | 0.5 | 1.5 | 0.5 | 0.0 | 0.0 | 1.0 |
4. Experiment Recommendations & Insights
Average of Claude and ChatGPT scores from evaluations completed September 8–9, 2026. Bars and rankings use unrounded scores; labels are rounded to one decimal.
What we evaluated. This category examines six criteria covering recommendations about what to test, control and test groups, and test design with success prediction. It also evaluates AI-generated plain-language summaries, conversational AI for discussing experiments, and Model Context Protocol (MCP) access to experiment results.
What the research found. Within this evaluation, the scores from highest to lowest were Haus (5.5 / 6), Lifesight (4.8 / 6), Measured (4.8 / 6), LiftLab (3.8 / 6), Sellforte (3.3 / 6), Recast (3.3 / 6), Meridian GeoX (3.0 / 6), and Analytic Partners (2.5 / 6). Haus received full credit for the first five criteria and partial credit for MCP access, placing it first in this category. Lifesight and Measured tied for second. Seven tools received full credit for recommending control and test groups; Sellforte scored zero on that criterion and received partial credit for test design and success prediction. Sellforte and Measured received full credit for MCP access. These results show different strengths in experiment planning, AI interpretation, and access to results. This category had the highest normalized average across the eight tools.
| Evaluated criterion | Sellforte | Lifesight | Measured | Haus | Recast | LiftLab | Analytic Partners | Meridian GeoX | Average |
|---|---|---|---|---|---|---|---|---|---|
| 4.1 Platform recommends what to test next | 0.5 | 1.0 | 1.0 | 1.0 | 0.5 | 1.0 | 0.5 | 1.0 | 0.8 |
| 4.2 Platform recommends control & test groups | 0.0 | 1.0 | 1.0 | 1.0 | 1.0 | 1.0 | 1.0 | 1.0 | 0.9 |
| 4.3 Platform recommends test design and predicts test success | 0.3 | 1.0 | 1.0 | 1.0 | 1.0 | 0.8 | 1.0 | 1.0 | 0.9 |
| 4.4 AI-generated plain-language summaries | 1.0 | 0.5 | 0.8 | 1.0 | 0.0 | 0.5 | 0.0 | 0.0 | 0.5 |
| 4.5 Conversational AI for discussing experiments | 0.5 | 0.5 | 0.0 | 1.0 | 0.0 | 0.5 | 0.0 | 0.0 | 0.3 |
| 4.6 MCP that can access experiment results | 1.0 | 0.8 | 1.0 | 0.5 | 0.8 | 0.0 | 0.0 | 0.0 | 0.5 |
| Category total out of 6 | 3.3 | 4.8 | 4.8 | 5.5 | 3.3 | 3.8 | 2.5 | 3.0 | 3.8 |
5. Unified Experiment Library
Average of Claude and ChatGPT scores from evaluations completed September 8–9, 2026. Bars and rankings use unrounded scores; labels are rounded to one decimal.
What we evaluated. This category examines three criteria: a central library covering geo experiments, owned-media A/B tests, and conversion lift tests; filtering by dimensions such as channel and platform; and role-based access and governance for the experiment library.
What the research found. Within this evaluation, the scores from highest to lowest were Sellforte (2.0 / 3), Lifesight (1.8 / 3), Measured (1.0 / 3), LiftLab (1.0 / 3), Recast (0.8 / 3), Analytic Partners (0.8 / 3), Haus (0.5 / 3), and Meridian GeoX (0.0 / 3). Sellforte received full credit for a library covering all three test types and partial credit for filtering and governance. Lifesight received full credit for library governance, partial credit for test-type coverage, and limited credit for filtering. No tool received full credit for filtering. Six tools received partial credit for the central-library criterion, while Meridian GeoX scored zero. The category scores separate evidence for storing experiments from evidence for a broadly usable, governed library.
| Evaluated criterion | Sellforte | Lifesight | Measured | Haus | Recast | LiftLab | Analytic Partners | Meridian GeoX | Average |
|---|---|---|---|---|---|---|---|---|---|
| 5.1 Central library that covers geo experiments, A/B tests for own media and Conversion Lift tests | 1.0 | 0.5 | 0.5 | 0.5 | 0.5 | 0.5 | 0.5 | 0.0 | 0.5 |
| 5.2 Library is filterable, for example by channel and platform | 0.5 | 0.3 | 0.0 | 0.0 | 0.0 | 0.0 | 0.0 | 0.0 | 0.1 |
| 5.3 Role-based access & governance for the experiment library | 0.5 | 1.0 | 0.5 | 0.0 | 0.3 | 0.5 | 0.3 | 0.0 | 0.4 |
| Category total out of 3 | 2.0 | 1.8 | 1.0 | 0.5 | 0.8 | 1.0 | 0.8 | 0.0 | 1.0 |
6. MMM Integration
Average of Claude and ChatGPT scores from evaluations completed September 8–9, 2026. Bars and rankings use unrounded scores; labels are rounded to one decimal.
What we evaluated. This category examines three criteria covering an MMM with user-controlled, prior-based calibration; a user interface connecting experiment results to MMM; and experiment-based priors that are comparable to attribution-based priors.
What the research found. Within this evaluation, the scores from highest to lowest were Sellforte (3.0 / 3), Lifesight (2.3 / 3), Measured (2.3 / 3), Recast (1.3 / 3), Meridian GeoX (1.3 / 3), Haus (1.0 / 3), LiftLab (1.0 / 3), and Analytic Partners (0.8 / 3). Sellforte received full credit on all three criteria. Lifesight and Measured both received full credit for user-controlled prior calibration and the interface connecting experiments to MMM, with partial credit for comparability between experiment-based and attribution-based priors. Meridian GeoX also received full credit for prior-based calibration, but less credit for the interface and comparability criteria. The largest separation was in making experiment-based and attribution-based priors comparable: only Sellforte received full credit, Lifesight and Measured received partial credit, and the other five tools scored zero.
| Evaluated criterion | Sellforte | Lifesight | Measured | Haus | Recast | LiftLab | Analytic Partners | Meridian GeoX | Average |
|---|---|---|---|---|---|---|---|---|---|
| 6.1 Has MMM that includes prior-based calibration by the user | 1.0 | 1.0 | 1.0 | 0.5 | 0.8 | 0.5 | 0.3 | 1.0 | 0.8 |
| 6.2 UI to connect experiment results to MMM | 1.0 | 1.0 | 1.0 | 0.5 | 0.5 | 0.5 | 0.5 | 0.3 | 0.7 |
| 6.3 Experiment-based priors comparable to attribution-based priors | 1.0 | 0.3 | 0.3 | 0.0 | 0.0 | 0.0 | 0.0 | 0.0 | 0.2 |
| Category total out of 3 | 3.0 | 2.3 | 2.3 | 1.0 | 1.3 | 1.0 | 0.8 | 1.3 | 1.6 |
7. Enterprise-Grade Platform
Average of Claude and ChatGPT scores from evaluations completed September 8–9, 2026. Bars and rankings use unrounded scores; labels are rounded to one decimal.
What we evaluated. This category examines five criteria covering at least ten public reference customers from brands with more than $1 billion in revenue, independent security assurance, US and EU data-residency options, a dual-cloud option across AWS, GCP, and Azure, and enterprise single sign-on (SSO). These criteria assess the broader platform rather than a specific experiment-analysis method.
What the research found. Within this evaluation, the scores from highest to lowest were Sellforte (4.8 / 5), Lifesight (3.8 / 5), LiftLab (3.8 / 5), Measured (2.8 / 5), Haus (2.0 / 5), Recast (2.0 / 5), Analytic Partners (1.8 / 5), and Meridian GeoX (0.0 / 5). All seven commercial tools received full credit for independently audited security, while none received full credit for the enterprise-reference threshold. Sellforte and Lifesight received full credit for US and EU data-residency options. Sellforte received full credit for the dual-cloud criterion and LiftLab received partial credit. Sellforte, Lifesight, and LiftLab received full credit for SSO. Meridian GeoX scored zero across this category; as an open-source library, it is being assessed against the same hosted-platform requirements, so these scores should not be read as a judgment of its underlying statistical methods.
| Evaluated criterion | Sellforte | Lifesight | Measured | Haus | Recast | LiftLab | Analytic Partners | Meridian GeoX | Average |
|---|---|---|---|---|---|---|---|---|---|
| 7.1 At least 10 public reference customers from $1B+ revenue brands | 0.8 | 0.8 | 0.8 | 0.8 | 0.5 | 0.8 | 0.8 | 0.0 | 0.6 |
| 7.2 SOC 2, ISO 27001, or audited IT security by a third-party cyber security auditor | 1.0 | 1.0 | 1.0 | 1.0 | 1.0 | 1.0 | 1.0 | 0.0 | 0.9 |
| 7.3 Data residency: US and EU options | 1.0 | 1.0 | 0.3 | 0.0 | 0.0 | 0.5 | 0.0 | 0.0 | 0.3 |
| 7.4 Dual-cloud option between AWS, GCP, and Azure | 1.0 | 0.0 | 0.0 | 0.0 | 0.0 | 0.5 | 0.0 | 0.0 | 0.2 |
| 7.5 Single sign-on (SSO) for enterprises | 1.0 | 1.0 | 0.8 | 0.3 | 0.5 | 1.0 | 0.0 | 0.0 | 0.6 |
| Category total out of 5 | 4.8 | 3.8 | 2.8 | 2.0 | 2.0 | 3.8 | 1.8 | 0.0 | 2.6 |
What this evaluation suggests about the market
Average of Claude and ChatGPT scores from evaluations completed September 8–9, 2026. Bars and rankings use unrounded scores; labels are rounded to one decimal.
Across the eight evaluated tools, the strongest normalized category averages were experiment recommendations and insights (64.1%), MMM integration (53.1%), and enterprise-grade platform capabilities (51.9%). Geo test analysis averaged 46.9%. The criterion-level results suggest that public evidence was more consistent for test-planning recommendations, prior-based MMM calibration, and independent security assurance than for several of the more specialized analysis and integration workflows.
The lowest normalized averages were conversion lift test analysis (20.6%), A/B test analysis for owned media (21.9%), and a unified experiment library (32.3%). These results highlight areas where buyers should ask for demonstrations of their exact workflow, including result ingestion, counterfactual calculations, post-test windows, library filtering, and access controls. Low scores may reflect limited public documentation as well as differences in product scope.
Summary by vendor
The profiles below summarize the scores assigned by Claude and ChatGPT in the September 8–9, 2026 evaluations. Each scorecard compares a tool with the average and highest scores across all eight tools. The assessment covers public evidence against 32 criteria, rather than hands-on product testing.
1. Sellforte (research score: 25.0 out of 32)
Research overview
Sellforte received an average research score of 25.0 out of 32, the highest total in this eight-tool comparison. Claude and ChatGPT each assessed its public documentation on September 8, 2026, across 32 criteria in seven categories.
Sellforte is best for advertisers looking for a full-scale enterprise-grade incrementality testing platform that covers all incrementality test types and collects them into a unified experiment library that is integrated into an MMM. Sellforte is particularly strong in retail and ecommerce.
Category scorecard
| Category | Sellforte | Average research score | Highest research score |
|---|---|---|---|
| 1. Geo Test Analysis | 4.0 / 6 | 2.8 / 6 | 4.0 / 6 |
| 2. A/B Test Analysis for Owned Media | 3.5 / 4 | 0.9 / 4 | 3.5 / 4 |
| 3. Conversion Lift Test Analysis | 4.5 / 5 | 1.0 / 5 | 4.5 / 5 |
| 4. Experiment Recommendations & Insights | 3.3 / 6 | 3.8 / 6 | 5.5 / 6 |
| 5. Unified Experiment Library | 2.0 / 3 | 1.0 / 3 | 2.0 / 3 |
| 6. MMM Integration | 3.0 / 3 | 1.6 / 3 | 3.0 / 3 |
| 7. Enterprise-Grade Platform | 4.8 / 5 | 2.6 / 5 | 4.8 / 5 |
| Total score out of 32 | 25.0 / 32 | 13.7 / 32 | 25.0 / 32 |
Categories contain different numbers of criteria. The higher- and lower-scoring groups below describe Sellforte’s own score profile as a share of available points. A lower score within that profile can still be above the eight-tool average. See the scoring methodology for how to interpret the results.
Percentage of available points
Bars show the tool’s average Claude and ChatGPT score as a percentage of the category maximum. Markers show the average and highest scores across all eight tools. Positions use unrounded scores; labels show points rounded to one decimal.
Where Claude and ChatGPT assigned higher scores
-
MMM Integration — 3.0 / 3. Its assigned score was above the eight-tool average of 1.6 / 3. Sellforte had the highest score among the eight tools in this category. As examples, Sellforte received credit for these criteria: “Has MMM that includes prior-based calibration by the user”; “UI to connect experiment results to MMM”; “Experiment-based priors comparable to attribution-based priors”.
-
Enterprise-Grade Platform — 4.8 / 5. Its assigned score was above the eight-tool average of 2.6 / 5. Sellforte had the highest score among the eight tools in this category. As examples, Sellforte received credit for these criteria: “SOC 2, ISO 27001, or audited IT security by a third-party cyber security auditor”; “Data residency: US and EU options”; “Dual-cloud option between AWS, GCP, and Azure”.
-
Conversion Lift Test Analysis — 4.5 / 5. Its assigned score was above the eight-tool average of 1.0 / 5. Sellforte had the highest score among the eight tools in this category. As examples, Sellforte received credit for these criteria: “API connectors that can ingest Conversion Lift test results directly from the platform (instead of manual uploads)”; “Daily snapshot of Conversion Lift Test progress, including iROAS and confidence interval”; “Conversion Lift test results made comparable to ad platform data on campaign and ad set level”.
Where scores were lower
-
Experiment Recommendations & Insights — 3.3 / 6. Its assigned score was below the eight-tool average of 3.8 / 6.
-
Geo Test Analysis — 4.0 / 6. Despite its relatively lower score in this category, Sellforte still scored above the average across all eight tools (2.8 / 6). Sellforte had the highest score among the eight tools in this category.
-
Unified Experiment Library — 2.0 / 3. Despite its relatively lower score in this category, Sellforte still scored above the average across all eight tools (1.0 / 3). Sellforte had the highest score among the eight tools in this category.
Notable Reference Customers
Sellforte lists following companies as examples of public reference customers:
- Fashion Ecommerce: bonprix, Azzas 2154, Represent, Odlo
- Home & Furniture Ecommerce: Finnish Design Shop
- Specialty Ecommerce: FCP Euro, Smartphoto
- Grocery Retail: Lidl
- Fashion Retail: C&A, KIK
- Cosmetics Retail: Douglas
- Sport Retail: Interpsort
- Pet Retail: Fressnapf, Musti Group
- Specialty Retail: Tchibo
- Electronics Retail: Verkkokauppa.com
- Other segments: Telenor (Telecommunications), Paysafe (Payments), eBilet (part of Allegro Group, Events)
2. Lifesight (research score: 18.0 out of 32)

Research overview
Lifesight received an average research score of 18.0 out of 32, the second-highest total in this eight-tool comparison. Claude and ChatGPT each assessed its public documentation on September 8, 2026, across 32 criteria in seven categories.
Category scorecard
| Category | Lifesight | Average research score | Highest research score |
|---|---|---|---|
| 1. Geo Test Analysis | 3.8 / 6 | 2.8 / 6 | 4.0 / 6 |
| 2. A/B Test Analysis for Owned Media | 0.5 / 4 | 0.9 / 4 | 3.5 / 4 |
| 3. Conversion Lift Test Analysis | 1.3 / 5 | 1.0 / 5 | 4.5 / 5 |
| 4. Experiment Recommendations & Insights | 4.8 / 6 | 3.8 / 6 | 5.5 / 6 |
| 5. Unified Experiment Library | 1.8 / 3 | 1.0 / 3 | 2.0 / 3 |
| 6. MMM Integration | 2.3 / 3 | 1.6 / 3 | 3.0 / 3 |
| 7. Enterprise-Grade Platform | 3.8 / 5 | 2.6 / 5 | 4.8 / 5 |
| Total score out of 32 | 18.0 / 32 | 13.7 / 32 | 25.0 / 32 |
Categories contain different numbers of criteria. The higher- and lower-scoring groups below describe Lifesight’s own score profile as a share of available points. A lower score within that profile can still be above the eight-tool average. See the scoring methodology for how to interpret the results.
Percentage of available points
Bars show the tool’s average Claude and ChatGPT score as a percentage of the category maximum. Markers show the average and highest scores across all eight tools. Positions use unrounded scores; labels show points rounded to one decimal.
Where Claude and ChatGPT assigned higher scores
-
Experiment Recommendations & Insights — 4.8 / 6. Its assigned score was above the eight-tool average of 3.8 / 6. As examples, Lifesight received credit for these criteria: “Platform recommends what to test next”; “Platform recommends control & test groups”; “Platform recommends test design and predicts test success”.
-
MMM Integration — 2.3 / 3. Its assigned score was above the eight-tool average of 1.6 / 3. As examples, Lifesight received credit for these criteria: “Has MMM that includes prior-based calibration by the user”; “UI to connect experiment results to MMM”.
-
Enterprise-Grade Platform — 3.8 / 5. Its assigned score was above the eight-tool average of 2.6 / 5. As examples, Lifesight received credit for these criteria: “SOC 2, ISO 27001, or audited IT security by a third-party cyber security auditor”; “Data residency: US and EU options”; “Single sign-on (SSO) for enterprises”.
Where scores were lower
-
A/B Test Analysis for Owned Media — 0.5 / 4. Its assigned score was below the eight-tool average of 0.9 / 4.
-
Conversion Lift Test Analysis — 1.3 / 5. Despite its relatively lower score in this category, Lifesight still scored above the average across all eight tools (1.0 / 5).
-
Unified Experiment Library — 1.8 / 3. Despite its relatively lower score in this category, Lifesight still scored above the average across all eight tools (1.0 / 3).
3. Measured (research score: 15.0 out of 32)
Research overview
Measured received an average research score of 15.0 out of 32, the third-highest total in this eight-tool comparison. Claude and ChatGPT each assessed its public documentation on September 8, 2026, across 32 criteria in seven categories.
Category scorecard
| Category | Measured | Average research score | Highest research score |
|---|---|---|---|
| 1. Geo Test Analysis | 3.5 / 6 | 2.8 / 6 | 4.0 / 6 |
| 2. A/B Test Analysis for Owned Media | 0.8 / 4 | 0.9 / 4 | 3.5 / 4 |
| 3. Conversion Lift Test Analysis | 0.0 / 5 | 1.0 / 5 | 4.5 / 5 |
| 4. Experiment Recommendations & Insights | 4.8 / 6 | 3.8 / 6 | 5.5 / 6 |
| 5. Unified Experiment Library | 1.0 / 3 | 1.0 / 3 | 2.0 / 3 |
| 6. MMM Integration | 2.3 / 3 | 1.6 / 3 | 3.0 / 3 |
| 7. Enterprise-Grade Platform | 2.8 / 5 | 2.6 / 5 | 4.8 / 5 |
| Total score out of 32 | 15.0 / 32 | 13.7 / 32 | 25.0 / 32 |
Categories contain different numbers of criteria. The higher- and lower-scoring groups below describe Measured’s own score profile as a share of available points. A lower score within that profile can still be above the eight-tool average. See the scoring methodology for how to interpret the results.
Percentage of available points
Bars show the tool’s average Claude and ChatGPT score as a percentage of the category maximum. Markers show the average and highest scores across all eight tools. Positions use unrounded scores; labels show points rounded to one decimal.
Where Claude and ChatGPT assigned higher scores
-
Experiment Recommendations & Insights — 4.8 / 6. Its assigned score was above the eight-tool average of 3.8 / 6. As examples, Measured received credit for these criteria: “Platform recommends what to test next”; “Platform recommends test design and predicts test success”; “MCP that can access experiment results”.
-
MMM Integration — 2.3 / 3. Its assigned score was above the eight-tool average of 1.6 / 3. As examples, Measured received credit for these criteria: “Has MMM that includes prior-based calibration by the user”; “UI to connect experiment results to MMM”.
-
Geo Test Analysis — 3.5 / 6. Its assigned score was above the eight-tool average of 2.8 / 6. As examples, Measured received credit for these criteria: “Analyzes geo tests with synthetic control method, providing iROAS and confidence interval”; “Self-serve UI for analyzing & reviewing geo test results”; “User can launch geo tests from the platform”.
Where scores were lower
-
Conversion Lift Test Analysis — 0.0 / 5. Its assigned score was below the eight-tool average of 1.0 / 5.
-
A/B Test Analysis for Owned Media — 0.8 / 4. Its assigned score was below the eight-tool average of 0.9 / 4.
-
Unified Experiment Library — 1.0 / 3. Despite its relatively lower score in this category, Measured still scored slightly above the average across all eight tools. Both scores display as 1.0 / 3 after rounding; the difference is visible in the unrounded scores.
4. Haus (research score: 13.3 out of 32)
Research overview
Haus received an average research score of 13.3 out of 32, the fourth-highest total in this eight-tool comparison. Claude and ChatGPT each assessed its public documentation on September 8, 2026, across 32 criteria in seven categories.
Category scorecard
| Category | Haus | Average research score | Highest research score |
|---|---|---|---|
| 1. Geo Test Analysis | 3.3 / 6 | 2.8 / 6 | 4.0 / 6 |
| 2. A/B Test Analysis for Owned Media | 0.5 / 4 | 0.9 / 4 | 3.5 / 4 |
| 3. Conversion Lift Test Analysis | 0.5 / 5 | 1.0 / 5 | 4.5 / 5 |
| 4. Experiment Recommendations & Insights | 5.5 / 6 | 3.8 / 6 | 5.5 / 6 |
| 5. Unified Experiment Library | 0.5 / 3 | 1.0 / 3 | 2.0 / 3 |
| 6. MMM Integration | 1.0 / 3 | 1.6 / 3 | 3.0 / 3 |
| 7. Enterprise-Grade Platform | 2.0 / 5 | 2.6 / 5 | 4.8 / 5 |
| Total score out of 32 | 13.3 / 32 | 13.7 / 32 | 25.0 / 32 |
Categories contain different numbers of criteria. The higher- and lower-scoring groups below describe Haus’s own score profile as a share of available points. A lower score within that profile can still be above the eight-tool average. See the scoring methodology for how to interpret the results.
Percentage of available points
Bars show the tool’s average Claude and ChatGPT score as a percentage of the category maximum. Markers show the average and highest scores across all eight tools. Positions use unrounded scores; labels show points rounded to one decimal.
Where Claude and ChatGPT assigned higher scores
-
Experiment Recommendations & Insights — 5.5 / 6. Its assigned score was above the eight-tool average of 3.8 / 6. Haus had the highest score among the eight tools in this category. As examples, Haus received credit for these criteria: “Platform recommends test design and predicts test success”; “AI-generated plain-language summaries”; “Conversational AI for discussing experiments”.
-
Geo Test Analysis — 3.3 / 6. Its assigned score was above the eight-tool average of 2.8 / 6. As examples, Haus received credit for these criteria: “Analyzes geo tests with synthetic control method, providing iROAS and confidence interval”; “Self-serve UI for analyzing & reviewing geo test results”; “User can launch geo tests from the platform”.
-
Enterprise-Grade Platform — 2.0 / 5. Its assigned score was below the eight-tool average of 2.6 / 5. As examples, Haus received credit for these criteria: “At least 10 public reference customers from $1B+ revenue brands”; “SOC 2, ISO 27001, or audited IT security by a third-party cyber security auditor”.
Where scores were lower
-
Conversion Lift Test Analysis — 0.5 / 5. Its assigned score was below the eight-tool average of 1.0 / 5.
-
A/B Test Analysis for Owned Media — 0.5 / 4. Its assigned score was below the eight-tool average of 0.9 / 4.
-
Unified Experiment Library — 0.5 / 3. Its assigned score was below the eight-tool average of 1.0 / 3.
5. Recast (research score: 12.3 out of 32)
Research overview
Recast received an average research score of 12.3 out of 32, the fifth-highest total in this eight-tool comparison. Claude and ChatGPT each assessed its public documentation on September 8, 2026, across 32 criteria in seven categories.
Category scorecard
| Category | Recast | Average research score | Highest research score |
|---|---|---|---|
| 1. Geo Test Analysis | 2.8 / 6 | 2.8 / 6 | 4.0 / 6 |
| 2. A/B Test Analysis for Owned Media | 0.8 / 4 | 0.9 / 4 | 3.5 / 4 |
| 3. Conversion Lift Test Analysis | 1.5 / 5 | 1.0 / 5 | 4.5 / 5 |
| 4. Experiment Recommendations & Insights | 3.3 / 6 | 3.8 / 6 | 5.5 / 6 |
| 5. Unified Experiment Library | 0.8 / 3 | 1.0 / 3 | 2.0 / 3 |
| 6. MMM Integration | 1.3 / 3 | 1.6 / 3 | 3.0 / 3 |
| 7. Enterprise-Grade Platform | 2.0 / 5 | 2.6 / 5 | 4.8 / 5 |
| Total score out of 32 | 12.3 / 32 | 13.7 / 32 | 25.0 / 32 |
Categories contain different numbers of criteria. The higher- and lower-scoring groups below describe Recast’s own score profile as a share of available points. A lower score within that profile can still be above the eight-tool average. See the scoring methodology for how to interpret the results.
Percentage of available points
Bars show the tool’s average Claude and ChatGPT score as a percentage of the category maximum. Markers show the average and highest scores across all eight tools. Positions use unrounded scores; labels show points rounded to one decimal.
Where Claude and ChatGPT assigned higher scores
-
Experiment Recommendations & Insights — 3.3 / 6. Its assigned score was below the eight-tool average of 3.8 / 6. As examples, Recast received credit for these criteria: “Platform recommends control & test groups”; “Platform recommends test design and predicts test success”; “MCP that can access experiment results”.
-
Geo Test Analysis — 2.8 / 6. Using unrounded scores, it was slightly below the eight-tool average; both display as 2.8 / 6 after rounding. As examples, Recast received credit for these criteria: “Analyzes geo tests with synthetic control method, providing iROAS and confidence interval”; “Self-serve UI for analyzing & reviewing geo test results”.
-
MMM Integration — 1.3 / 3. Its assigned score was below the eight-tool average of 1.6 / 3. As examples, Recast received credit for these criteria: “Has MMM that includes prior-based calibration by the user”; “UI to connect experiment results to MMM”.
Where scores were lower
-
A/B Test Analysis for Owned Media — 0.8 / 4. Its assigned score was below the eight-tool average of 0.9 / 4.
-
Unified Experiment Library — 0.8 / 3. Its assigned score was below the eight-tool average of 1.0 / 3.
-
Conversion Lift Test Analysis — 1.5 / 5. Despite its relatively lower score in this category, Recast still scored above the average across all eight tools (1.0 / 5).
6. LiftLab (research score: 12.0 out of 32)
Research overview
LiftLab received an average research score of 12.0 out of 32, the sixth-highest total in this eight-tool comparison. Claude and ChatGPT each assessed its public documentation on September 8, 2026, across 32 criteria in seven categories.
Category scorecard
| Category | LiftLab | Average research score | Highest research score |
|---|---|---|---|
| 1. Geo Test Analysis | 2.0 / 6 | 2.8 / 6 | 4.0 / 6 |
| 2. A/B Test Analysis for Owned Media | 0.0 / 4 | 0.9 / 4 | 3.5 / 4 |
| 3. Conversion Lift Test Analysis | 0.5 / 5 | 1.0 / 5 | 4.5 / 5 |
| 4. Experiment Recommendations & Insights | 3.8 / 6 | 3.8 / 6 | 5.5 / 6 |
| 5. Unified Experiment Library | 1.0 / 3 | 1.0 / 3 | 2.0 / 3 |
| 6. MMM Integration | 1.0 / 3 | 1.6 / 3 | 3.0 / 3 |
| 7. Enterprise-Grade Platform | 3.8 / 5 | 2.6 / 5 | 4.8 / 5 |
| Total score out of 32 | 12.0 / 32 | 13.7 / 32 | 25.0 / 32 |
Categories contain different numbers of criteria. The higher- and lower-scoring groups below describe LiftLab’s own score profile as a share of available points. A lower score within that profile can still be above the eight-tool average. See the scoring methodology for how to interpret the results.
Percentage of available points
Bars show the tool’s average Claude and ChatGPT score as a percentage of the category maximum. Markers show the average and highest scores across all eight tools. Positions use unrounded scores; labels show points rounded to one decimal.
Where Claude and ChatGPT assigned higher scores
-
Enterprise-Grade Platform — 3.8 / 5. Its assigned score was above the eight-tool average of 2.6 / 5. As examples, LiftLab received credit for these criteria: “SOC 2, ISO 27001, or audited IT security by a third-party cyber security auditor”; “Dual-cloud option between AWS, GCP, and Azure”; “Single sign-on (SSO) for enterprises”.
-
Experiment Recommendations & Insights — 3.8 / 6. Using unrounded scores, it was slightly below the eight-tool average; both display as 3.8 / 6 after rounding. As examples, LiftLab received credit for these criteria: “Platform recommends what to test next”; “Platform recommends control & test groups”; “Platform recommends test design and predicts test success”.
Where scores were lower
-
A/B Test Analysis for Owned Media — 0.0 / 4. Its assigned score was below the eight-tool average of 0.9 / 4.
-
Conversion Lift Test Analysis — 0.5 / 5. Its assigned score was below the eight-tool average of 1.0 / 5.
-
Geo Test Analysis — 2.0 / 6. Its assigned score was below the eight-tool average of 2.8 / 6. Geo Test Analysis, Unified Experiment Library, and MMM Integration each received one-third of the available points, tying for LiftLab’s next-lowest category score as a share of available points.
7. Analytic Partners (research score: 8.5 out of 32)
Research overview
Analytic Partners received an average research score of 8.5 out of 32, the seventh-highest total in this eight-tool comparison. Claude and ChatGPT each assessed its public documentation on September 9, 2026, across 32 criteria in seven categories.
Category scorecard
| Category | Analytic Partners | Average research score | Highest research score |
|---|---|---|---|
| 1. Geo Test Analysis | 1.8 / 6 | 2.8 / 6 | 4.0 / 6 |
| 2. A/B Test Analysis for Owned Media | 1.0 / 4 | 0.9 / 4 | 3.5 / 4 |
| 3. Conversion Lift Test Analysis | 0.0 / 5 | 1.0 / 5 | 4.5 / 5 |
| 4. Experiment Recommendations & Insights | 2.5 / 6 | 3.8 / 6 | 5.5 / 6 |
| 5. Unified Experiment Library | 0.8 / 3 | 1.0 / 3 | 2.0 / 3 |
| 6. MMM Integration | 0.8 / 3 | 1.6 / 3 | 3.0 / 3 |
| 7. Enterprise-Grade Platform | 1.8 / 5 | 2.6 / 5 | 4.8 / 5 |
| Total score out of 32 | 8.5 / 32 | 13.7 / 32 | 25.0 / 32 |
Categories contain different numbers of criteria. The higher- and lower-scoring groups below describe Analytic Partners’s own score profile as a share of available points. A lower score within that profile can still be above the eight-tool average. See the scoring methodology for how to interpret the results.
Percentage of available points
Bars show the tool’s average Claude and ChatGPT score as a percentage of the category maximum. Markers show the average and highest scores across all eight tools. Positions use unrounded scores; labels show points rounded to one decimal.
Where Claude and ChatGPT assigned higher scores
-
Experiment Recommendations & Insights — 2.5 / 6. Its assigned score was below the eight-tool average of 3.8 / 6. As examples, Analytic Partners received credit for these criteria: “Platform recommends what to test next”; “Platform recommends control & test groups”; “Platform recommends test design and predicts test success”.
-
Enterprise-Grade Platform — 1.8 / 5. Its assigned score was below the eight-tool average of 2.6 / 5. As examples, Analytic Partners received credit for these criteria: “At least 10 public reference customers from $1B+ revenue brands”; “SOC 2, ISO 27001, or audited IT security by a third-party cyber security auditor”.
-
Geo Test Analysis — 1.8 / 6. Its assigned score was below the eight-tool average of 2.8 / 6. As examples, Analytic Partners received credit for these criteria: “Analyzes geo tests with synthetic control method, providing iROAS and confidence interval”; “Self-serve UI for analyzing & reviewing geo test results”.
Where scores were lower
-
Conversion Lift Test Analysis — 0.0 / 5. Its assigned score was below the eight-tool average of 1.0 / 5.
-
A/B Test Analysis for Owned Media — 1.0 / 4. Despite its relatively lower score in this category, Analytic Partners still scored above the average across all eight tools (0.9 / 4).
-
MMM Integration — 0.8 / 3. Its assigned score was below the eight-tool average of 1.6 / 3.
Owned-media A/B-test analysis, the unified experiment library, and MMM integration each received 25% of the available points. The A/B-test score was nevertheless above the eight-tool average and the second-highest in that category.
8. Meridian GeoX (research score: 5.8 out of 32)
Research overview
Meridian GeoX received an average research score of 5.8 out of 32, the eighth-highest total in this eight-tool comparison. Claude and ChatGPT each assessed its public documentation on September 8, 2026, across 32 criteria in seven categories.
Category scorecard
| Category | Meridian GeoX | Average research score | Highest research score |
|---|---|---|---|
| 1. Geo Test Analysis | 1.5 / 6 | 2.8 / 6 | 4.0 / 6 |
| 2. A/B Test Analysis for Owned Media | 0.0 / 4 | 0.9 / 4 | 3.5 / 4 |
| 3. Conversion Lift Test Analysis | 0.0 / 5 | 1.0 / 5 | 4.5 / 5 |
| 4. Experiment Recommendations & Insights | 3.0 / 6 | 3.8 / 6 | 5.5 / 6 |
| 5. Unified Experiment Library | 0.0 / 3 | 1.0 / 3 | 2.0 / 3 |
| 6. MMM Integration | 1.3 / 3 | 1.6 / 3 | 3.0 / 3 |
| 7. Enterprise-Grade Platform | 0.0 / 5 | 2.6 / 5 | 4.8 / 5 |
| Total score out of 32 | 5.8 / 32 | 13.7 / 32 | 25.0 / 32 |
Categories contain different numbers of criteria. The higher- and lower-scoring groups below describe Meridian GeoX’s own score profile as a share of available points. A lower score within that profile can still be above the eight-tool average. See the scoring methodology for how to interpret the results.
Percentage of available points
Bars show the tool’s average Claude and ChatGPT score as a percentage of the category maximum. Markers show the average and highest scores across all eight tools. Positions use unrounded scores; labels show points rounded to one decimal.
Where Claude and ChatGPT assigned higher scores
-
Experiment Recommendations & Insights — 3.0 / 6. Its assigned score was below the eight-tool average of 3.8 / 6. As examples, Meridian GeoX received credit for these criteria: “Platform recommends what to test next”; “Platform recommends control & test groups”; “Platform recommends test design and predicts test success”.
-
MMM Integration — 1.3 / 3. Its assigned score was below the eight-tool average of 1.6 / 3. As an example, Meridian GeoX received credit for this criterion: “Has MMM that includes prior-based calibration by the user”.
-
Geo Test Analysis — 1.5 / 6. Its assigned score was below the eight-tool average of 2.8 / 6. As examples, Meridian GeoX received credit for these criteria: “Analyzes geo tests with synthetic control method, providing iROAS and confidence interval”; “Estimates media counterfactual for lost/incremental spend”.
Where scores were lower
-
A/B Test Analysis for Owned Media — 0.0 / 4. Its assigned score was below the eight-tool average of 0.9 / 4.
-
Conversion Lift Test Analysis — 0.0 / 5. Its assigned score was below the eight-tool average of 1.0 / 5.
-
Unified Experiment Library — 0.0 / 3. Its assigned score was below the eight-tool average of 1.0 / 3. Enterprise-Grade Platform — 0.0 / 5. Its assigned score was below the eight-tool average of 2.6 / 5.
These four categories received zero evidence credit in this assessment. Meridian GeoX is an open-source library evaluated alongside commercial tools. Its narrower scope matters when interpreting these category scores.
Frequently Asked Questions
1. What is incrementality testing, and how does it differ from MMM?
Incrementality testing estimates the effect of a marketing intervention using treatment and control groups or a suitable counterfactual. MMM estimates marketing effects from historical time-series data. Tests can inform a specific decision and provide evidence for model calibration; neither approach makes uncertainty disappear.
2. Which types of tests does this comparison cover?
The criteria cover geo tests, A/B tests for owned media such as catalogs or email, and analysis of platform-run conversion lift tests. These workflows differ in how treatment is assigned and how results are collected. Not every test produces an iROAS estimate, and a test can be inconclusive.
3. Which tools received the highest research scores?
Sellforte received the highest average total at 25.0 / 32, followed by Lifesight at 18.0, Measured at 15.0, Haus at 13.3, Recast at 12.3, LiftLab at 12.0, Analytic Partners at 8.5, and Meridian GeoX at 5.8. Sellforte led six categories; Haus led experiment recommendations and insights. These are public-evidence research scores, not hands-on product ratings.
4. Why does a unified experiment library matter?
A library can help teams find prior experiments, compare results, and manage access across channels and regions. This evaluation separately scores coverage of the three test types, filtering, and governance. Ask vendors to demonstrate the exact test types and controls your team needs.
5. How can experiments inform MMM calibration?
Experiment estimates can inform model priors. Their relevance depends on the tested channel, population, period, and spending level, as well as uncertainty in the experiment and its transfer to the model. The evaluation distinguishes prior-based calibration, a linking interface, and comparability with attribution-based priors.
6. What should buyers look for in an incrementality testing tool?
Start with your test types, analysis needs, data sources, and operating model. Then assess test design, result ingestion, the experiment library, MMM integration, and governance. Use the criterion-level results to prepare demonstrations and questions. Verify current functionality, implementation effort, pricing, and support directly.
7. How should a zero or partial score be interpreted?
A zero means Claude and ChatGPT found no public evidence under the stated methodology. It does not prove that a feature is absent. Each model assigned 0, 0.5, or 1; averaging their assessments can produce 0.25 or 0.75. Displayed scores are rounded, while calculations use unrounded values.
8. How does an open-source library compare with a commercial platform?
Meridian GeoX is assessed against the same criteria as the seven commercial tools. Requirements such as a hosted user interface, a unified library, and enterprise controls can produce low scores for a library with a narrower purpose. Teams should separately assess the engineering work and operating responsibilities of their intended deployment.
Change log
2026 May 7. Research was launched
2026 June 15. Research methodology was updated. We changed from Sellforte-based scoring to LLM-based scoring to minimize author bias. Evaluation for all vendors was updated.
2026 September 9. Research scoring was updated: all vendors were re-evaluated using the latest information on their website. Analytic Partners, Lifesight and Liftlab were added as new vendors.
Evaluation Dates by Vendor and LLM
The table records the model versions and completion dates for the current evaluation. Fourteen assessments were completed on September 8, 2026; the two Analytic Partners assessments were completed on September 9.
| Tool | LLM | Model version | Evaluation date |
|---|---|---|---|
| Sellforte | ChatGPT | GPT-6 Astra High | September 8, 2026 |
| Sellforte | Claude | Fable 5.1 High | September 8, 2026 |
| Lifesight | ChatGPT | GPT-6 Astra High | September 8, 2026 |
| Lifesight | Claude | Fable 5.1 High | September 8, 2026 |
| Measured | ChatGPT | GPT-6 Astra High | September 8, 2026 |
| Measured | Claude | Fable 5.1 High | September 8, 2026 |
| Haus | ChatGPT | GPT-6 Astra High | September 8, 2026 |
| Haus | Claude | Fable 5.1 High | September 8, 2026 |
| Recast | ChatGPT | GPT-6 Astra High | September 8, 2026 |
| Recast | Claude | Fable 5.1 High | September 8, 2026 |
| LiftLab | ChatGPT | GPT-6 Astra High | September 8, 2026 |
| LiftLab | Claude | Fable 5.1 High | September 8, 2026 |
| Analytic Partners | ChatGPT | GPT-6 Astra High | September 9, 2026 |
| Analytic Partners | Claude | Fable 5.1 High | September 9, 2026 |
| Meridian GeoX | ChatGPT | GPT-6 Astra High | September 8, 2026 |
| Meridian GeoX | Claude | Fable 5.1 High | September 8, 2026 |
Limitations & Disclosures
Author affiliation. Sellforte designed and published this comparison and is one of the tools evaluated. Claude and ChatGPT assigned the scores, but this does not remove the conflict of interest or potential bias in criterion selection, source discovery, interpretation, and presentation.
Evidence and product scope. This is a public-documentation assessment of seven commercial tools and one open-source library, not a hands-on product test or an exhaustive market survey. It does not measure pricing, implementation quality, service quality, customer outcomes, or the accuracy of the statistical methods in production. A zero score records missing public evidence under the methodology.
Snapshot in time. The current results use assessments completed September 8–9, 2026. Documentation and products may change. The evaluation log identifies each model and date, and the methodology explains aggregation and rounding.
Interpretation of totals. Each of the 32 criteria has equal weight, so categories with more criteria contribute more to the total. The same framework may fit some products and buyer needs better than others. Category averages include Meridian GeoX and should not be read as market-wide adoption statistics.
Corrections. Vendors can submit documentation supporting a correction or re-evaluation to research@sellforte.com. Review the source evidence and model rationales in the scoring workbook when investigating a disputed score.
Buyer decisions. Use the comparison to prepare vendor questions and demonstrations. Verify your required workflows, deployment options, integrations, governance, support, and costs directly before selecting a product.
Further Reading & Resources
Methodology
- Calibrating Marketing Mix Models with Experiments and Attribution data
- Advertising response curves: What are they and why do you need them?
- What is Causal Marketing Mix Modeling (MMM)?
- Understanding R2 in Marketing Mix Modeling: A Guide for Marketers
- MMM for Ecommerce: How Marketing Mix Modeling (MMM) Works for Online DTC Brands
- What does "Enterprise-Grade" Mean in Marketing Mix Modeling (MMM)?
- What is Incrementality Testing? Guide for Marketers
- Marginal Incremental ROAS (miROAS): What is it? And why does it matter to marketers?
- How Much Ad Spend Is Needed for Marketing Mix Modeling?
AI and Agents in Marketing Measurement
- The Rise of Agentic MMM (Marketing Mix Modeling): How AI Is Transforming Media Optimization
- State of AI in MMM: Only 13% of MMM Vendors Implementing AI
- Webinar: Agentic MMM in Action: The Future of Autonomous Media Planning and Buying in Real Time
Use-cases on media spend optimization
- 11 Benefits of Marketing Mix Modeling (MMM) Every Marketer Should Know
- 6 Reasons eCommerce & DTC Brands Should Use Marketing Mix Modeling (MMM)
- The Shift in Marketing Mix Modeling: Why Campaign-Level Optimization is Taking Over
- The Five Requirements of Autonomous Media Buying and Optimization: M.A.G.I.C.
- Bid Optimization: How to Calculate the Optimal Bid Values for Your Campaigns Using miROAS
- ROAS, iROAS, miROAS: Choosing the Right KPI for Optimizing Media Spend
Original Marketing Measurement Research by Sellforte Labs
- The 3 Danger Zones of Last-Click (And How to Avoid Them)
- How to measure Meta correctly? GA4 vs. MTA vs. MMM
- How to Measure the True Effectiveness of TikTok Ads?
- From Last-click to Marketing Mix Modeling (MMM): Unlock +6.5% more sales
- The Missing 24%: Why MMM Without Promotions Behaves Like Last-Click
Practical hands-on guides
- How to Integrate Experiments Into an MMM Platform: A Practical Guide
- MMM Pilot Best Practices: 4 Steps to Plan, Run & Scale Your Marketing Mix Modeling Pilot
Asked by Marketers: Practical incrementality questions
- How should we prioritize incrementality tests across markets and channels?
- What is the right holdout-group size for an incrementality test?
- Should we run a full marketing blackout or a partial holdout test?
- When is a market or channel too small to justify an incrementality test?
- Can you trust Meta Conversion Lift tests for MMM calibration?
- How should geo-lift and conversion-lift studies be combined when calibrating MMM?
- How should we weight multiple incrementality tests when calibrating an MMM?
Marketing Measurement Tools, software and vendors
Evaluation guides:
- How to Choose an Incrementality Testing Tool: 31 Evaluation Criteria
- How to Choose an AI Tool for MMM and Incrementality Testing: 49 Evaluation Criteria
AI tools for MMM and incrementality testing:
MMM tools, software and vendors for Ecommerce
- Best MMM Tools for Ecommerce Brands: Top 10 Software for 2026
- Best Real-Time MMM Tools for Ecommerce Brands: Software That Delivers Instant Marketing Insights
- Top 5 Enterprise MMM Software for Large Ecommerce Brands ($1B+ in Sales)
- Top 5 Mid-Market MMM Software for Medium-Sized Ecommerce Brands ($50M–$1B Revenue)
- Top 5 SMB MMM Software for Small Ecommerce Brands ($0–$50M Annual Revenue)
MMM tools, software and vendors more broadly
- 30 Marketing Mix Modeling Tools for Accelerating Growth in 2025
- Meridian vs. Sellforte MMM SaaS: The Complete Comparison for 2026
Review Sellforte SaaS Product Features
- Visit Sellforte demo (no sign-up required): Sellforte demo
- Sellforte Experiment product page
Authors

Lauri Potka is the Chief Operating Officer at Sellforte, with over 15 years of experience in Marketing Mix Modeling, marketing measurement, and media spend optimization. Before joining Sellforte, he worked as a management consultant at the Boston Consulting Group, advising some of the world’s largest advertisers on data-driven marketing optimization. Follow Lauri in LinkedIn, where he is one of the leading voices in MMM and marketing measurement.

Kacper Solarski is a Lead Data Scientist at Sellforte, focused on developing Sellforte's Experiments product. Kacper is one of the most senior data scientists and developers at Sellforte, where he has implemented Marketing Mix Models and incrementality testing solutions to Sellforte customers, while at the same time developing Sellforte's platform. Follow Kacper in LinkedIn.
.png?width=701&height=132&name=Juha%20Nuutinen%20(701%20x%20132%20px).png)
Juha Nuutinen is the Chief Executive Officer and co-founder at Sellforte, with over 15 years of experience in optimizing marketing spend and promotional activity for the largest advertisers in the world. Before co-founding Sellforte, he worked as a management consultant at the Boston Consulting Group, specializing in promotion optimization. Follow Juha in LinkedIn, where he is actively sharing his views on marketing measurement.

Best MMM Solutions for Retail Brands: Top Marketing Mix Modeling Platforms (2026 Q3 update)

6 Best Conversational AI Tools for MMM and Incrementality Testing in 2026: An In-Depth Comparison