Incrementality Testing Use Case

To start analyzing an incrementality test that has already run, open Experiments → New analysis in Sellforte. Choose the workflow that matches the evidence you have: GeoLift for an executed geo experiment with data already configured in Sellforte, A/B Test for suitable test-and-control time series in your own files, or Conversion Lift for a supported platform study export. This guide helps you find the correct analysis form and prepare its inputs.
This guide shows the forms in the public Sellforte demo. The screenshots use simulated data. Uploads and analysis submission are disabled in the demo; opening a form does not run an advertising experiment.
Before you start: Your test has already run. Have its treatment and control definitions, measured outcome and dates available, and identify where the results or underlying data are stored.
What you will produce: The correct analysis workflow for your existing test and a list of inputs needed to complete its setup.
1. Locate the results or data from your completed test
Before selecting a tab, write down what changed, who or which markets received the treatment, what the control group did, the outcome to measure and the treatment dates. Then identify whether the evidence is an existing platform study, data already in Sellforte or files you need to upload.
| Your starting point | Route in Sellforte |
|---|---|
| An executed geographic intervention, with the relevant regional KPI and media data already configured. | GeoLift |
| Your own KPI time series for test and control groups, with pretreatment history and optional media data. | A/B Test |
| A supported platform Conversion Lift study, such as a completed Meta study and its export. | Conversion Lift |
These routes describe how to bring evidence into the analysis. They do not randomize users, choose a valid holdout or pause advertising for you. If the experiment has not been designed or executed, start with test prioritization and the appropriate design work.
2. Use GeoLift for an existing regional intervention
In Experiments, select New analysis → GeoLift. The form lets you choose an analysis name, country, target KPI, geographic grouping, test groups, control groups, ad platforms and treatment dates.
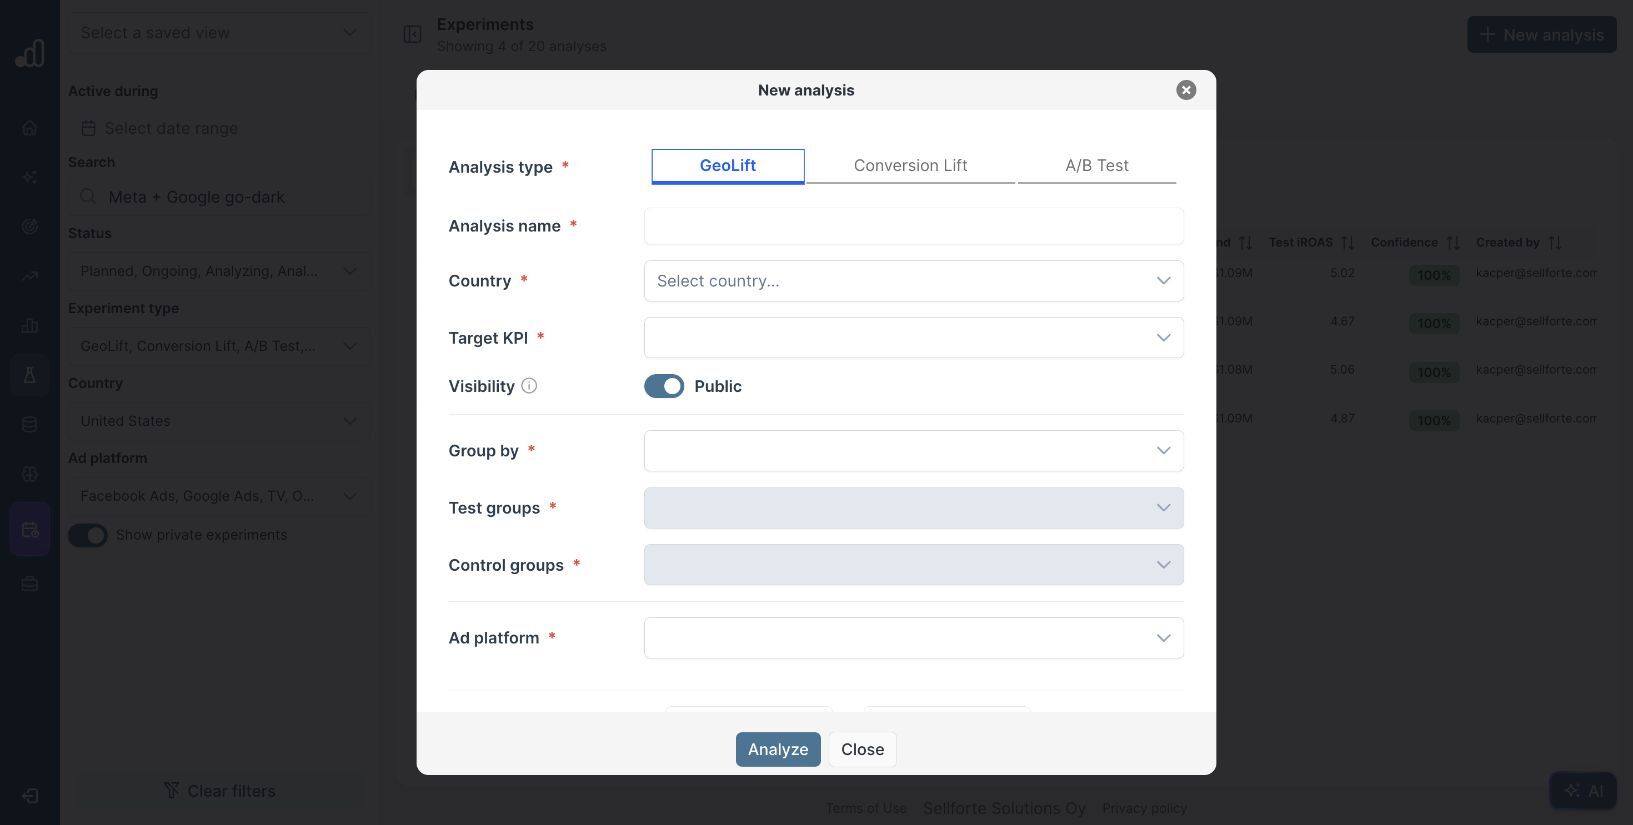
Use this route when the data needed to measure a geo experiment are already available in Sellforte. For example, the demo’s four-market Meta + Google go-dark experiment reduces advertising in selected US markets and uses untreated markets to help estimate the counterfactual.
The practical checks are whether the geographic data are sufficiently granular, whether the assigned controls remained untreated, and whether the recorded dates match the actual intervention. Review pretreatment history, cooldown and media investment baseline in Advanced options before submitting an analysis in your own account.
Follow how to analyze a geo test using data already in Sellforte for the full setup. The geographic resolution required for a test should be checked directly; the presence of a country-level MMM does not by itself establish that the required regional inputs are available.
3. Use A/B Test to upload your own time series
Select A/B Test. The form provides a required KPI data upload and an optional Media data upload. Expand Expected format for KPI and Media files to inspect the structure and download a template.
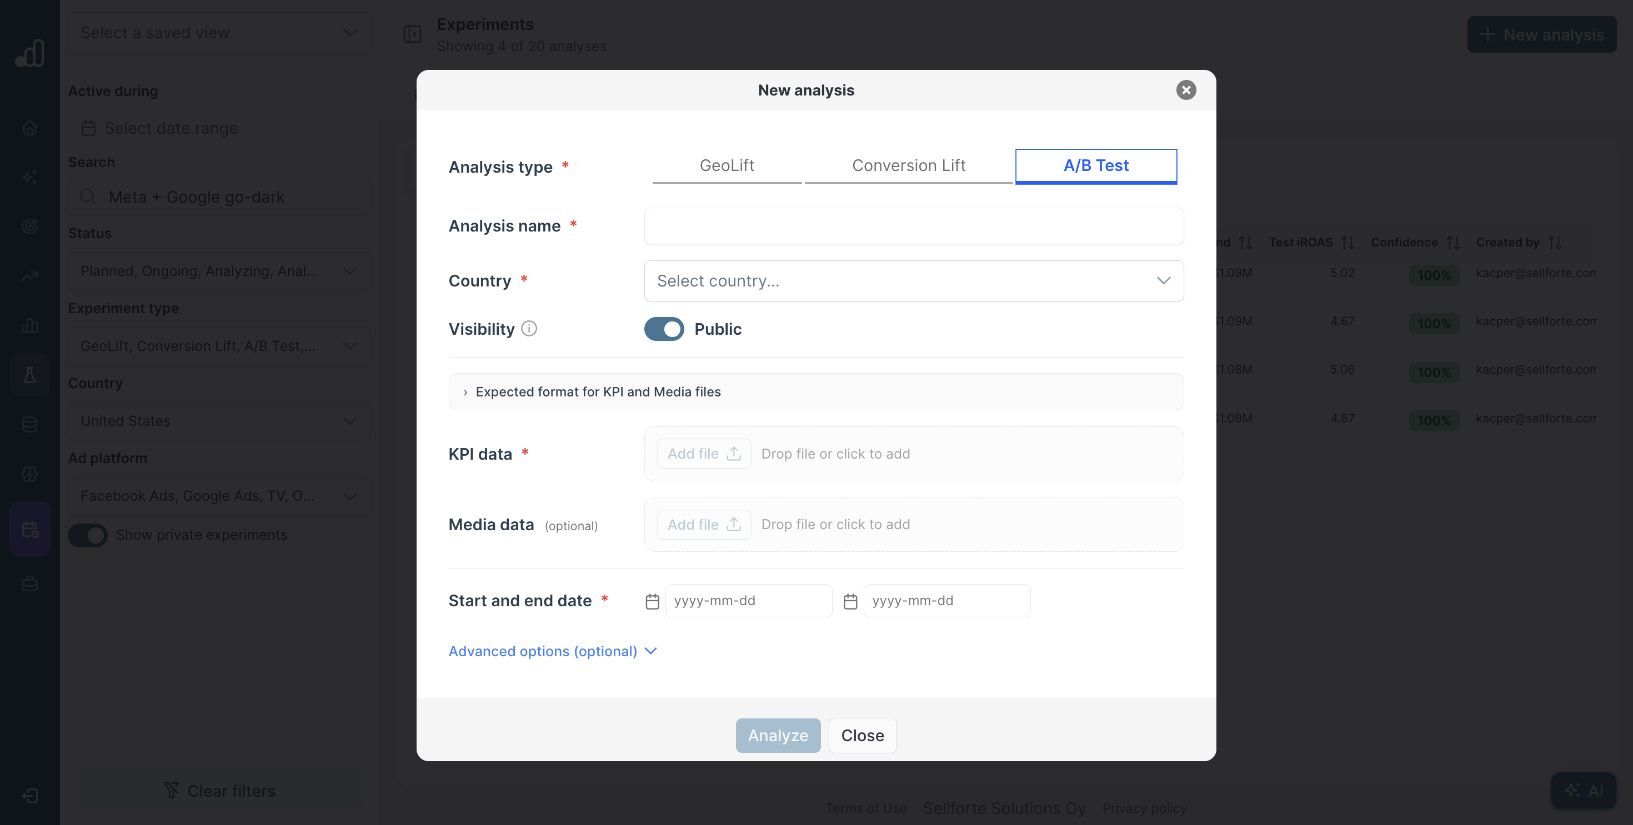
A suitable example is an executed email winback holdout for which you have daily KPI values for the send and control groups before and during the intervention. The KPI file supplies the outcome history; the media file supplies spend when you need a return calculation.
Sellforte’s GeoLift and A/B Test analysis uses a Bayesian synthetic-control approach to estimate the counterfactual from pretreatment relationships. The A/B label should therefore not be read as a generic significance calculator for any pair of aggregate conversion rates. The required input is a suitable time series with a credible test-and-control design.
This upload route can also be relevant for a geographic experiment whose regional data are outside the existing Sellforte data setup. Geography alone is not a reason to choose the GeoLift form if its required inputs are unavailable there.
The A/B test file guide shows the date, test and control columns and explains how to prepare the files. Without suitable spend data, focus the readout on incremental KPI impact rather than promising an iROAS result.
4. Use Conversion Lift to import a platform study
Select Conversion Lift when you have a supported lift study from an advertising platform. The form includes country, target KPI, ad platform, a required KPI data file and the study dates. Meta’s source study is imported through this route.
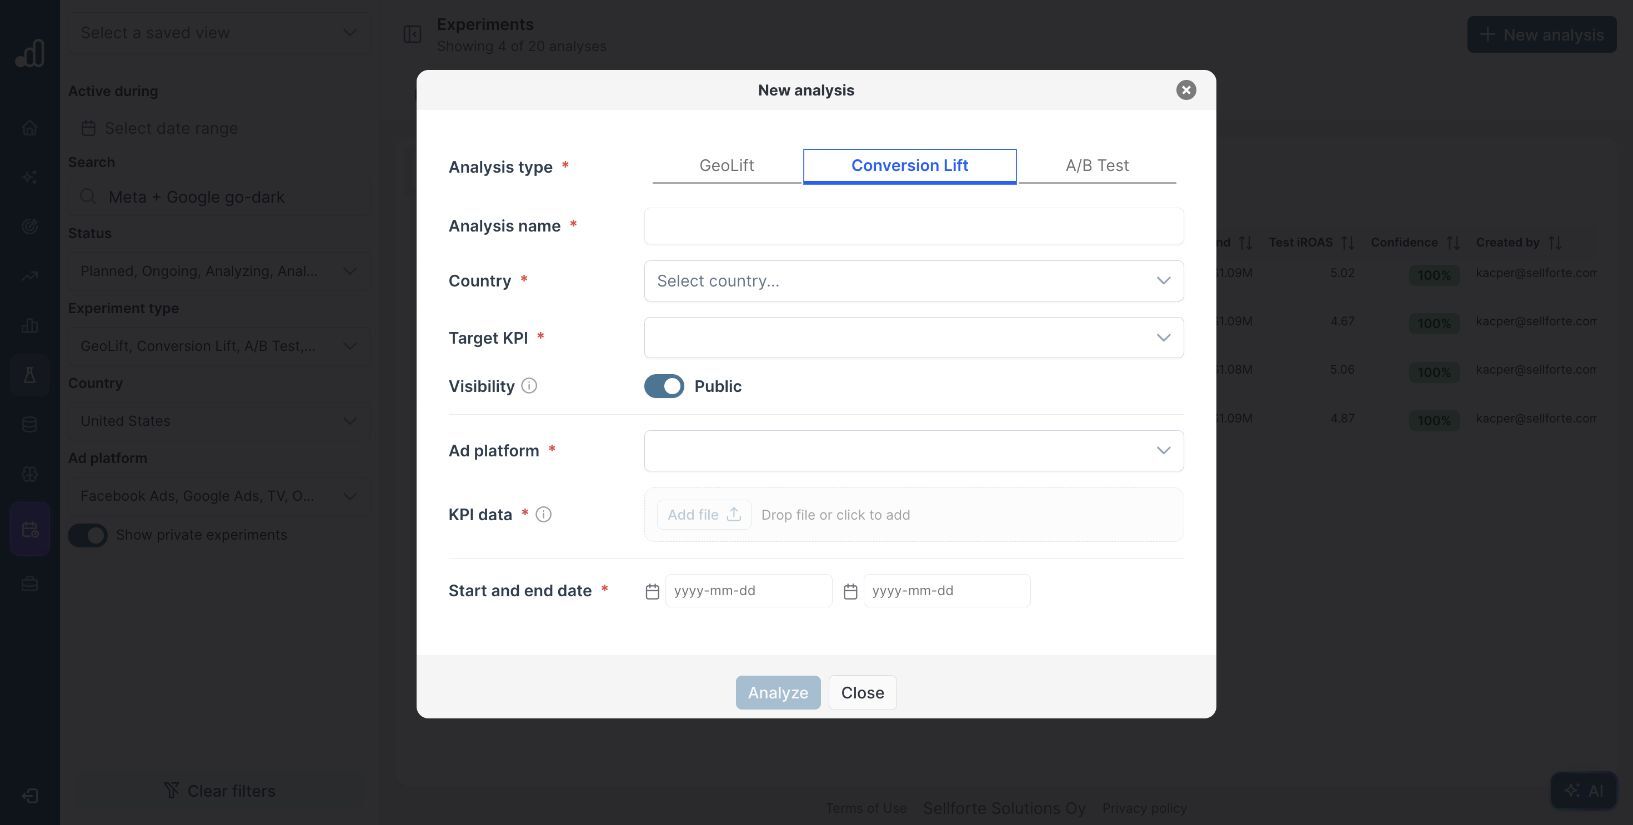
For example, the demo’s July US Meta Prospecting study is a completed platform Conversion Lift study. You would use its original study export and confirm the measured conversion event and media scope. You would not turn the study’s aggregate result into an improvised daily A/B input.
Check the current platform-specific import requirements and any campaign or ad-set identifiers before uploading. Follow how to import and analyze a Meta Conversion Lift study for the detailed workflow. If the study already appears in your library, inspect the existing record before importing a duplicate.
5. Match your existing test to the analysis workflow
| Example | Analysis workflow |
|---|---|
| “We paused Meta and Google in four markets. Regional sales and media inputs are already in Sellforte.” | GeoLift: select the configured test and control markets, media and treatment dates. |
| “We ran an email holdout and have daily sales histories for the groups in a spreadsheet.” | A/B Test: prepare the template with pretreatment and treatment observations, plus spend if required. |
| “Meta completed a Conversion Lift study and we have its export.” | Conversion Lift: import the supported study file and verify the source scope. |
If none fits, identify the missing input before proceeding. A post-campaign sales total without a credible counterfactual is not enough to establish incrementality. Likewise, two group labels do not guarantee that the untreated group provides a valid comparison.
6. Keep the analysis name and readout consistent
Use a name that identifies the activity, market or audience, and period. Record the treatment dates separately from the history or cooldown window. Review visibility so the result is available to the right colleagues in your workspace.
After analysis, inspect scope, incremental outcome and uncertainty before using the result. For GeoLift and A/B Test, review fit and treatment-effect charts. For a platform study, reconcile the imported result with the original export. The test-library guide helps keep that evidence easy to find for the next decision.
Further Reading and Resources
About the author

Lauri Potka is the Chief Operating Officer at Sellforte, with over 15 years of experience in Marketing Mix Modeling, marketing measurement and media spend optimization. Before joining Sellforte, he worked as a management consultant at the Boston Consulting Group, advising some of the world’s largest advertisers on marketing optimization. Follow Lauri on LinkedIn.

How to Compare Geo-Test Results Across Markets

How to Check Whether Your Geo-Test Result Is Robust