Incrementality Testing Use Case

To analyze a geo test using data already in Sellforte, open Experiments → New analysis → GeoLift. Select the KPI, geographic grouping, test and control markets, advertising platforms and treatment dates. Sellforte uses those selections to analyze the experiment against a counterfactual.
This guide shows the setup in the public Sellforte demo, followed by an existing completed geo analysis. All screenshots and figures use simulated data. The form selections demonstrate the workflow; the completed result is a separate example, not a new analysis generated during this walkthrough.
Before you start: You need an executed geo experiment, its treatment dates and region assignments, and the required KPI and media data configured in Sellforte.
What you will produce: A geo analysis with documented scope, timing and assumptions, ready for a result review.
1. Confirm that the experiment data is available
Start with the experiment that actually ran: which regions received a change in advertising, which regions remained untreated, what changed, and when it happened. Keep the execution record nearby while setting up the analysis.
GeoLift uses data already configured in Sellforte. Your KPI and media data need the regional detail required for the experiment. A country-level total cannot tell the analysis what happened separately in each test market. If the required regions or KPI are missing, resolve the data setup with your Sellforte team first. See the Geo Lift data requirements.
If you have test and control data in external files instead, the A/B test upload workflow may be the appropriate route. Choose it based on the data and experimental design you have.
2. Name the analysis and choose the KPI
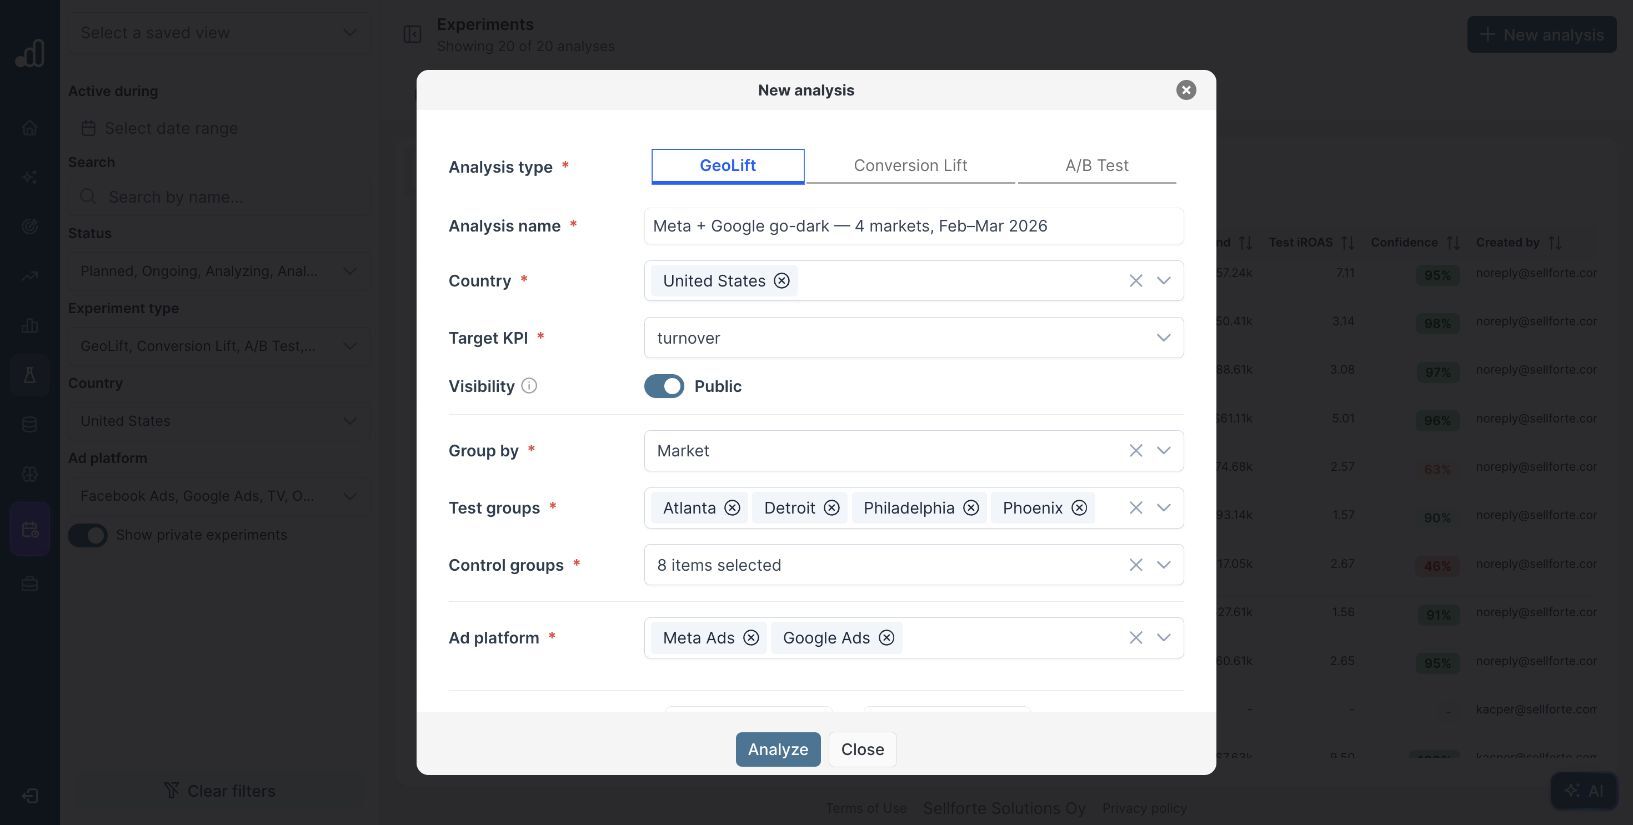
Open Experiments, select New analysis, and keep the GeoLift tab selected. Give the analysis a name that identifies the activity, geography and period.
Our setup example is Meta + Google go-dark — 4 markets, Feb–Mar 2026. Select United States under Country and turnover under Target KPI, the available revenue KPI in the demo. Review the Visibility setting for the audience that should have access to the analysis.
Keep the outcome aligned with the decision. If the business question concerns incremental revenue, a result based on a different conversion event needs a separate interpretation.
3. Select the regions and tested media
Set Group by to the geographic level used in the experiment. The demo offers Country and Market; this example uses Market. Selecting a grouping enables the test and control group fields.
Under Test groups, select the regions that received the intervention. To demonstrate the selection, the screenshot uses Atlanta, Detroit, Philadelphia and Phoenix. Under Control groups, choose eligible regions that did not receive it. The form removes the selected test markets from the available control choices.
The demo setup selects the eight remaining markets as a candidate control pool. In a real analysis, inclusion needs a reason: confirm that these markets stayed untreated, have usable history and were not affected by another event that would undermine the comparison. Selecting every available region is not a substitute for that check.
Under Ad platform, choose the advertising activity changed by the experiment. The example selects Meta Ads and Google Ads. The resulting return describes the combined intervention; it cannot by itself separate Meta’s contribution from Google’s.
4. Set the treatment dates and review advanced options
Enter the actual treatment period in Start and end date. The example runs from 2026-02-01 to 2026-03-14. Use the dates when the advertising change was in effect, rather than extending the treatment window to include all the historical data.
Open Advanced options (optional) to inspect the history and baseline settings.
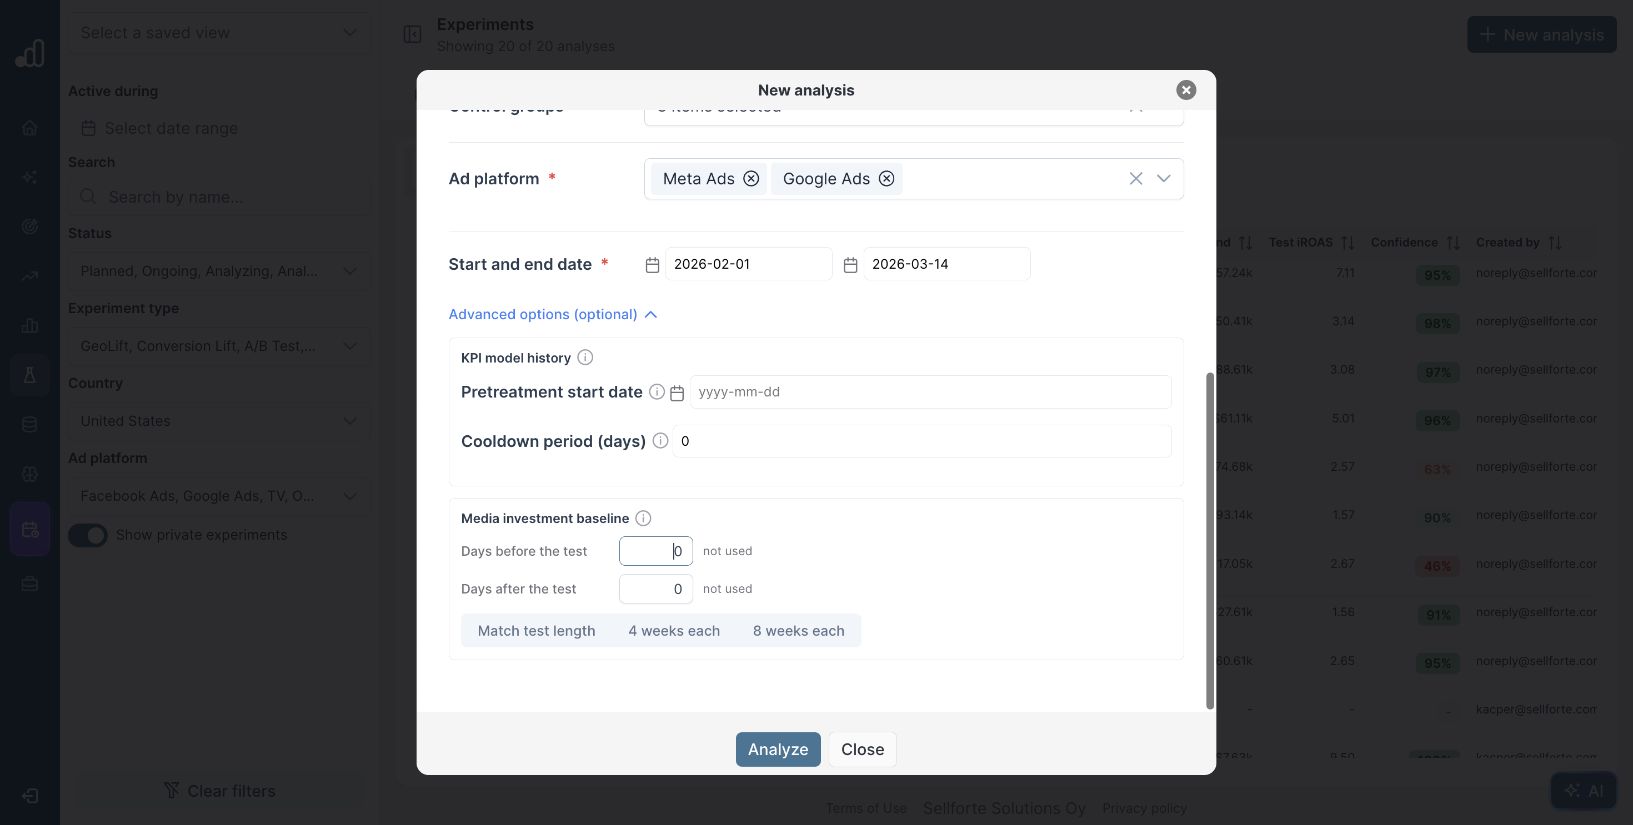
| Setting | What to establish before changing it |
|---|---|
| Pretreatment start date | The historical period available for fitting the KPI counterfactual, before the intervention began. |
| Cooldown period (days) | Whether the analysis should include effects that persist after treatment ends, using an agreed measurement window. |
| Media investment baseline | Which surrounding days reasonably represent spend without the intervention. The form offers days before and after, plus presets. |
The baseline presets are Match test length, 4 weeks each and 8 weeks each. Check their relevance to the campaign calendar before applying one. Promotions, another budget change or a different seasonal period can make nearby weeks a poor comparison.
The screenshot leaves the advanced settings at their initial values to show where they are. It is not a recommended configuration for every test. Agree changes based on the experiment design and available history, and document why you made them. Avoid changing settings repeatedly just to obtain a more favorable result.
5. Run the analysis and inspect the result
Review the name, KPI, regions, media and dates against the execution record, then select Analyze in your workspace. Open the completed analysis from the library when it is ready. A completed status means that results are available; you still need to review whether the setup and evidence support the intended conclusion.
For a completed example, open Meta + Google go-dark — 4 markets, Feb–Mar 2026. Its current result cards show 4.87 test iROAS, a 90% interval of 4.59 to 5.14 and R Squared of 0.95.
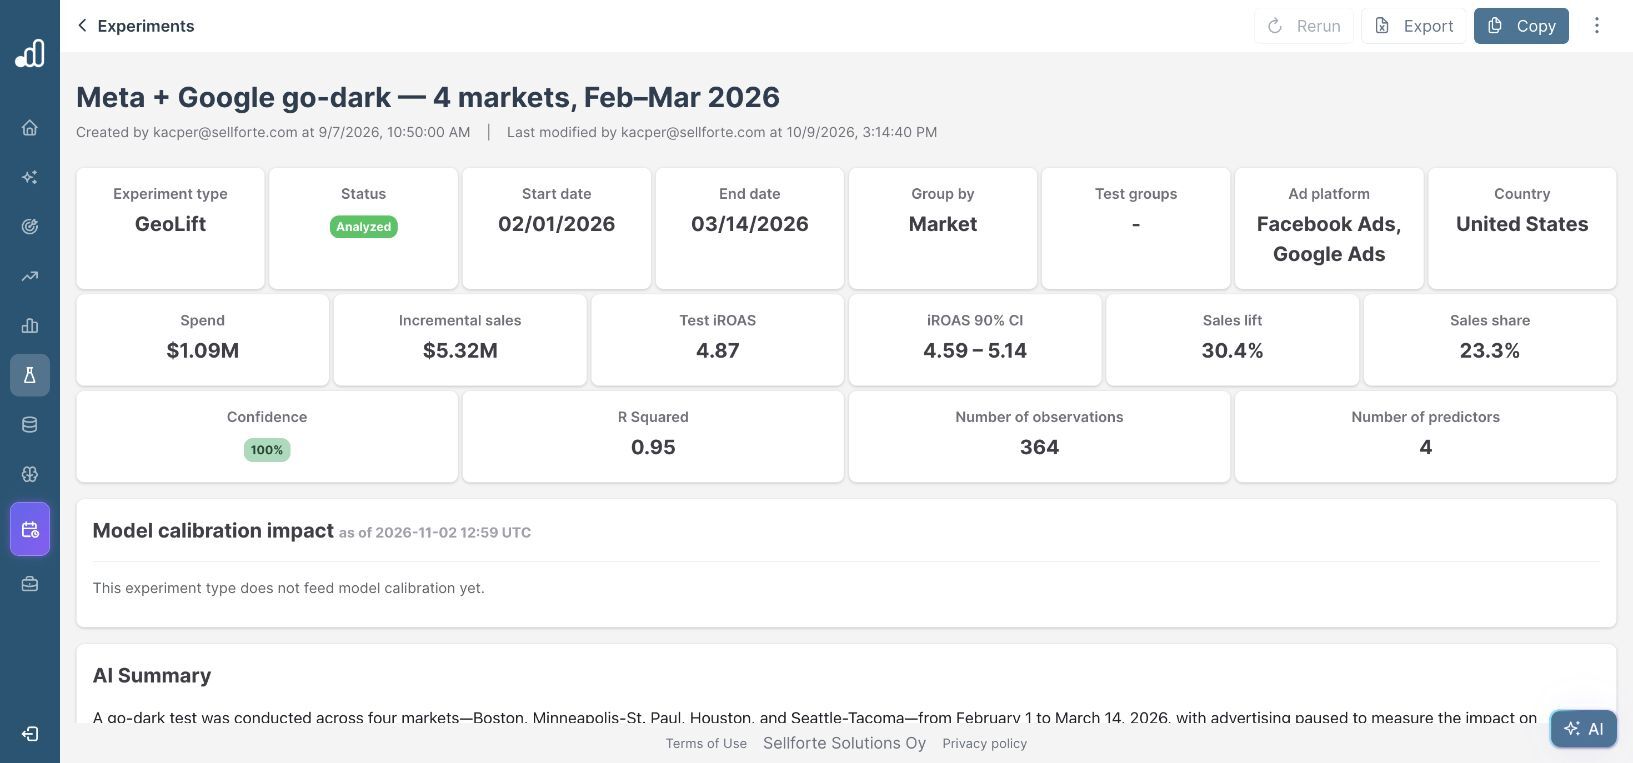
Check the charts below the summary. Target KPI vs Scaled Counterfactual lets you inspect the historical match and the separation during treatment. Target Media Investment vs Scaled Counterfactual shows whether spend changed as intended.
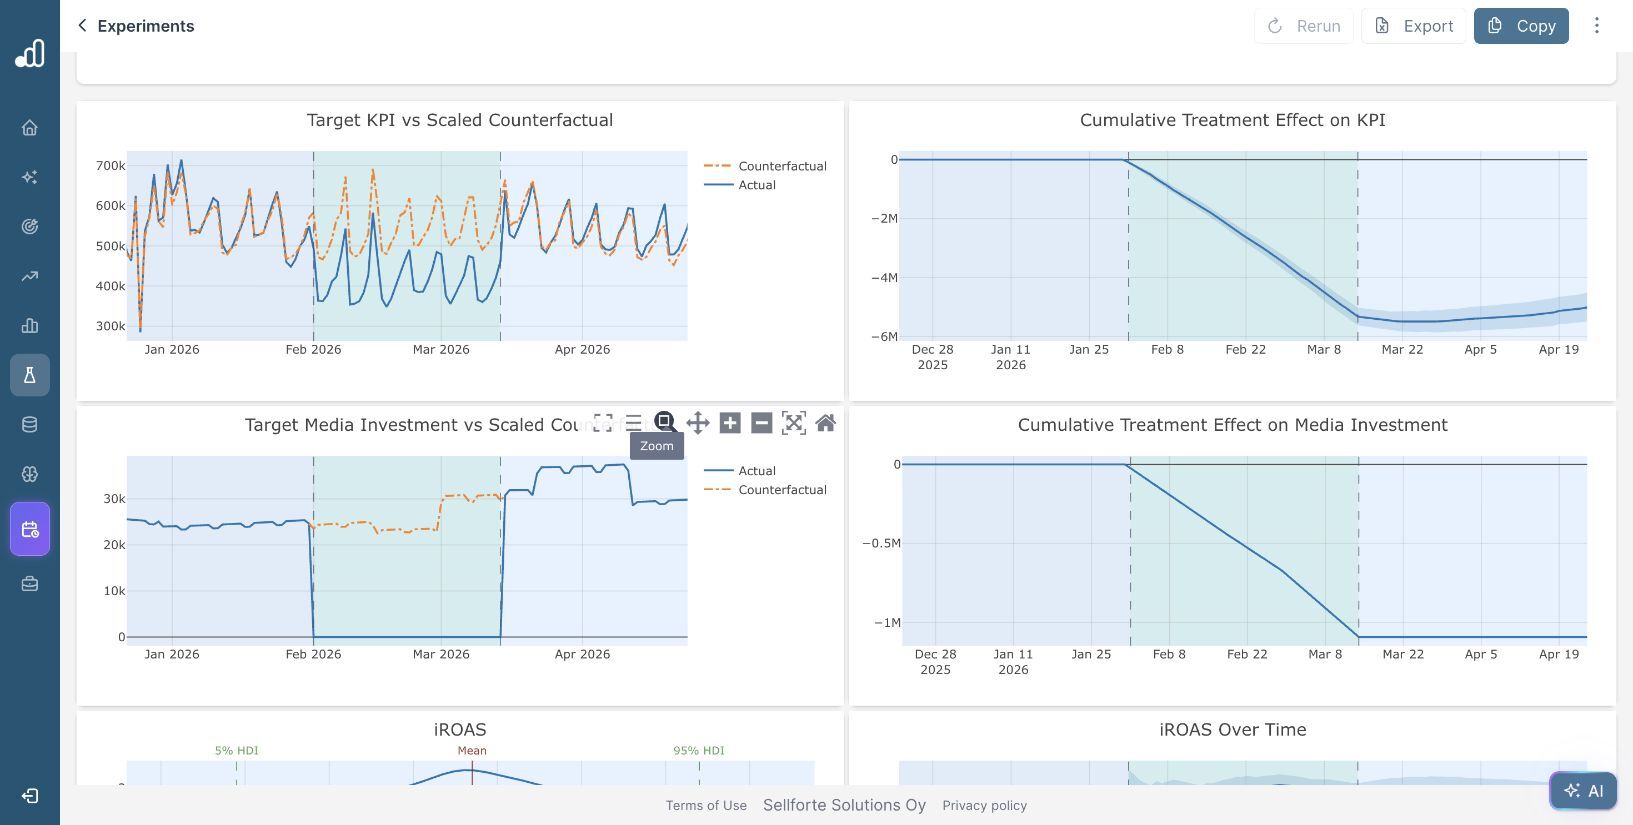
In this go-dark example, spend falls during treatment and actual sales fall below the counterfactual. The cumulative charts show negative changes, while the headline cards display positive magnitudes. Read the direction of the intervention alongside the return. The result does not mean that pausing advertising generated additional sales.
The completed demo’s detailed group tables are empty, so they cannot verify the exact region setup. Check your own saved group selections before using an analysis for a decision. Do not reconstruct missing scope from an AI-generated summary.
6. Keep the setup and conclusion together
Use Comments to record the intervention, relevant execution issues, baseline choices and the decision the test informs. Keep the experiment URL with the readout so others can revisit the settings and evidence.
For the full interpretation of a completed result, continue with how to analyze your latest geo test. If the result is too uncertain for your decision, use the inconclusive-test review guide before deciding what to investigate or test next.
Further Reading and Resources
About the author

Lauri Potka is the Chief Operating Officer at Sellforte, with over 15 years of experience in Marketing Mix Modeling, marketing measurement and media spend optimization. Before joining Sellforte, he worked as a management consultant at the Boston Consulting Group, advising some of the world’s largest advertisers on marketing optimization. Follow Lauri on LinkedIn.
How to Analyze an A/B Test from Your Own Files
How to Import and Analyze a Meta Conversion Lift Study