

Incrementality Testing Use Case

To compare geo-test results across markets in Sellforte, find the regional analyses in Experiments, check that they concern the same intervention, and compare incremental sales, spend, iROAS and uncertainty. Use the market differences to identify where further investigation is useful before changing regional budgets.
This guide uses four regional readouts of the same Meta + Google go-dark experiment in the public Sellforte demo. All figures and screenshots use simulated data.
Before you start: You need completed regional analyses, the experiment assignments and a consistent KPI. Confirm which media changed and when in each market.
What you will produce: A regional comparison and a practical follow-up that reflects uncertainty rather than a simple ranking.
1. Find the regional analyses
Open Experiments and search for Go-dark readout. The demo returns analyses for Phoenix, Atlanta, Detroit and Philadelphia. Each uses GeoLift for the February 1–March 14, 2026 treatment period.
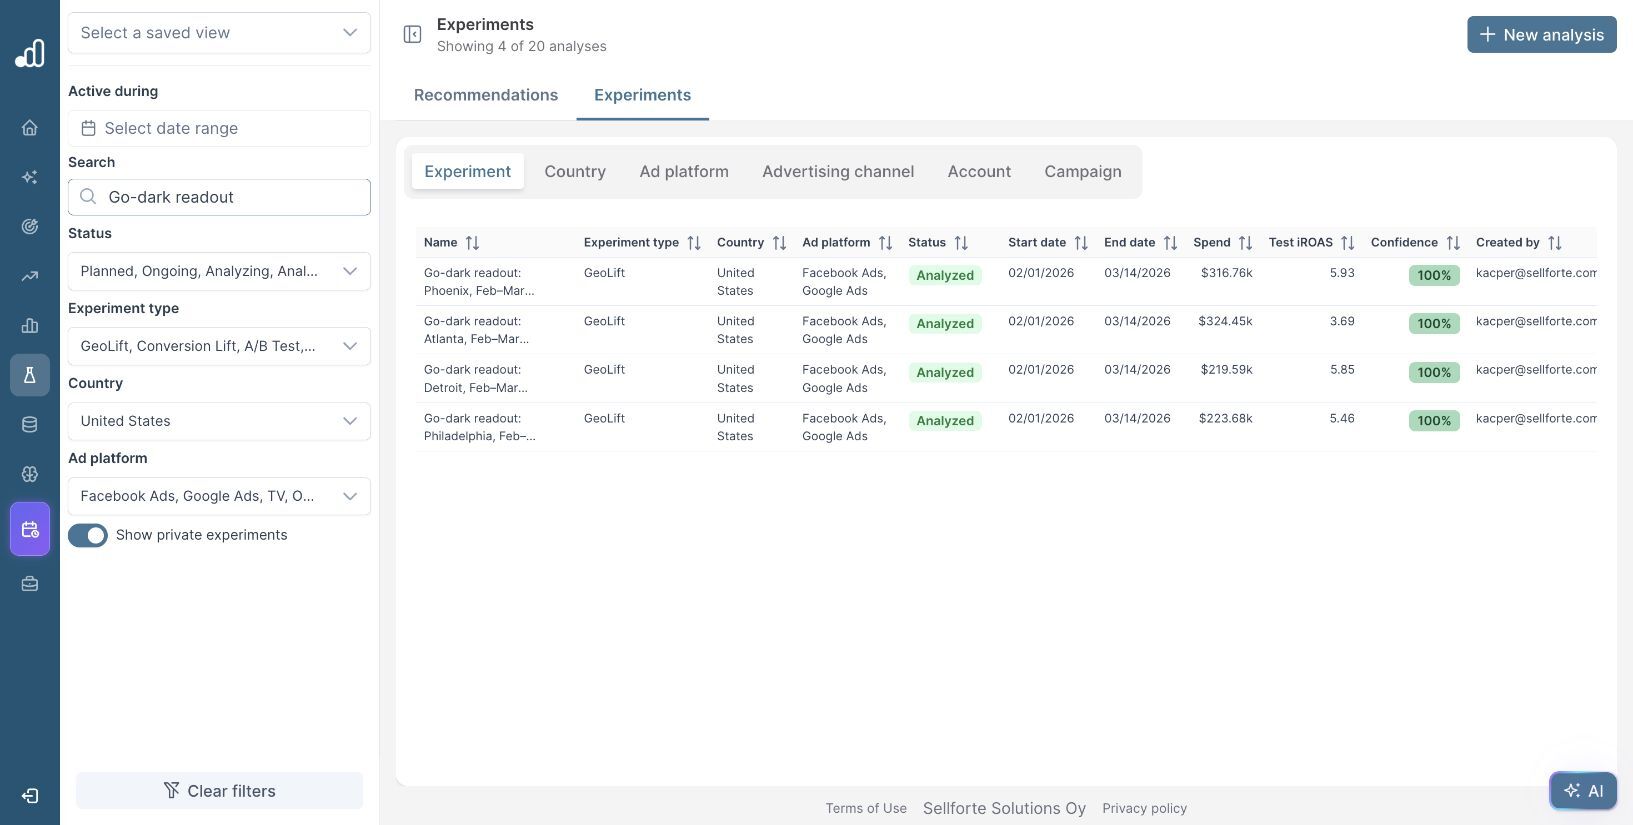
Open each result and confirm the country and media scope. These records are all in the United States and cover Facebook Ads plus Google Ads. Keep the analysis links together so anyone reviewing your comparison can return to the source.
Search names help locate the records, but names alone do not establish comparability. Check the underlying region assignments and experiment plan. The country filter identifies the US; it does not itself distinguish Phoenix from Atlanta.
2. Check that the analyses answer the same question
Before comparing return, align the fields that determine what each number means:
- Intervention: the same media change, including which platforms were reduced or paused.
- Outcome: the same sales or other KPI definition, currency and reporting coverage.
- Timing: the same treatment dates and compatible cooldown assumptions.
- Analysis: compatible pretreatment windows and valid controls for each market.
The four demo records each show 364 observations and eight predictors. Those counts are useful checks, but they do not prove that every model used identical controls or that each control was unaffected by treatment. Review the saved setup and operational record for that detail.
If the dates, KPI or media scope differ, label the comparison accordingly. A regional comparison of one experiment is different from comparing unrelated tests run in different seasons.
3. Record the market results and their intervals
Open Phoenix and read the headline cards. Its test iROAS is 5.93, with a displayed interval of 5.67–6.20. Record spend and incremental sales as well, so the return remains connected to the size of the intervention.
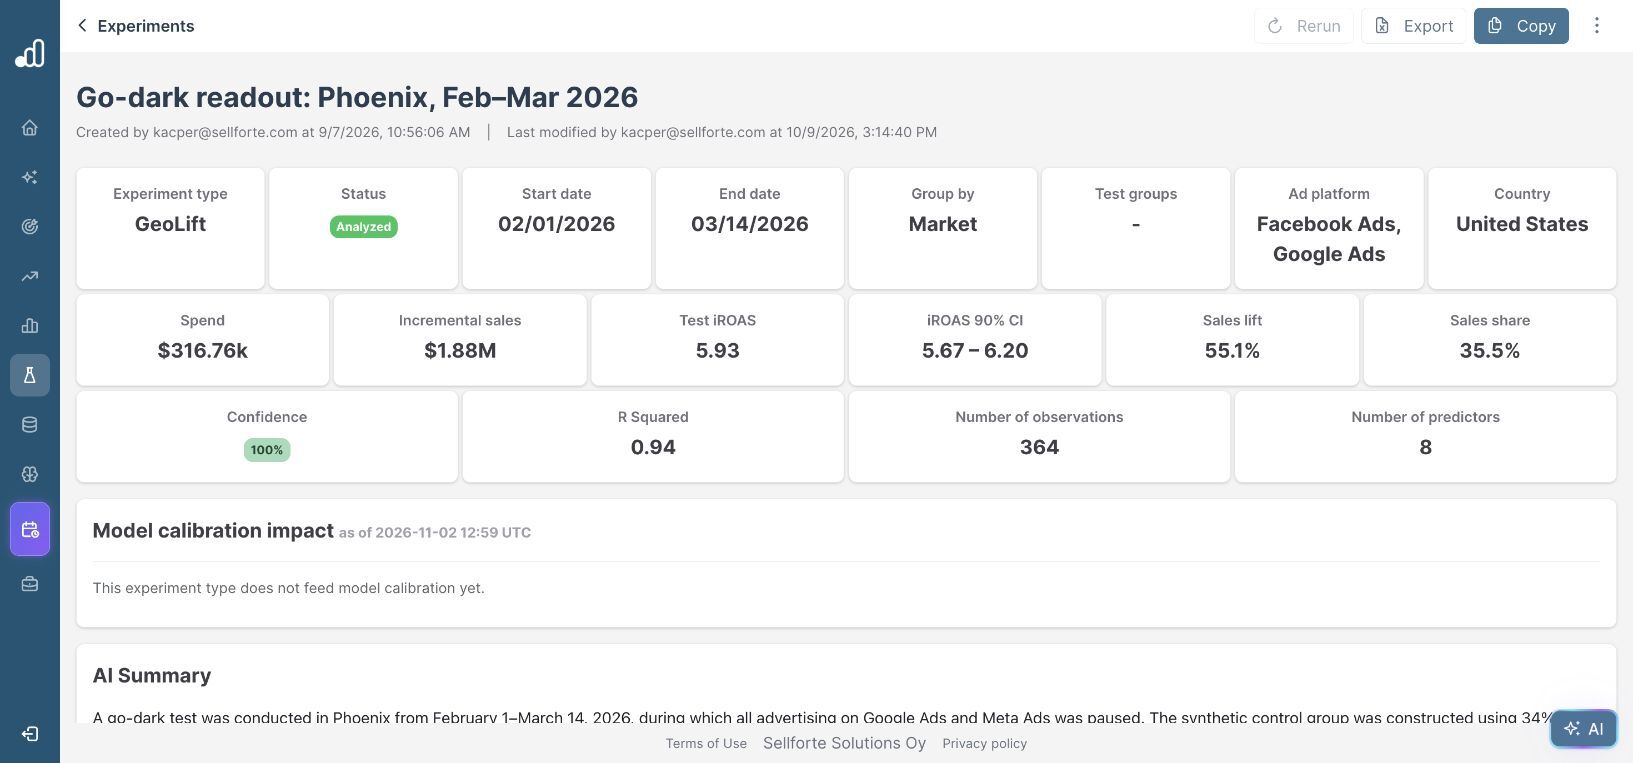
Repeat the same process for the other markets. The demo results are:
| Market | Incremental spend | Incremental sales | iROAS (interval) |
|---|---|---|---|
| Phoenix | $316.76k | $1.88M | 5.93 (5.67–6.20) |
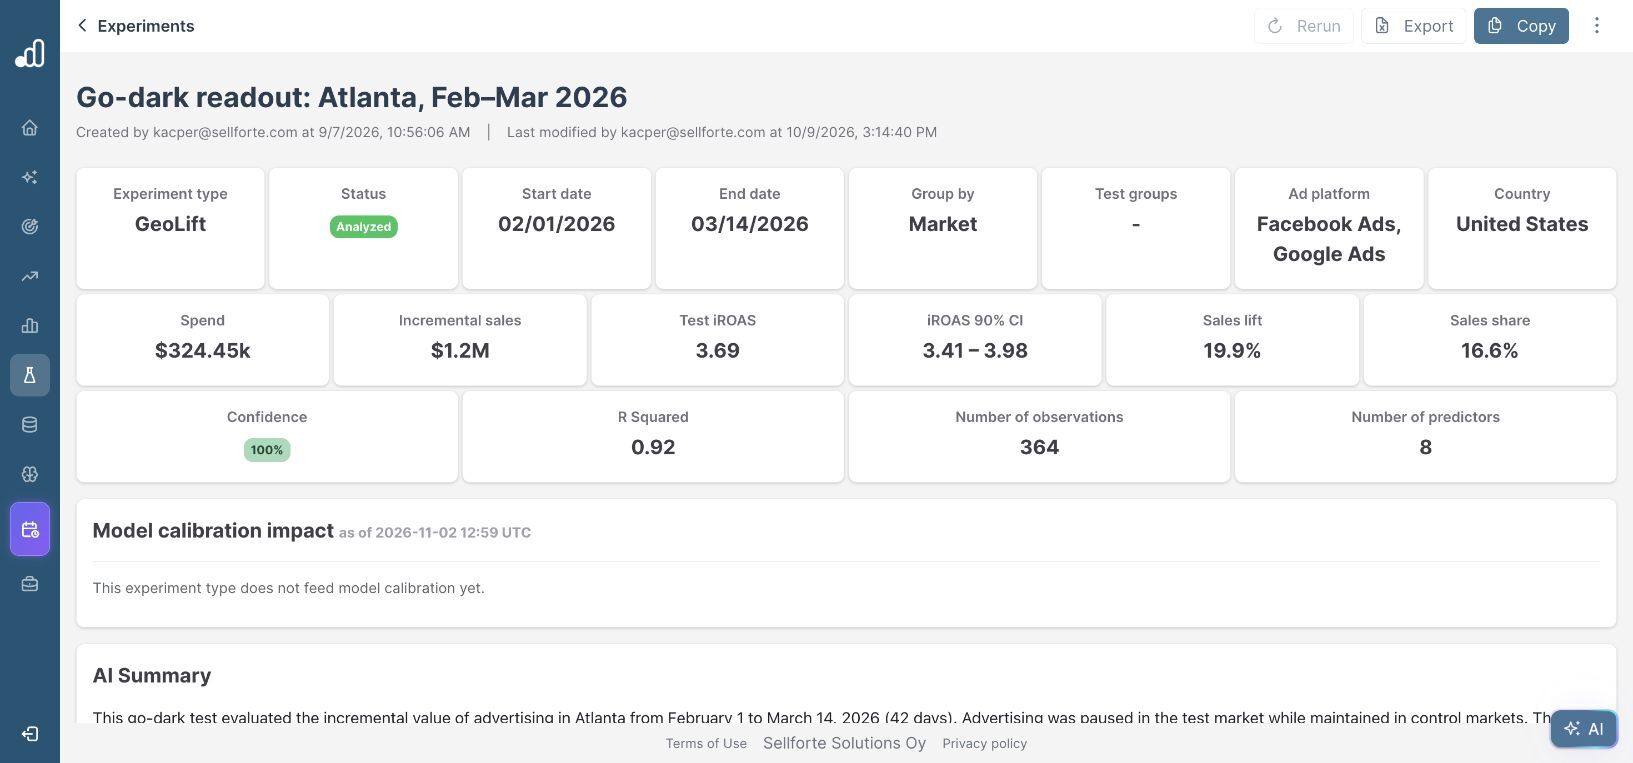
| Atlanta | $324.45k | $1.20M | 3.69 (3.41–3.98) |
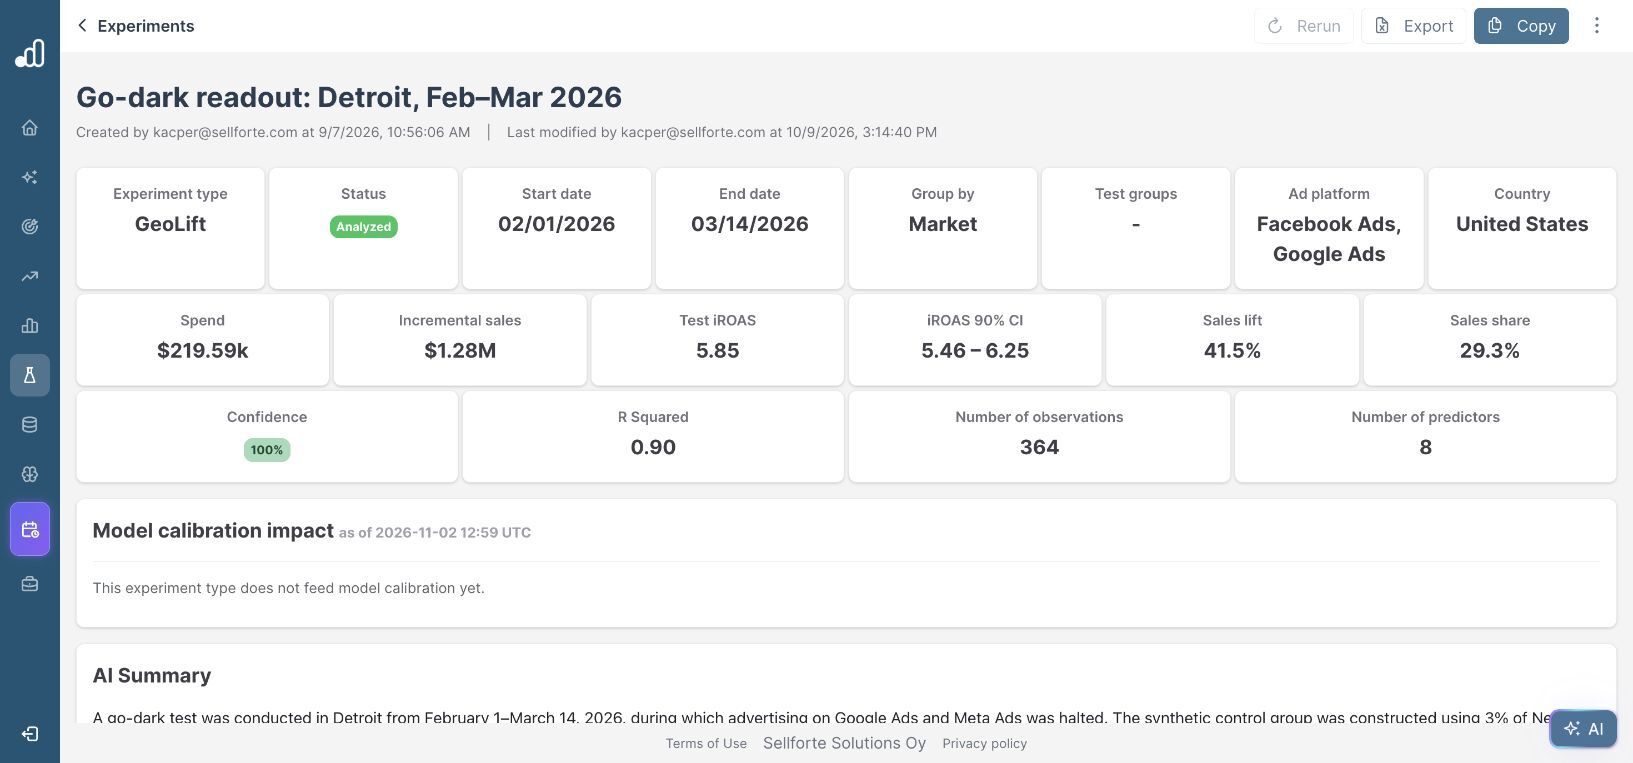
| Detroit | $219.59k | $1.28M | 5.85 (5.46–6.25) |
| Philadelphia | $223.68k | $1.22M | 5.46 (5.17–5.76) |
The figures above follow the rounded headline cards. Do not expect a ratio calculated from rounded sales and spend to reproduce every displayed decimal exactly.
4. Separate a useful signal from a precise ranking
Phoenix has the highest point estimate, but it is only 0.08 above Detroit. Their displayed intervals overlap substantially. That is insufficient evidence for a strong claim that Phoenix is the better-performing market.
Atlanta is a more useful investigation candidate. Its iROAS estimate is lower than the other three, and the displayed interval is also lower. Open its result and inspect the spend and KPI charts for delivery differences, unusual local events or a mismatch between the experiment plan and execution.
The interval comparison is descriptive. It is not a formal statistical test of the difference between markets, particularly when regional analyses share controls or other sources of uncertainty. If a major allocation decision depends on that difference, assess it with the relevant analysis support.
Ask practical questions: Did both platforms actually go dark to the same extent? Were there regional promotions, stock constraints or store changes? Were customer and campaign mixes comparable? These are explanations to check, not conclusions supplied by the return ranking.
5. Keep regional and pooled results separate
A pooled analysis of all test markets answers a different question from four separately fitted regional analyses. Its estimated counterfactual may therefore produce a result that differs from the sum of the regional estimates.
Do not take the simple average of the four iROAS values as the overall experiment return. Where aggregation is appropriate, it requires consistent incremental sales and spend definitions and a treatment of joint uncertainty. Use the approved pooled analysis for the overall readout and the regional analyses to understand variation.
These results also concern the combined Meta and Google intervention. They cannot establish that Meta alone caused the regional difference.
6. Translate the comparison into a follow-up
“All four regional readouts show positive incremental return for the combined Meta and Google activity. Atlanta’s estimate is materially lower and deserves a delivery and local-market review. Phoenix and Detroit are close, with overlapping intervals, so the comparison does not justify a precise ranking between them.”
Use that readout to direct investigation or design a follow-up test. For the next budget dollar, also review marginal incremental ROAS (miROAS). Average return measured during an experiment does not by itself tell you the return from adding more spend today.
If the regional conclusion depends heavily on control selection or the analysis window, follow the geo-test robustness guide before treating the difference as a planning input.
Further Reading and Resources
Review the regional evidence
About the author

Lauri Potka is the Chief Operating Officer at Sellforte, with over 15 years of experience in Marketing Mix Modeling, marketing measurement and media spend optimization. Before joining Sellforte, he worked as a management consultant at the Boston Consulting Group, advising some of the world’s largest advertisers on marketing optimization. Follow Lauri on LinkedIn.


