

Incrementality Testing Use Case

To investigate a difference between test iROAS and MMM iROAS in Sellforte, open the experiment result and the MMM dashboard side by side. Align the dates, market, media scope and sales definition, then compare the estimates with the test’s uncertainty and the remaining scope differences visible.
This guide uses the July 2026 US Meta Prospecting study in the public Sellforte demo. All figures and screenshots are simulated. The example deliberately retains scope differences that need checking; matching the dates and channel name does not make the two measurements identical.
Before you start: You need access to the experiment result, its original study and MMM. Keep the source outcome, campaign scope and study dates available.
What you will produce: A documented comparison with matching filters, remaining scope differences and a clear next action.
1. Record the experiment’s result and scope
Open Experiments, find the July Meta Prospecting repeat study and open its result. The study ran from July 5 to August 1, 2026 in the United States. Its headline cards show:
- Incremental media spend: $288.61k.
- Incremental sales: $890k.
- Test iROAS: 3.08, with a displayed interval of 2.68–3.48.
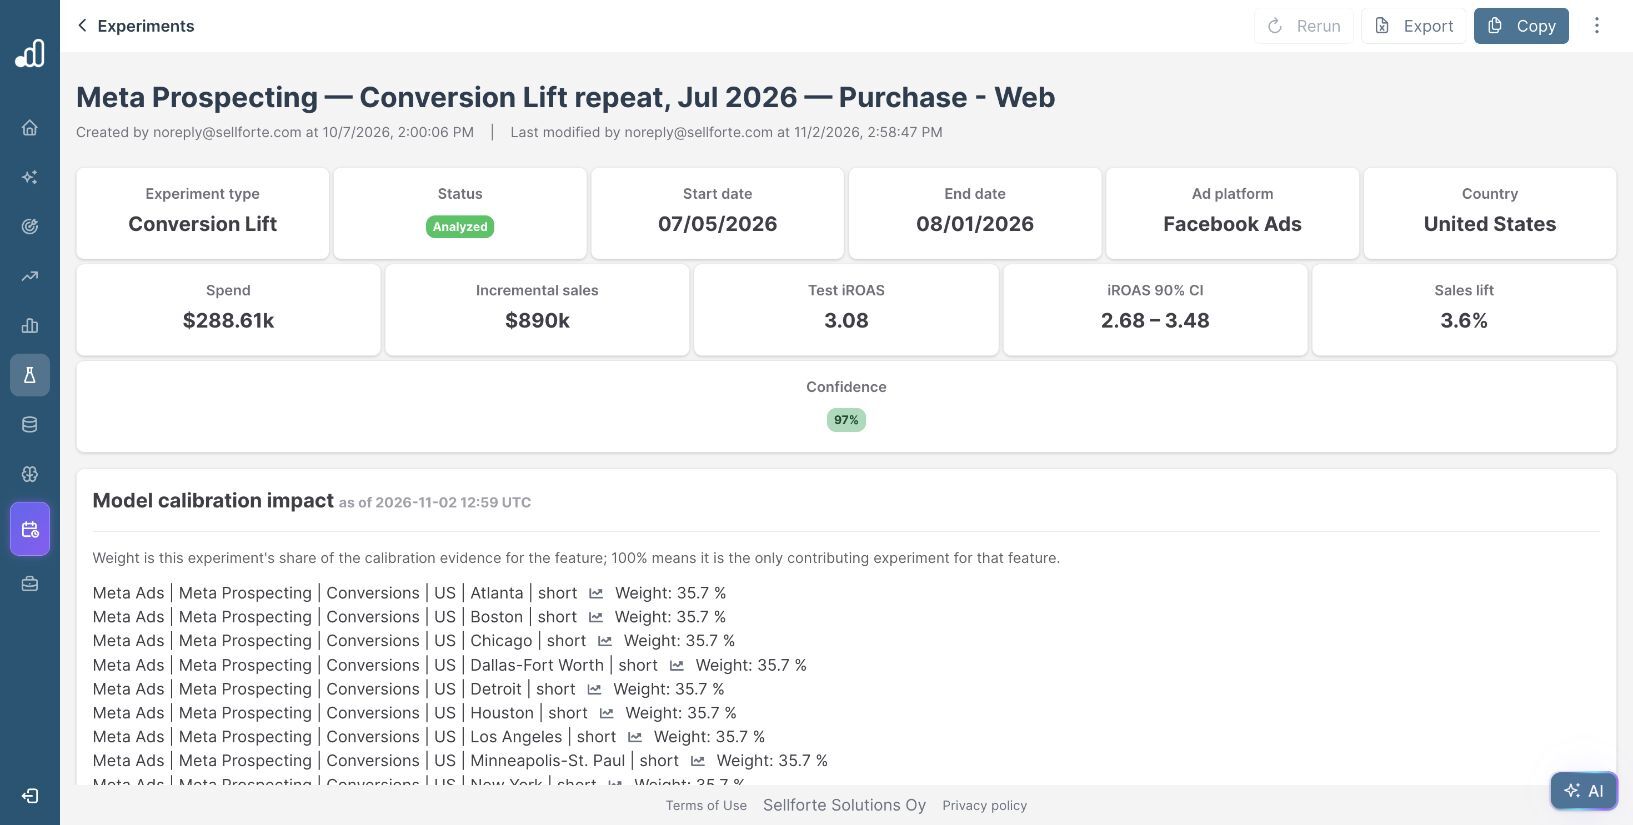
Check the original study for its campaign and ad-set coverage, holdout population and measured conversion event. This example’s study name identifies Purchase–Web. Confirm whether the recorded sales include the same transactions, value adjustments and measurement window as the MMM outcome.
Use the result cards and source study as the numerical reference. If a narrative summary differs from the cards, resolve that discrepancy before sharing a conclusion. The Meta Conversion Lift guide covers the initial source checks.
2. Match the MMM period and channel
Open MMM in the left navigation. Set the date range to July 5–August 1, 2026, choose Advertising channel as the primary grouping, and keep Country set to US.
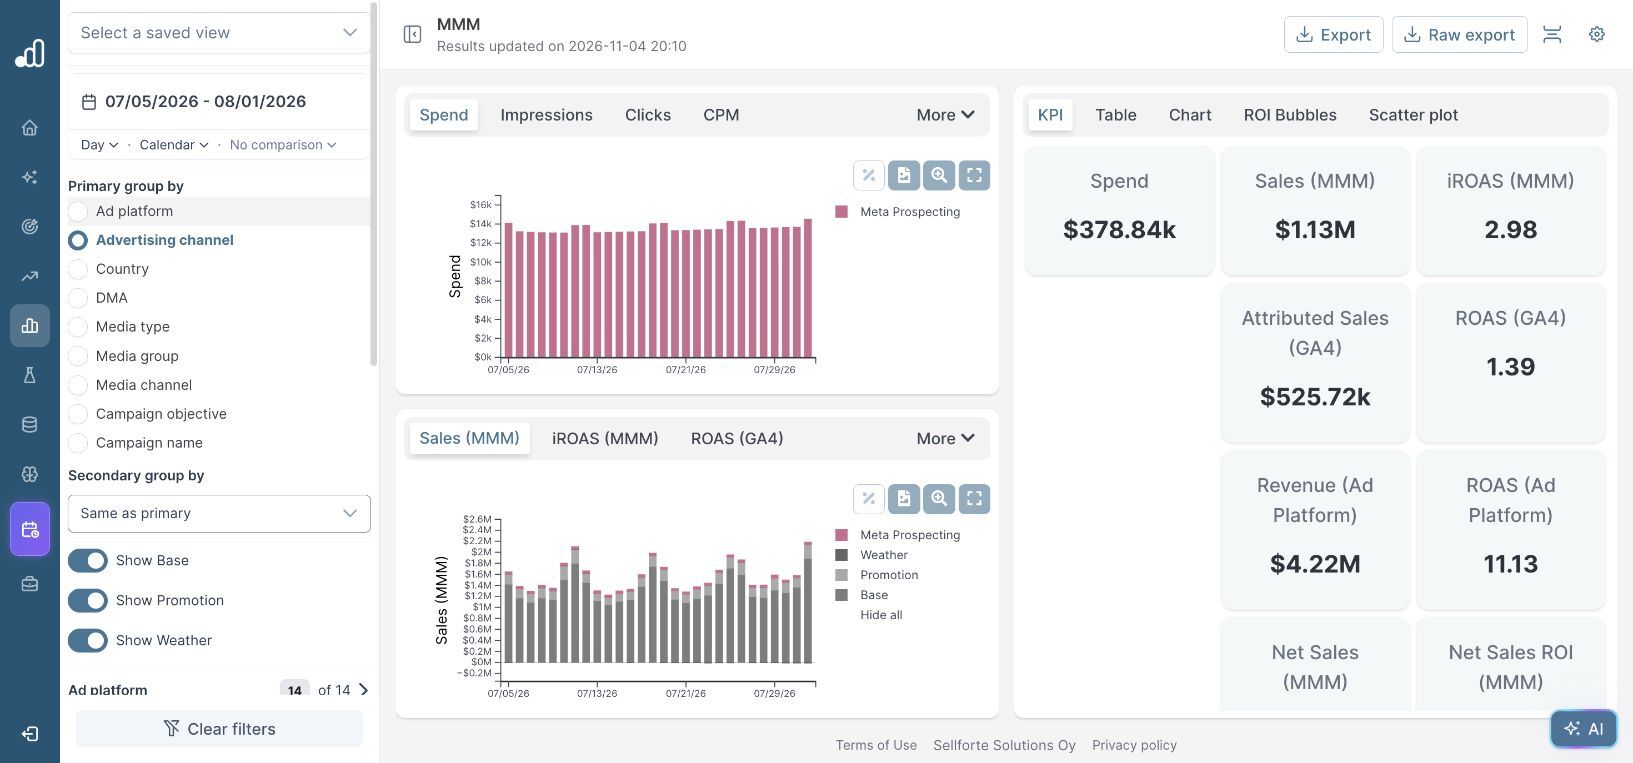
Expand the Advertising channel filter, deselect the existing selection and select Meta Prospecting. Open the KPI view to read the filtered headline metrics. The Table view also lets you inspect the channel row alongside spend and sales.
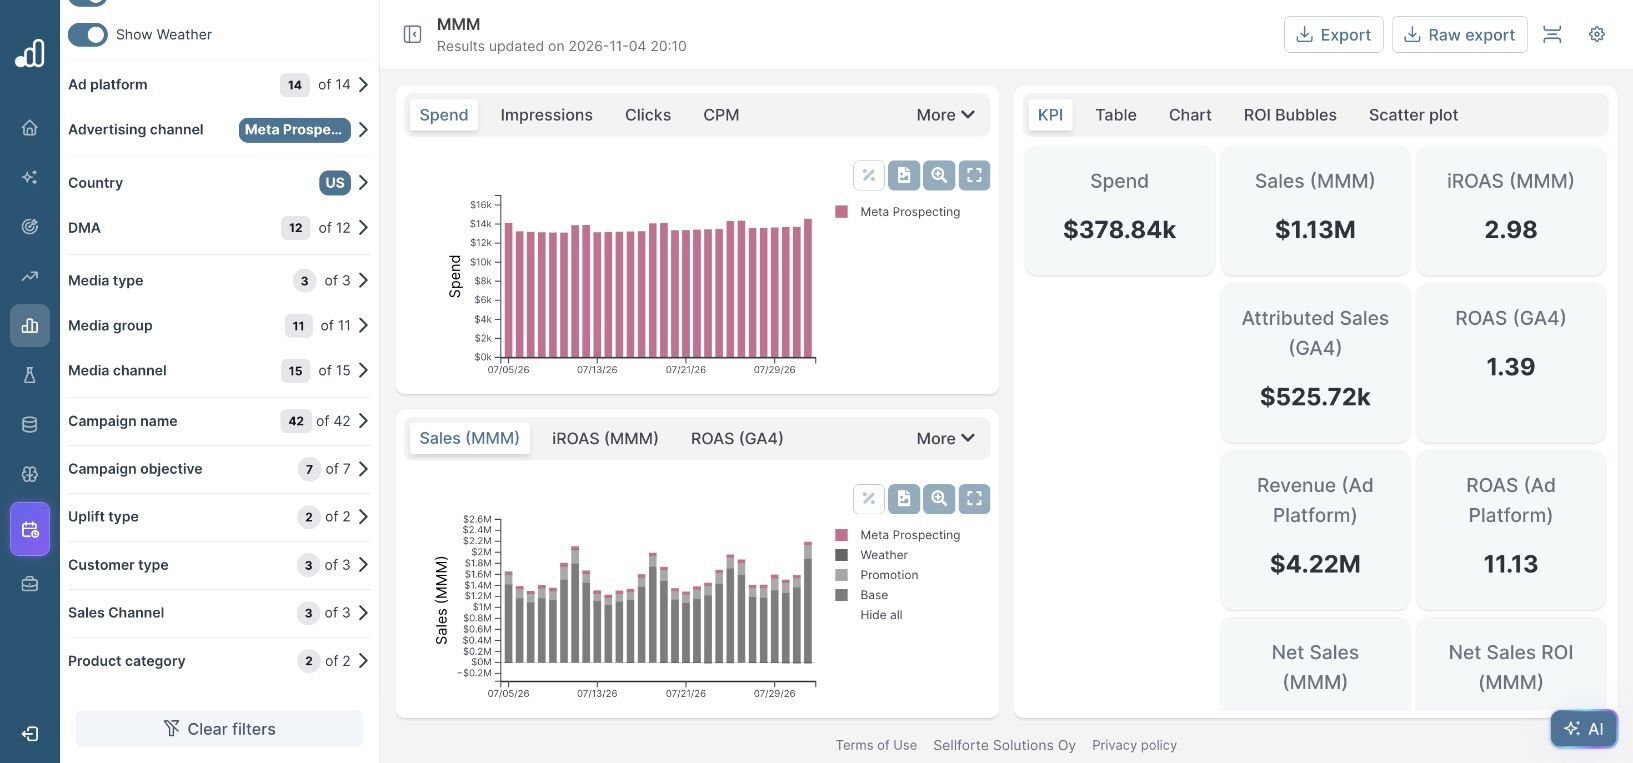
The demo shows $378.84k spend, approximately $1.13 million Sales (MMM) and 2.98 iROAS (MMM). The table gives Sales (MMM) as $1,127,205. Read iROAS (MMM) for this comparison: the neighboring GA4 and ad-platform ROAS cards use different measurement approaches.
Review the other filters before taking a screenshot or export. The example still includes all 12 DMAs, both uplift types and all available sales channels and customer types. That is a channel-level reference, not a claim that the scope already matches the platform study.
3. Reconcile the definitions before the numbers
| Check | What to reconcile |
|---|---|
| Media and audience | The tested campaigns, ad sets and eligible holdout population versus the campaigns included in the MMM channel. |
| Outcome | Web purchases versus all sales; gross or net revenue; returns, currency and conversion values. |
| Geography | The study population versus the selected country and regional coverage. |
| Timing | Treatment dates, conversion observation window, cooldown and modeled carryover. |
| Return definition | Incremental sales and the relevant spend denominator, rather than margin, attributed revenue or lifetime value. |
The spend mismatch is a useful clue: $288.61k in the study versus $378.84k in the channel view. It warrants checking campaign coverage, study scaling and spend definitions. The screenshot alone does not establish which explanation applies.
Where the model exposes the required campaign, sales-channel or uplift-type filters, narrow the view to a defensible comparison. If the study’s audience or outcome cannot be reproduced in MMM, document that limitation instead of presenting a fully matched comparison.
4. Put the difference alongside uncertainty
| Measure | Experiment | MMM channel view |
|---|---|---|
| Period | July 5–August 1, 2026 | July 5–August 1, 2026 |
| Spend shown | $288.61k | $378.84k |
| Incremental sales shown | $890k | $1,127,205 |
| iROAS | 3.08 | 2.98 |
| Displayed iROAS interval | 2.68–3.48 | Not shown in this KPI view |
The point-estimate difference is 0.10, about 3% of the test estimate. The MMM estimate lies within the study’s displayed interval. This example therefore does not show a large numerical conflict, even before the remaining scope differences are resolved.
That observation is not a formal agreement test. The comparison has uncertainty on both sides, and the MMM KPI view shown here does not display its interval. Equally, an MMM estimate outside the test interval would be a reason to investigate, rather than automatic proof that either measurement is wrong.
5. Check calibration status and model timing
Review the experiment’s calibration information where available, and note the Results updated on timestamp in MMM. Establish whether the relevant study is included in the model version you are reviewing before describing the result as calibrated.
Calibration uses experiment evidence to inform the model. It does not require a channel’s dashboard iROAS to equal one study’s point estimate. The scope, uncertainty and other evidence still matter. Follow the MMM calibration guide or ask your Sellforte contact to review the mapping and model version when these are unclear.
Do not change a study’s scope or analysis settings merely to make the two numbers agree. Correct data or mapping issues on their merits, then repeat the comparison with the corrected definitions.
6. Document the finding and next action
“The July US Meta Prospecting study reports iROAS of 3.08 (2.68–3.48). MMM shows 2.98 for the same dates and channel. The estimates are close, but the spend denominators and outcome coverage differ. Check campaign, web-sales and uplift scope, then confirm the model’s use of the study before drawing a calibration conclusion.”
If a material difference remains after those checks, bring the study export, analysis link, MMM filters and model timestamp to the review. For a budget increase, use miROAS and the current response curve as well; neither historical average return directly specifies the return from the next dollar.
Further Reading and Resources
Read and compare the source evidence
Understand calibration and budget decisions
About the author

Lauri Potka is the Chief Operating Officer at Sellforte, with over 15 years of experience in Marketing Mix Modeling, marketing measurement and media spend optimization. Before joining Sellforte, he worked as a management consultant at the Boston Consulting Group, advising some of the world’s largest advertisers on marketing optimization. Follow Lauri on LinkedIn.


