MMM Use Case

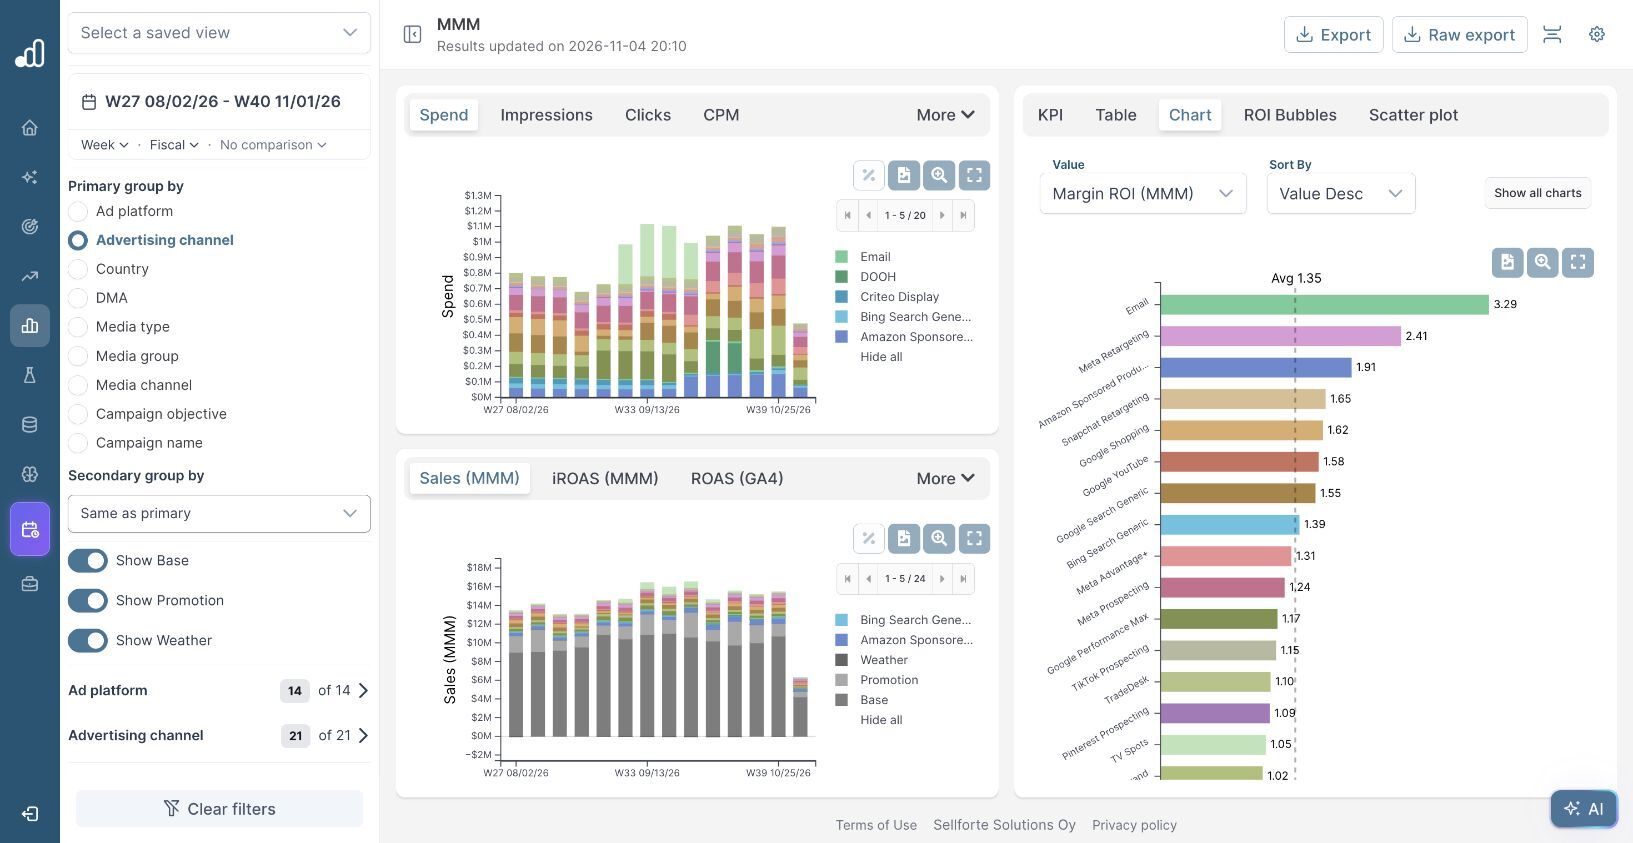
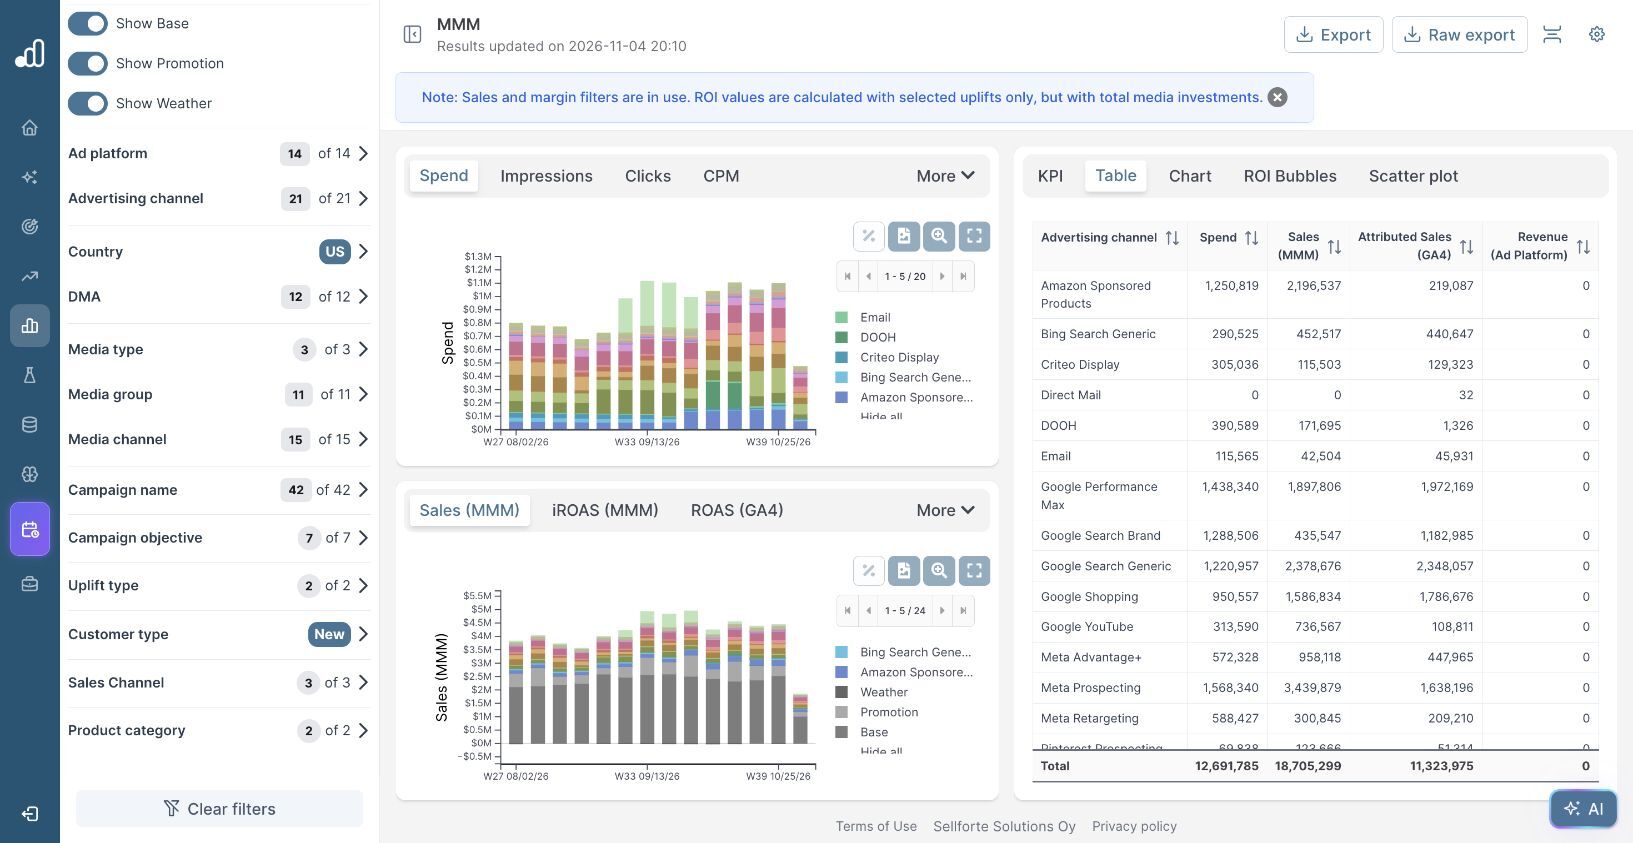
To separate promotion uplift from media-driven sales, open the Sales (MMM) chart in Dashboards → MMM with Show Base and Show Promotion enabled. Compare the modeled contributions across weeks to see how much of a sales peak came from promotions, media or underlying demand.
The screenshots and figures use simulated data from the public Sellforte demo. The dashboard is set to US and the displayed period W27 August 2 to W40 November 1, 2026.
Before you start: MMM results with promotional activity included and promotion contribution available separately.
What you will produce: A comparison of promotion and media contributions that explains a change in weekly sales.
1. Show the full sales decomposition
Open MMM, choose Ad platform as the primary grouping and leave all media selected. Keep the chart on Sales (MMM). Enable Show Base, Show Promotion and, when available, Show Weather.
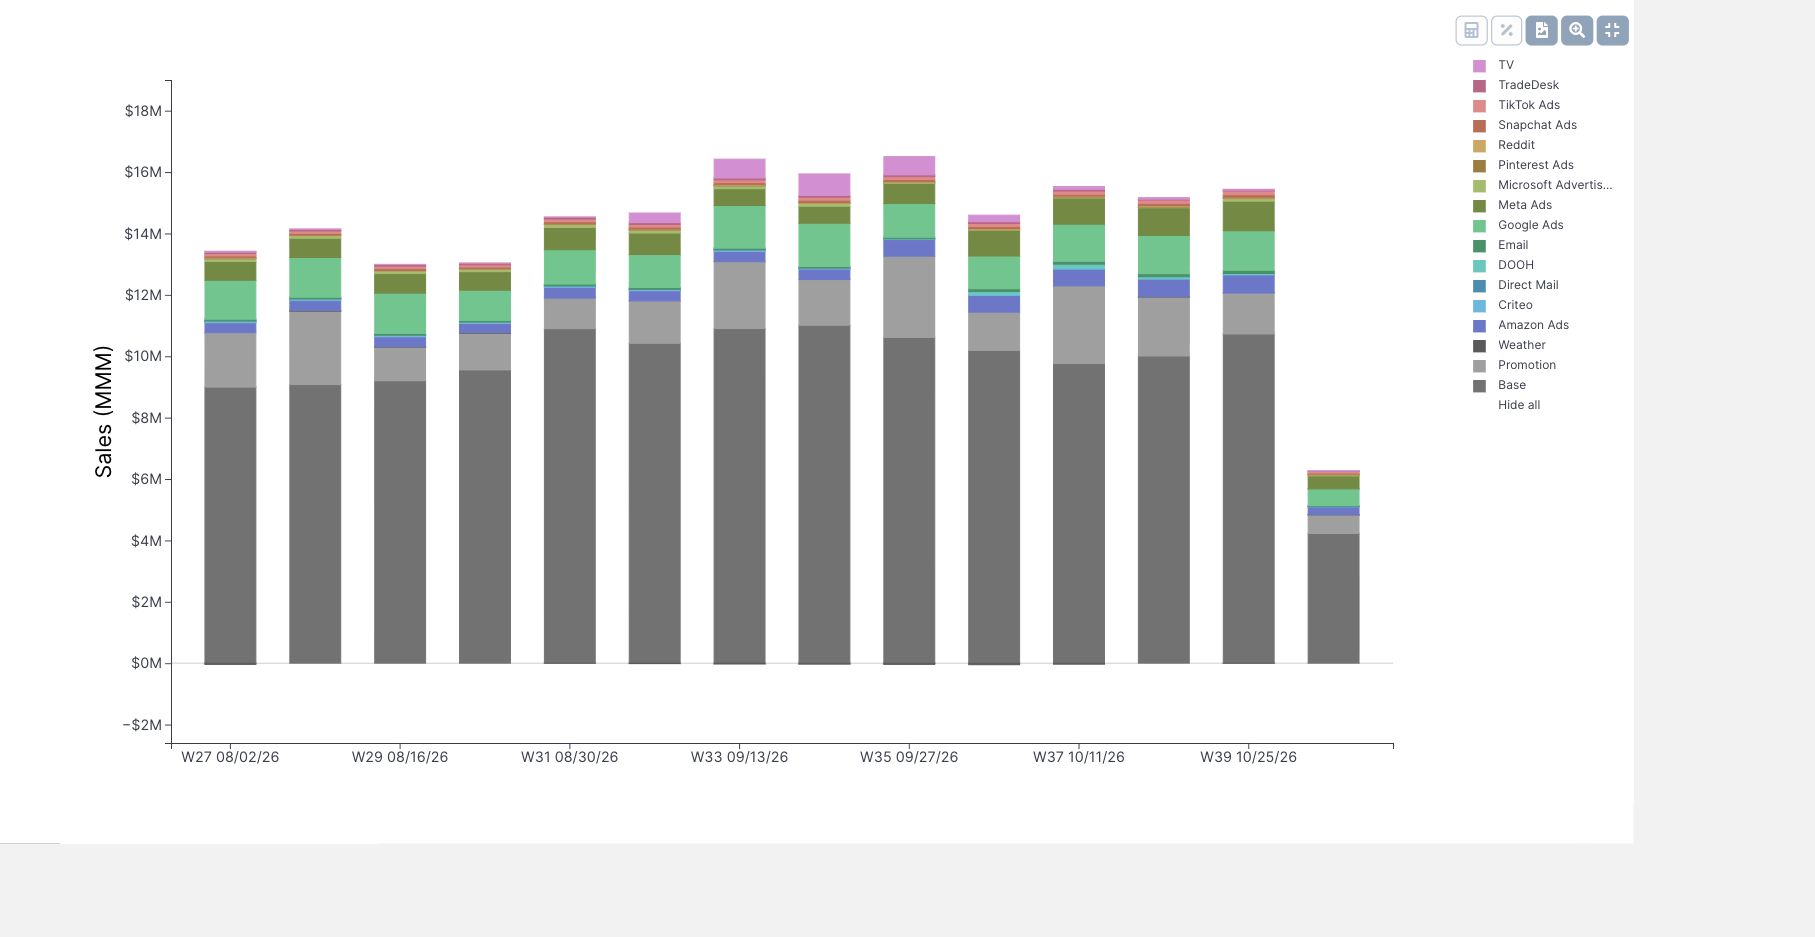
The colored media segments show the model’s estimated advertising contribution. Promotion is a separate segment, and Base represents the short-term sales expected without the modeled media and promotions. Weather appears separately in this demo, including negative contributions in some weeks.
Select the expand control on the Sales (MMM) chart to give the decomposition more space. Move over a weekly bar to inspect the figures.
2. Compare two complete weeks
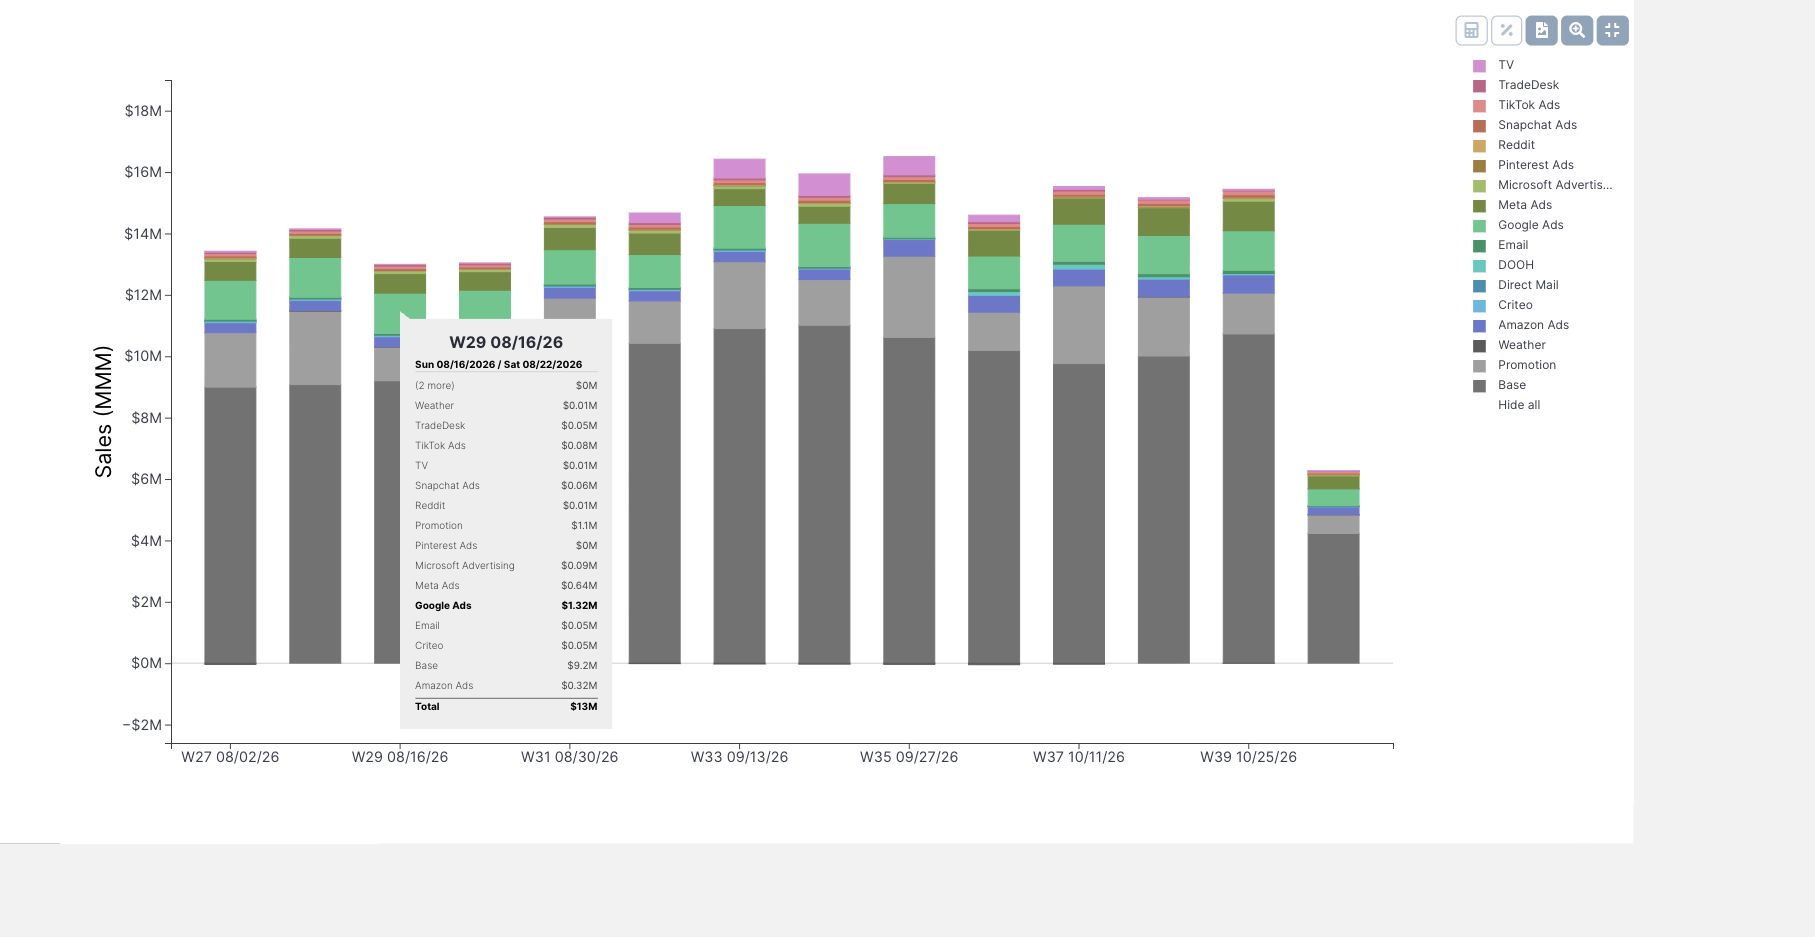
In this example, compare the weeks beginning August 9 and August 16, 2026. Both are complete seven-day weeks. The first has a visibly larger promotion contribution.
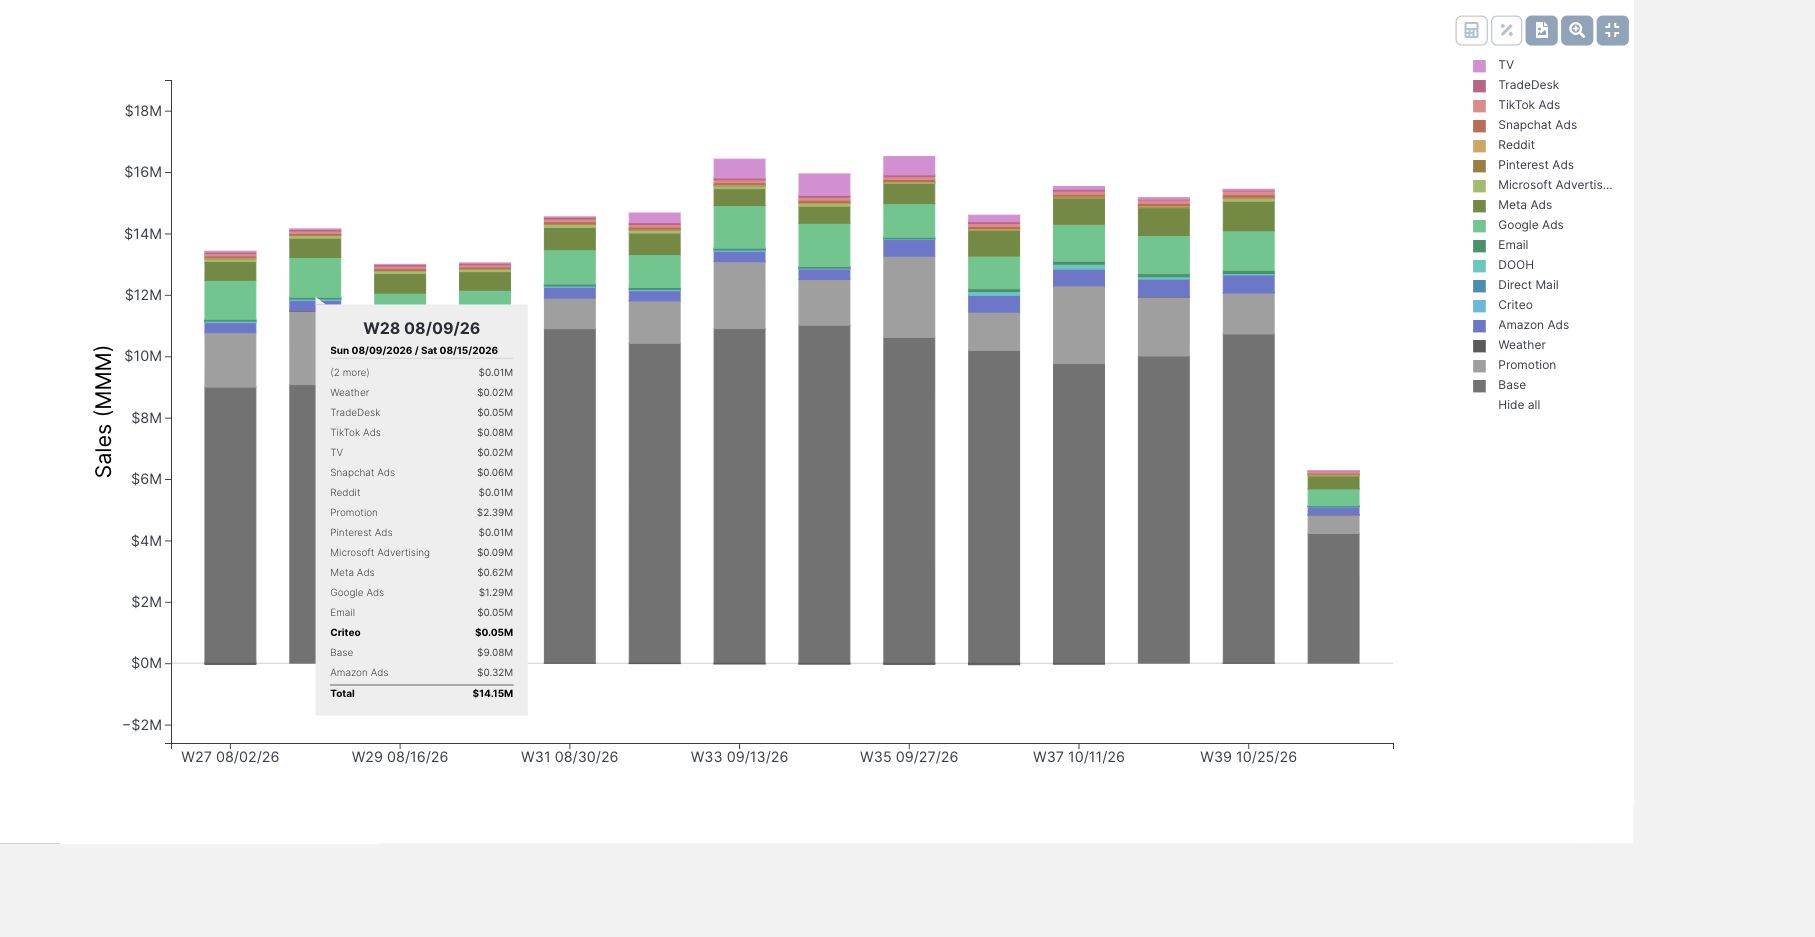
The chart’s tooltip rounds the values. For a precise comparison, use Raw export. Selecting Ad platform as the media dimension gives weekly media rows in the InvestmentsAndUplifts sheet and separate Base sales, Promo sales and Weather Sales columns in the Base sheet. Sum Sales (MMM) across the advertising platforms to get the week’s media contribution.
| Measure | Week beginning August 9 | Week beginning August 16 | Change |
|---|---|---|---|
| Media investment | $777,303 | $771,227 | −$6,076 |
| Media-driven Sales (MMM) | $2,635,547 | $2,674,815 | +$39,268 |
| Promotion-driven sales | $2,394,026 | $1,097,974 | −$1,296,052 |
| Base sales | $9,075,631 | $9,201,151 | +$125,521 |
| Weather contribution | $21,630 | $12,986 | −$8,644 |
Values are rounded to the nearest dollar from the demo export; changes use the unrounded figures. Promotion-driven sales fall by about $1.30M, while modeled media contribution rises by about $39,000. Media spend is almost unchanged. The smaller sales bar in the second week therefore should not be treated as evidence that advertising stopped working.
3. Distinguish promotion uplift from sales during a promotion
Promotion-driven sales are the model’s estimate of the extra contribution associated with promotions. They are different from all sales collected while an offer was running. The same week also contains base demand and media-driven sales.
Compare the contribution amounts when explaining a change. A promotion’s share of total sales can rise because the promotion grows, because another component falls, or both. Reading only the percentage would hide that distinction.
Use the promotion calendar to understand which offers were active and how their intensity differed. The decomposition can show a change in modeled promotion contribution; it does not identify the profitability of a particular discount or establish that every extra sale came from one named offer.
4. Use the split when planning the next promotional period
In this demo comparison, the main change is the reduction in promotion contribution. Cutting media because the total sales bar is smaller would miss the fact that its modeled contribution is slightly higher. Review the offer schedule and the promotion economics before treating the week as a media-performance problem.
For a future promotional period, keep the expected base and promotion contribution explicit in your forecast, then evaluate the media plan against those assumptions. If you are considering deeper discounts, compare the margin consequences as well as sales. If you are considering more advertising, assess its additional expected contribution using the media-budget scenario workflow.
Further Reading and Resources
About the author

Lauri Potka is the Chief Operating Officer at Sellforte, with over 15 years of experience in Marketing Mix Modeling, marketing measurement and media spend optimization. Before joining Sellforte, he worked as a management consultant at the Boston Consulting Group, advising some of the world’s largest advertisers on marketing optimization. Follow Lauri on LinkedIn.
How to Compare New- and Existing-Customer Sales Contribution
How to Measure Digital Advertising’s Impact on In-Store Sales