MMM Use Case

To compare channels by incremental margin, open Dashboards → MMM and compare Margin (MMM) and Margin ROI (MMM) alongside sales and iROAS. This shows how much modeled margin each channel contributes and how much it generates per dollar of media spend.
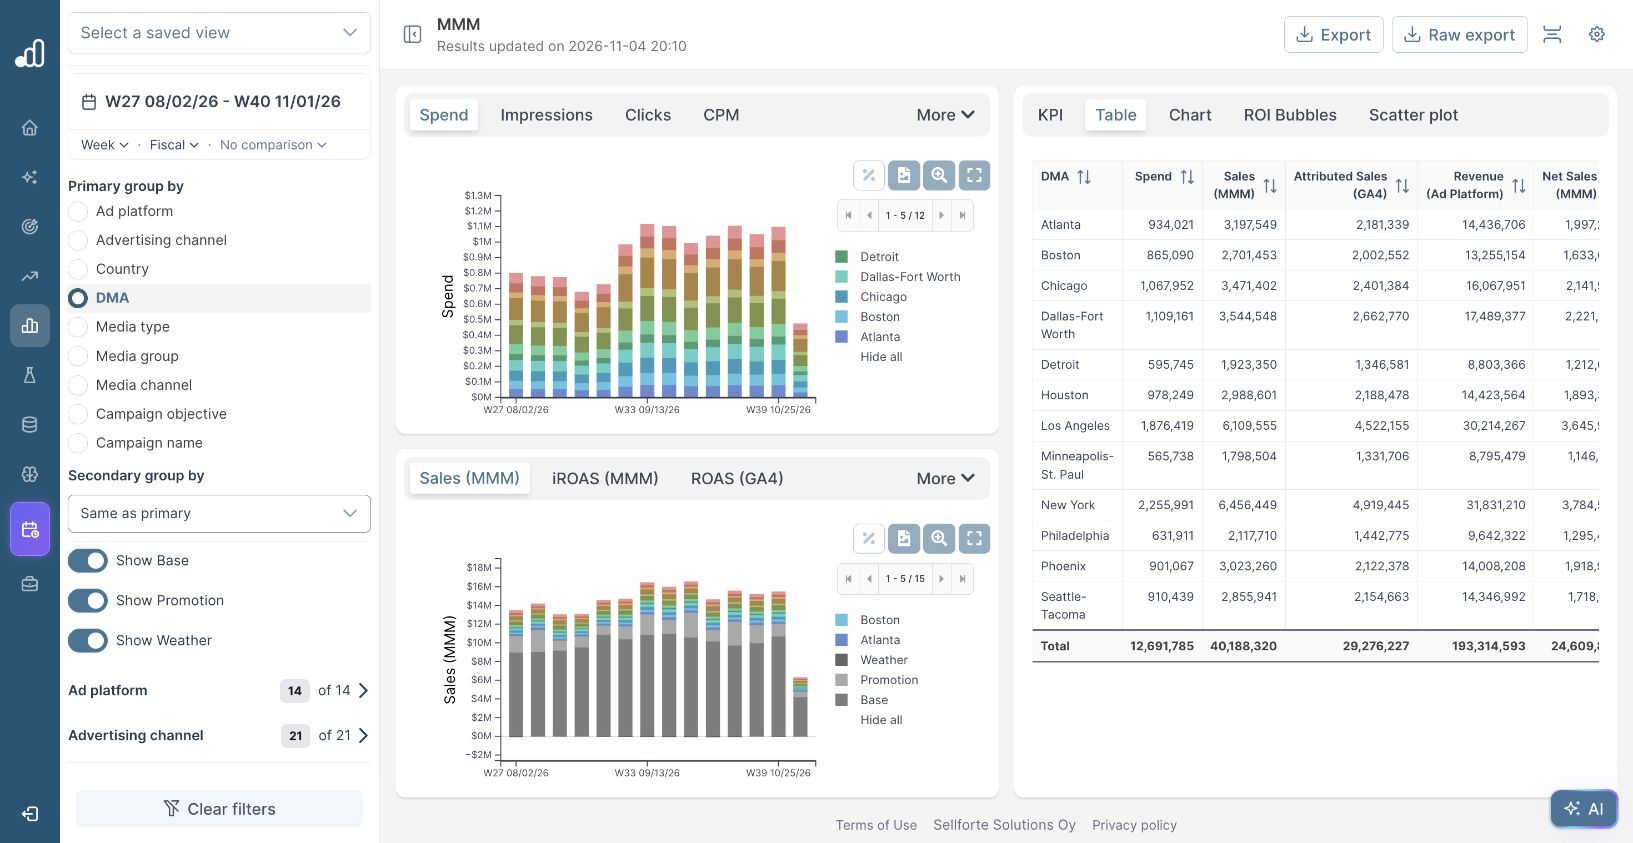
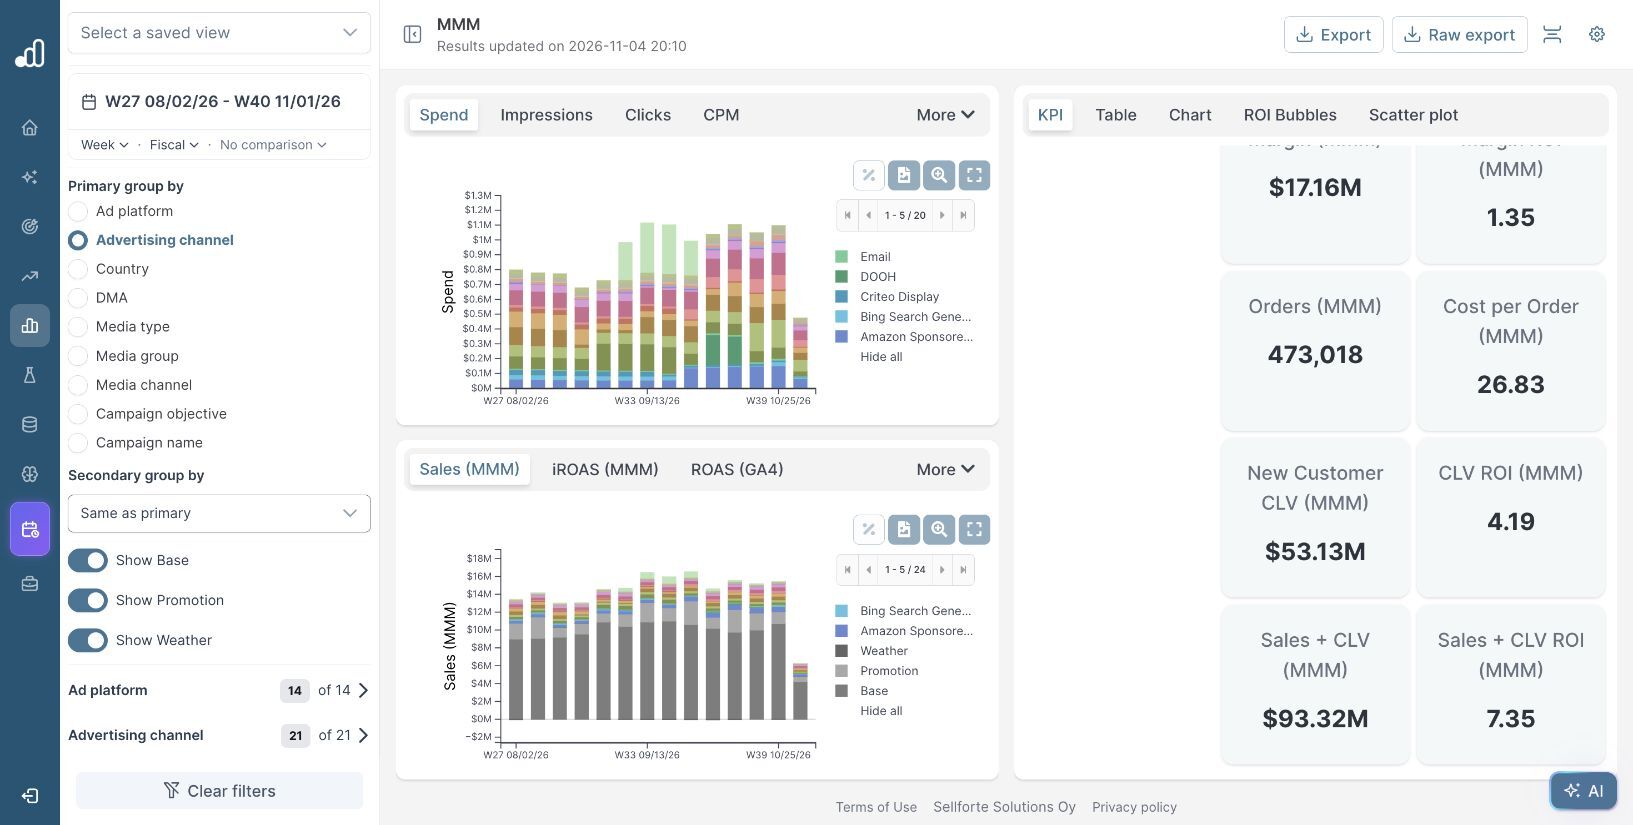
The screenshots and figures use simulated data from the public Sellforte demo. The dashboard is set to US and the displayed period W27 August 2 to W40 November 1, 2026.
Before you start: MMM results with margin metrics configured for the sales you measure.
What you will produce: A channel comparison that connects incremental sales to margin contribution and media cost.
1. Select the channels and period
Open the MMM dashboard and select Advertising channel under Primary group by. Keep the period, Country and sales filters consistent throughout the comparison.
For an overall channel comparison, leave Customer type, Sales Channel and Product category at their full selections. If you narrow one of these sales filters, the dashboard uses the selected contribution with the channel’s total media investment. That is useful for contribution analysis, but it changes what the return describes.
2. Find the margin metrics
In KPI, scroll down to the Margin cards. The demo shows $17.16M Margin (MMM) and 1.35 Margin ROI (MMM) across the selected media. Switch to Table and scroll horizontally to compare individual channels.
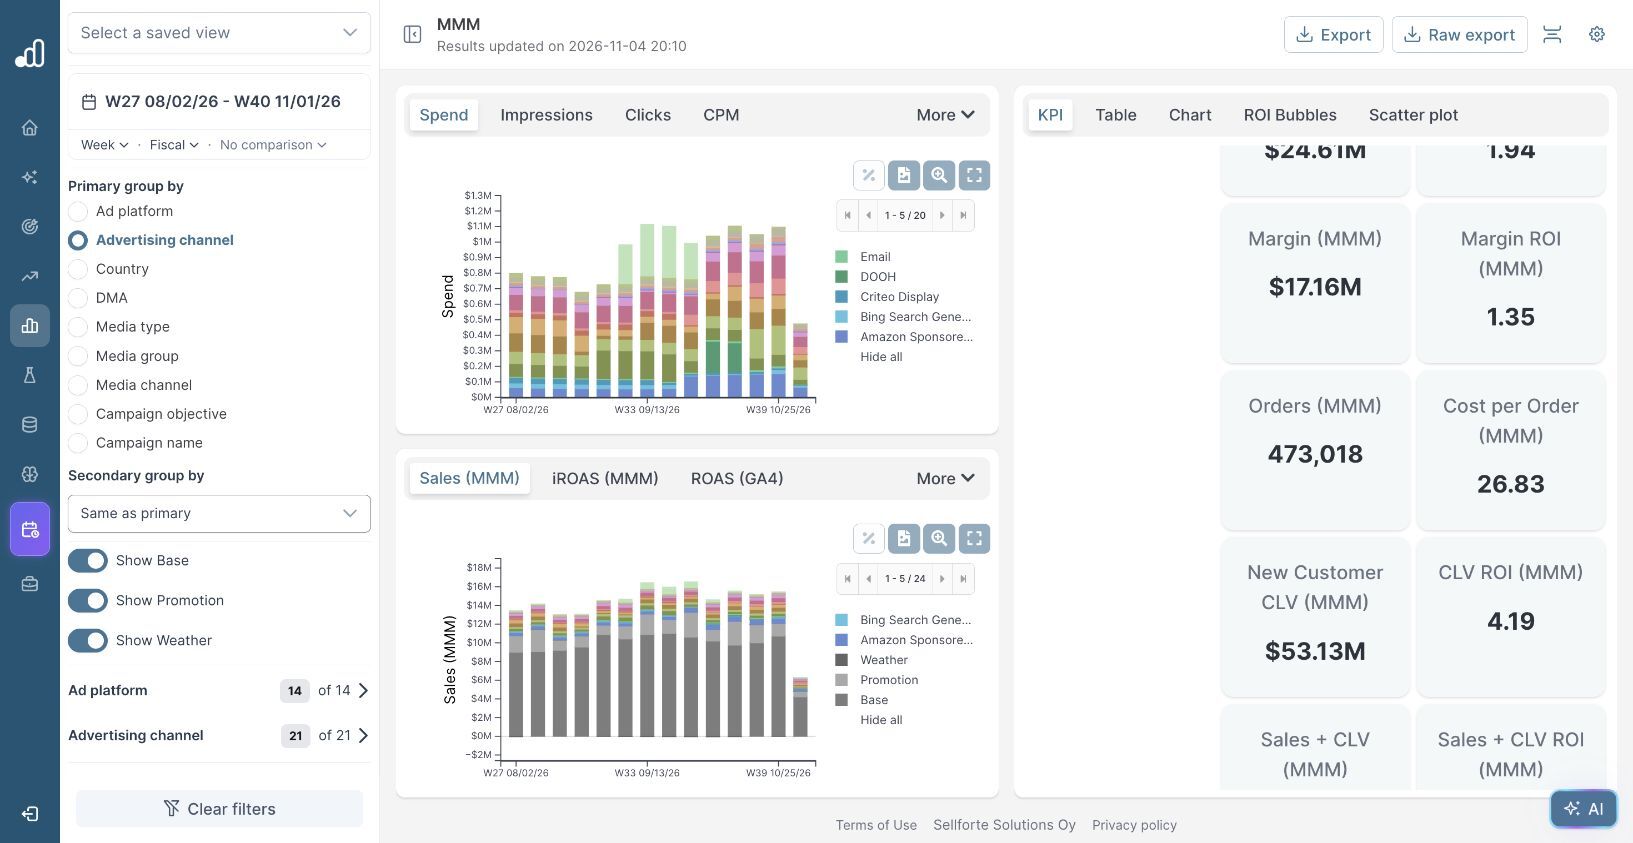
| Metric | What it tells you |
|---|---|
| Sales (MMM) | Incremental sales attributed to the channel by the model. |
| iROAS (MMM) | Modeled incremental sales divided by media spend. |
| Margin (MMM) | Modeled margin contribution on the margin definition configured for the business. |
| Margin ROI (MMM) | Modeled margin contribution divided by media spend. |
The sales and margin measures use different numerators. A revenue iROAS of 2.00 means $2 of incremental sales per media dollar. It does not tell you how much remains after the costs included in your margin definition. Confirm that definition when comparing Margin ROI with a profitability target.
3. Compare revenue return with margin return
The following rows come from the same public-demo Table view. Both return columns use each channel’s spend as the denominator.
| Advertising channel | Spend | Sales (MMM) | Margin (MMM) | iROAS | Margin ROI |
|---|---|---|---|---|---|
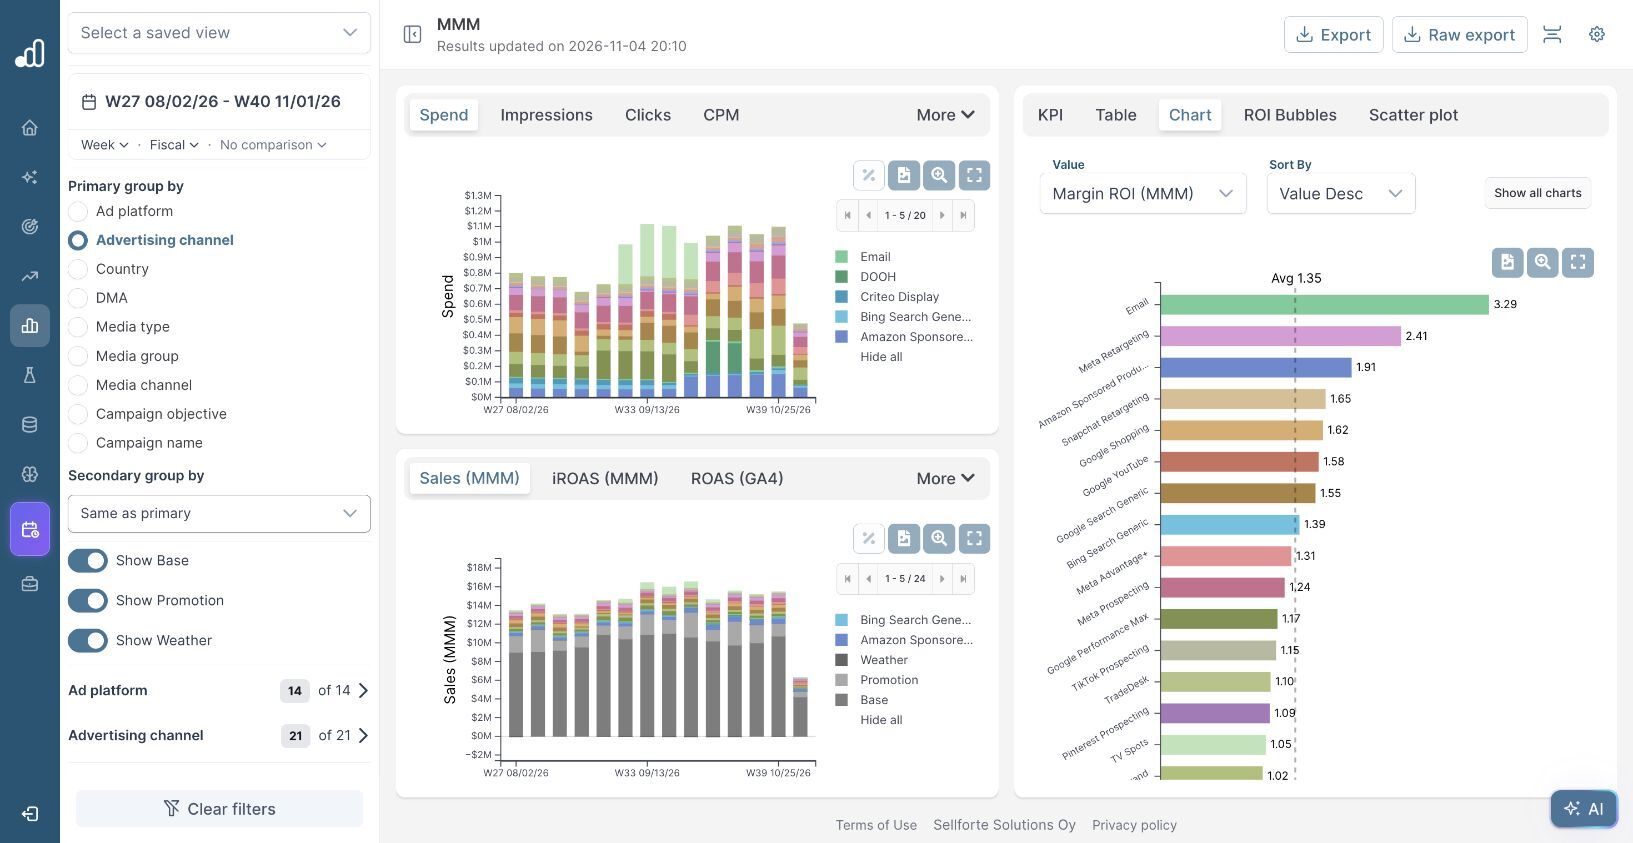
| Amazon Sponsored Products | $1,250,819 | $5,675,042 | $2,391,000 | 4.54 | 1.91 |
| Meta Prospecting | $1,568,340 | $4,538,798 | $1,944,294 | 2.89 | 1.24 |
| Google Search Brand | $1,288,506 | $3,099,992 | $1,313,679 | 2.41 | 1.02 |
| Criteo Display | $305,036 | $494,820 | $211,521 | 1.62 | 0.69 |
Google Search Brand generates $2.41 of modeled sales per media dollar, but $1.02 of modeled margin. Criteo Display generates $1.62 of sales and $0.69 of margin per dollar. Looking only at sales would give a much more generous impression of the contribution available to cover advertising costs.
For Amazon Sponsored Products, the calculation is $2,391,000 ÷ $1,250,819 ≈ 1.91 Margin ROI. Its $2.39M absolute contribution also tells you the scale of the result. Read the amount and the return together when comparing a large channel with a small one.
4. Rank channels on the outcome your business needs
Open Chart, set Value to Margin ROI (MMM), and use Value Desc to rank the channels. You can also select Margin (MMM) to rank their absolute contributions.
5. Use margin to evaluate budget priorities
Use the margin comparison when setting channel targets with finance or reviewing an activity that looks attractive on revenue ROAS. If the configured margin is before media cost, a Margin ROI of 1.00 covers the media spend itself; overhead and other excluded costs still need to be covered. Under that definition, the Criteo result is a reason to investigate the economics, while Google Search Brand is close to the media-cost threshold.
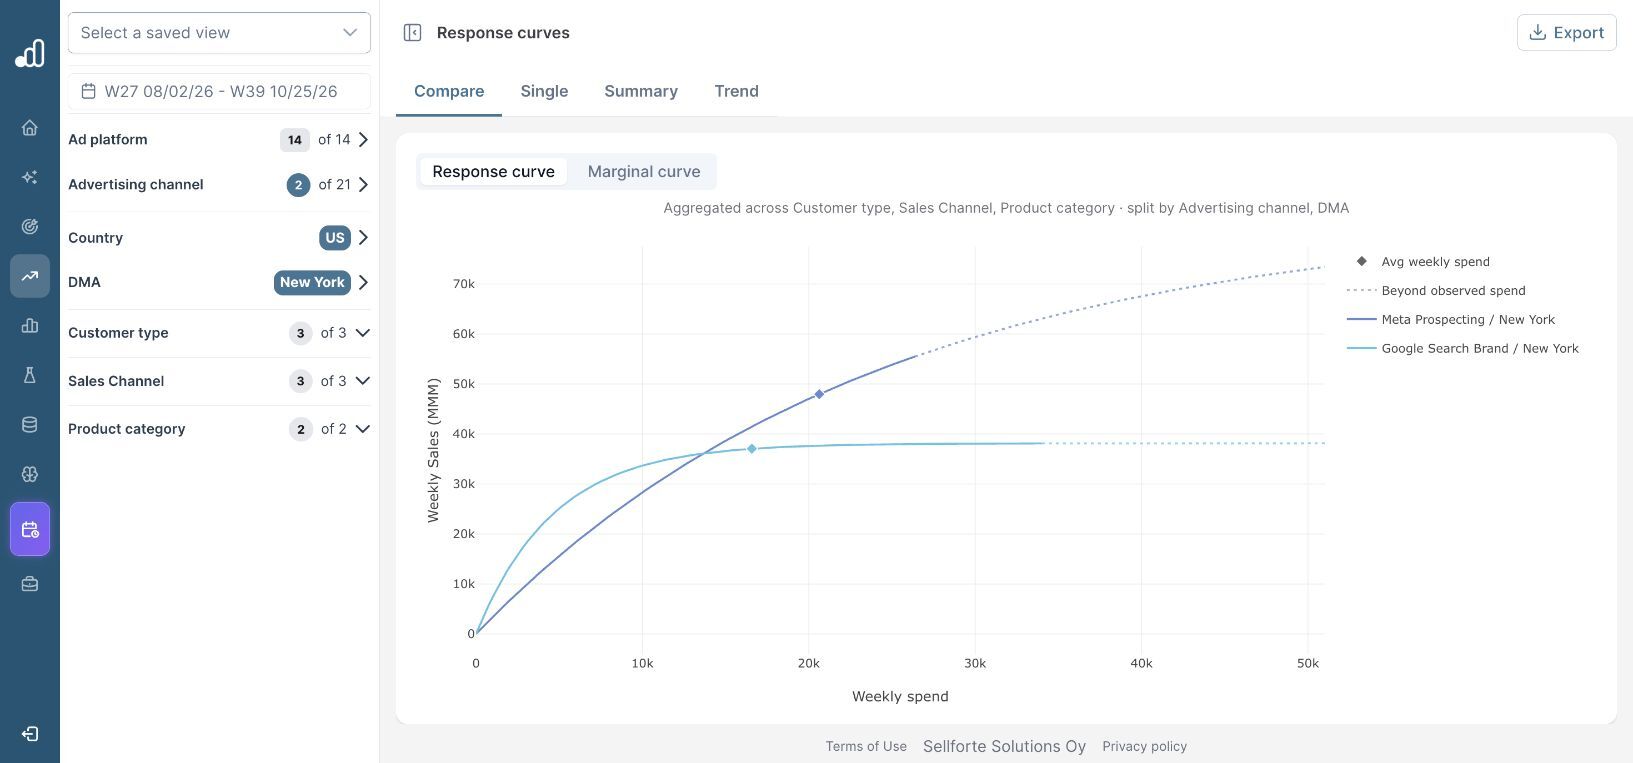
For a proposed increase or reduction, compare the additional margin expected at the new spend level. Historical average Margin ROI does not establish the return on the next dollar. The same distinction between average and marginal returns explained in marginal incremental ROAS (miROAS) applies when your decision is based on margin.
Further Reading and Resources
About the author

Lauri Potka is the Chief Operating Officer at Sellforte, with over 15 years of experience in Marketing Mix Modeling, marketing measurement and media spend optimization. Before joining Sellforte, he worked as a management consultant at the Boston Consulting Group, advising some of the world’s largest advertisers on marketing optimization. Follow Lauri on LinkedIn.
How to Spot Saturation and Find Room to Scale
How to Compare Channels by Customer Lifetime Value