

MMM Use Case

To improve results through weekly budget pacing, compare a Reference scenario with a Budget optimization scenario that keeps every channel’s total budget fixed. The optimizer can then change the weekly distribution of spending, letting you measure the forecast value of better timing.
This walkthrough uses simulated data from the public Sellforte demo. Both plans cover four weeks beginning December 6, December 13, December 20 and December 27, 2026.
Before you start: A reference media schedule and an MMM forecast for the weeks you plan to optimize.
What you will produce: A weekly media schedule and a forecast comparison that isolates timing from changes in channel budgets.
1. Create the reference schedule
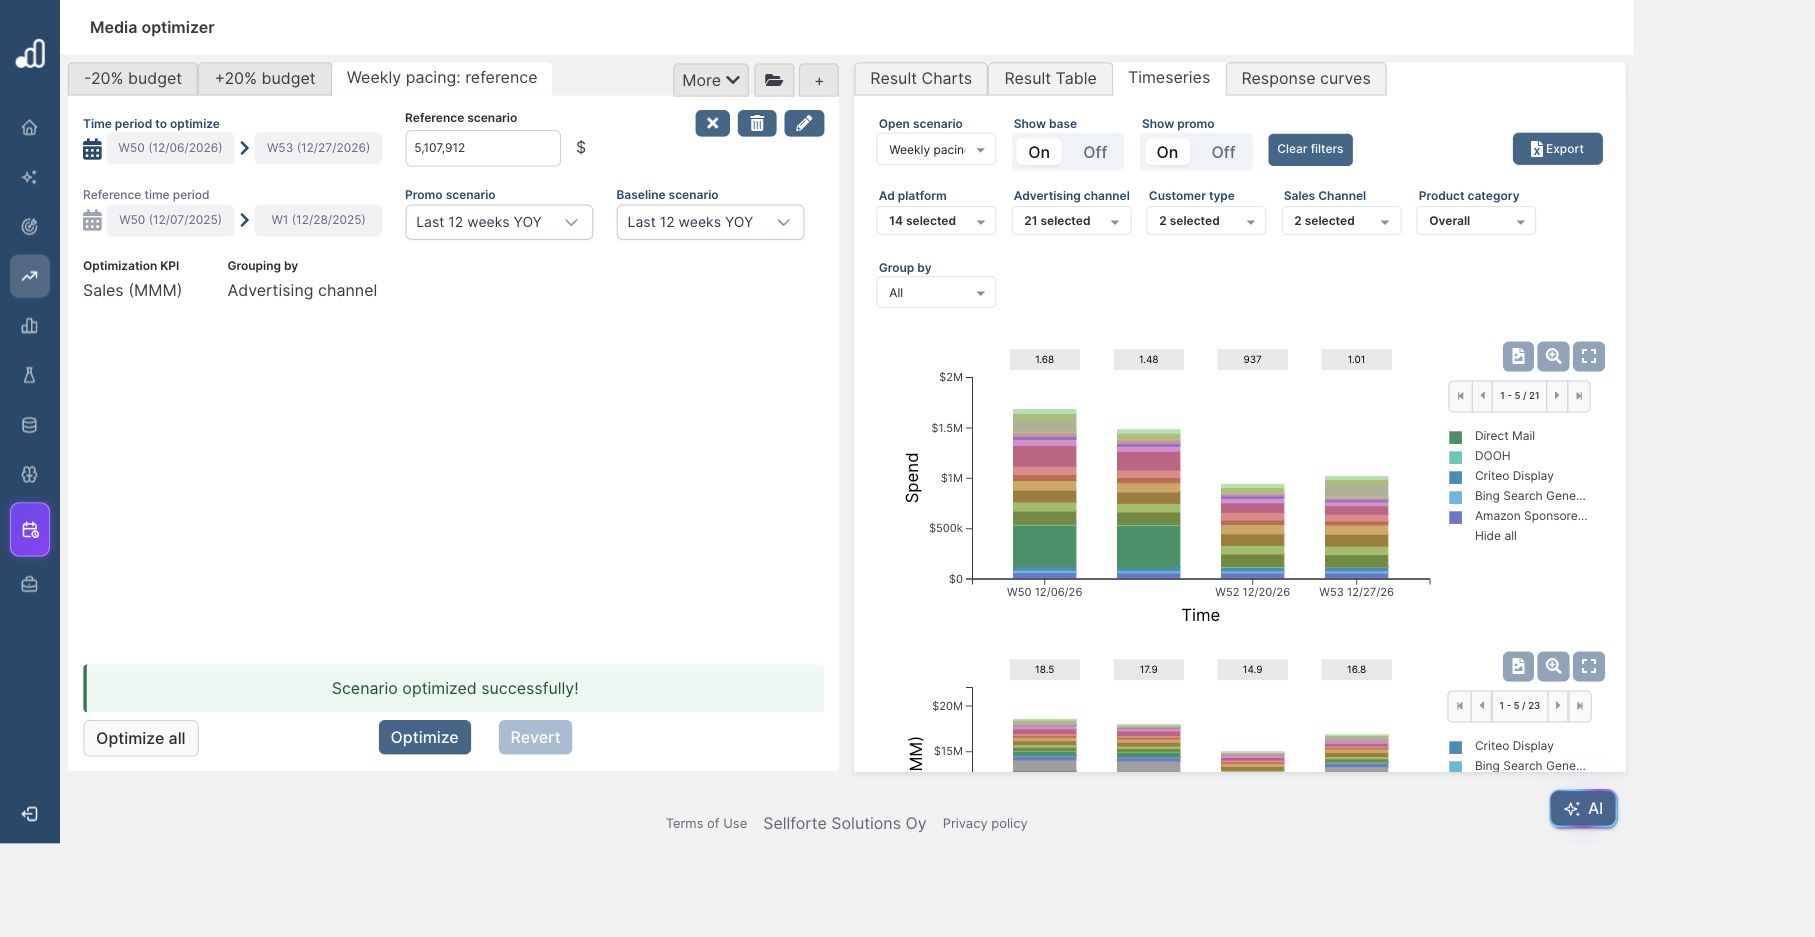
Open Planning → Media optimizer and select + to create a scenario. Name it Weekly pacing: reference. Use Reference Period as the plan basis, Sales (MMM) as the optimization KPI and Reference scenario as the mode.
Choose the four weeks beginning December 6 through December 27, 2026, and select Use same weeks from last year for the reference period. The demo displays reference week starts of December 7 through December 28, 2025. Keep the same dimensions and media-performance forecast selection for both scenarios.
Create the scenario and select Optimize to calculate its forecast. This gives you the expected outcome from repeating the reference media schedule in the future period. The demo’s reference budget is $5,107,912.
2. Keep channel budgets fixed and optimize the weeks
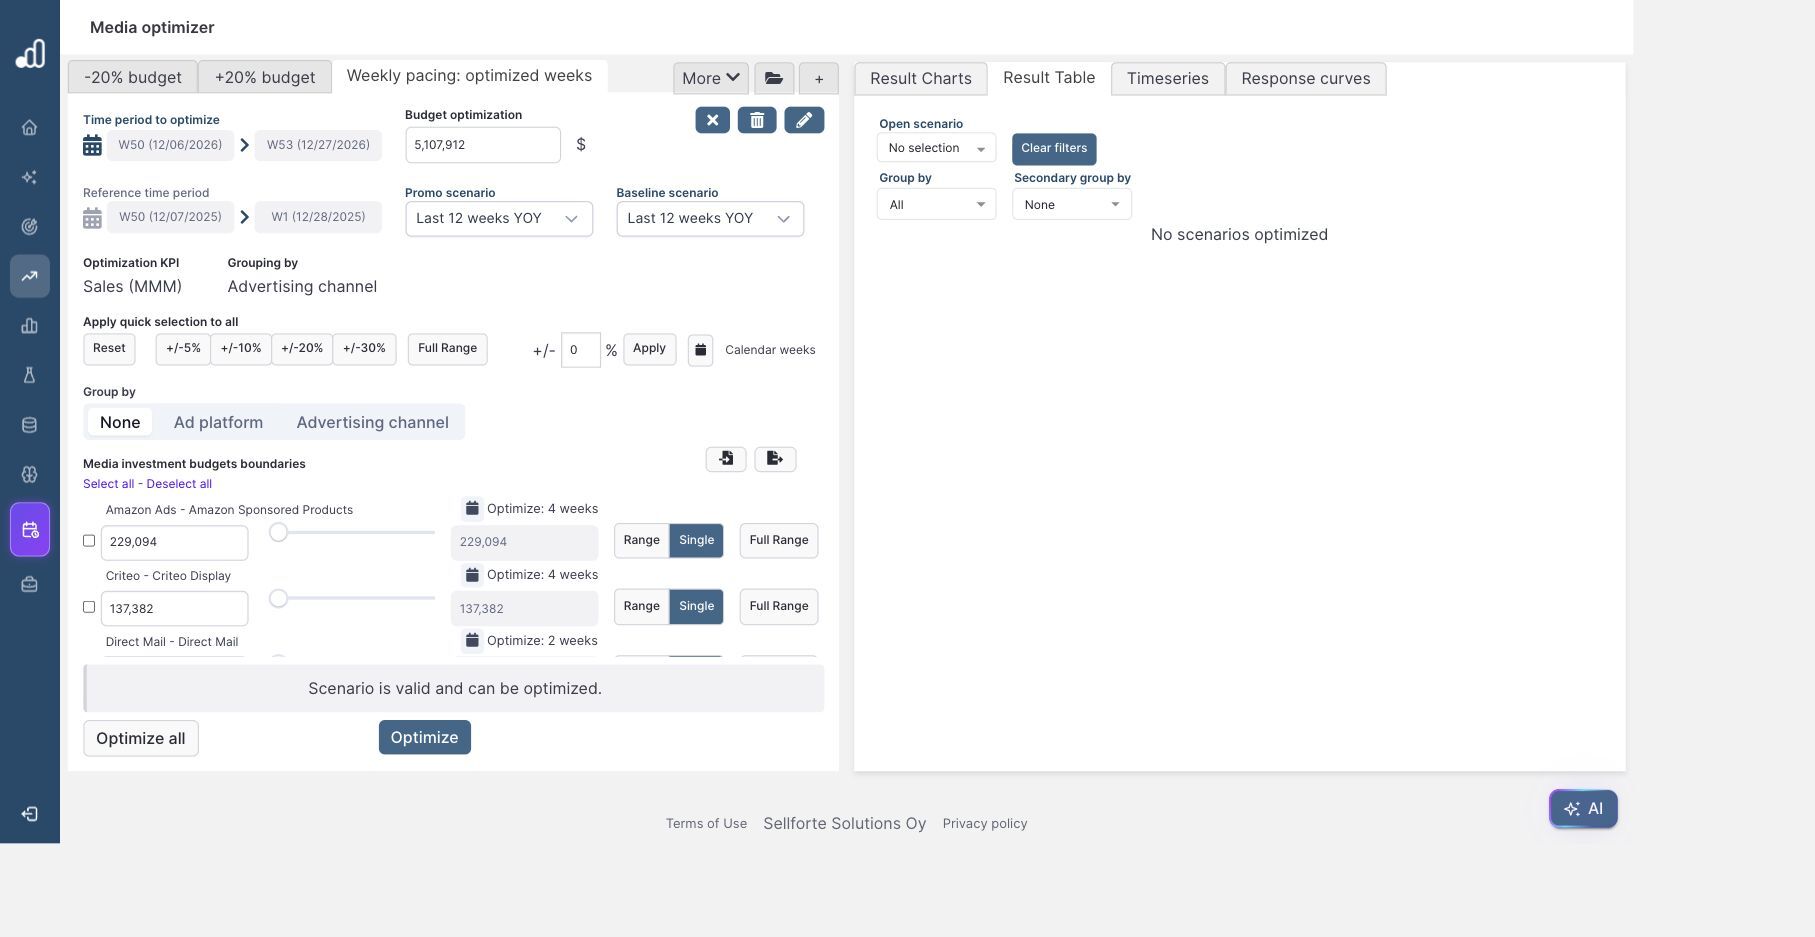
Create another scenario named Weekly pacing: optimized weeks. Use the same plan basis, KPI, dates, reference period, media-performance selection and dimensions. Change the mode to Budget optimization.
In this setup, the channel boundaries start at the reference amounts. Leave each channel at Single with its original total. Keep the total budget at $5,107,912. Percentage ranges would introduce changes in the channel mix and answer a broader question.
The demo has both Promo scenario and Baseline scenario set to Last 12 weeks YOY. Use the same assumptions in the reference and optimized scenarios, then select Optimize.
3. Measure the forecast gain from timing
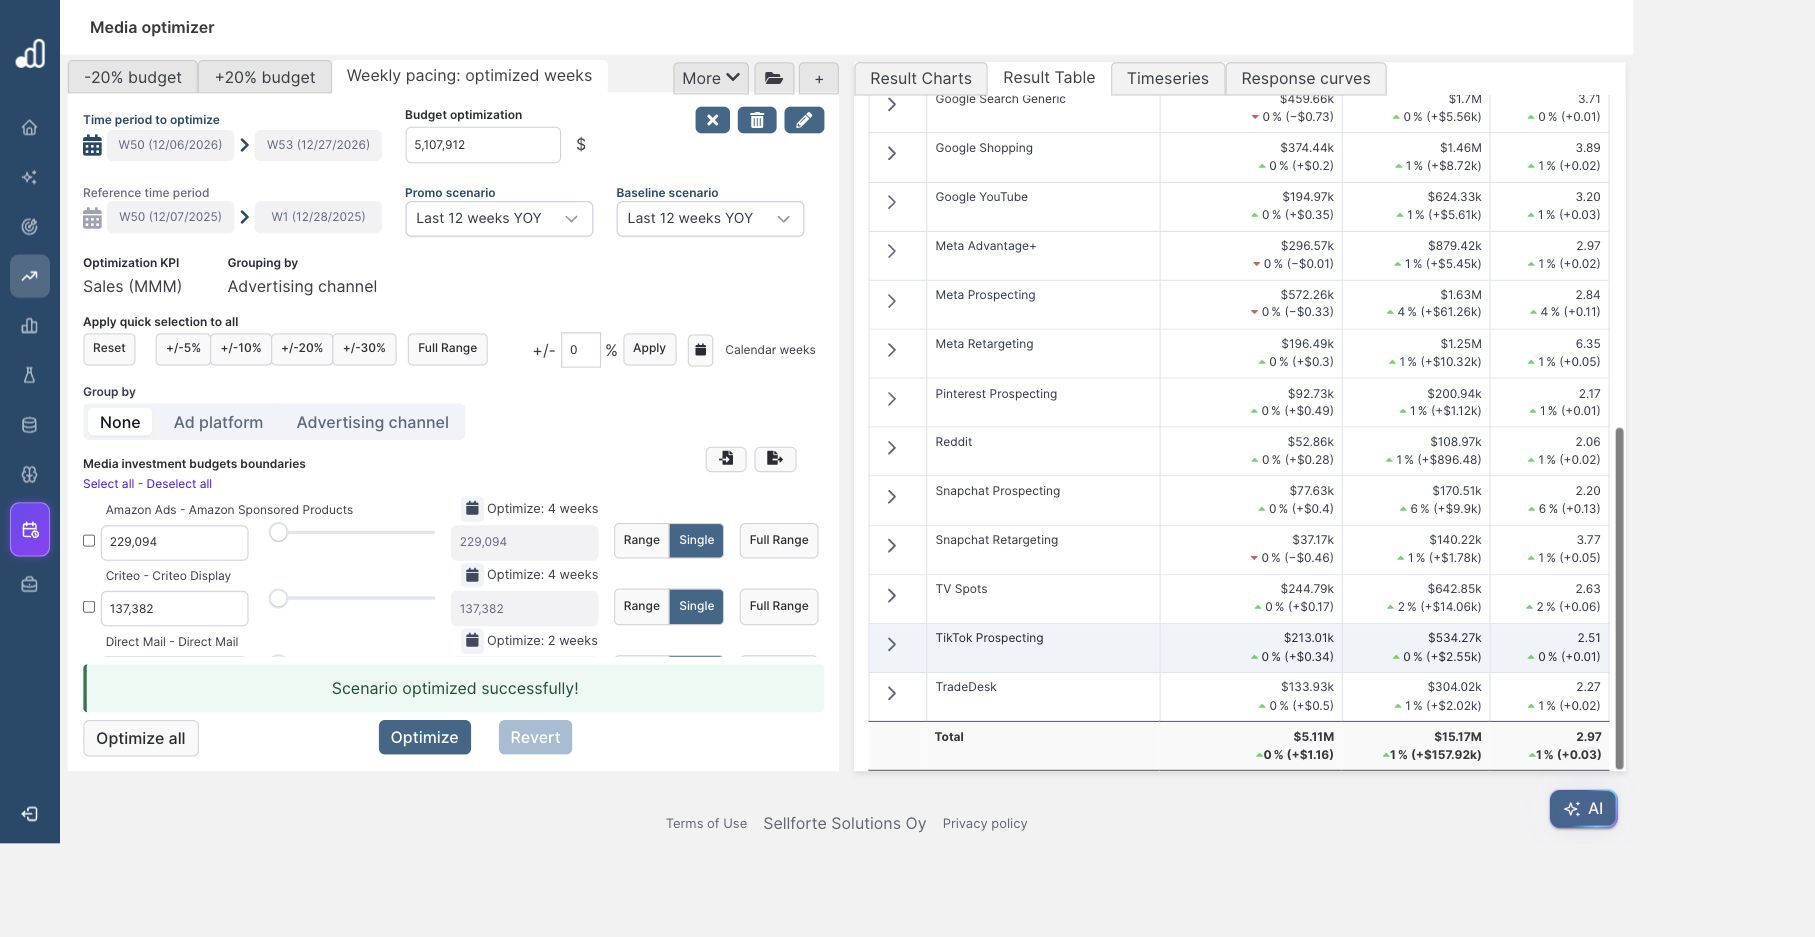
Open Result Table, select Weekly pacing: optimized weeks as the open scenario, and select Weekly pacing: reference under Compare to scenario. Check the investment column first to confirm that the channel totals match.
| Measure | Reference schedule | Optimized weeks |
|---|---|---|
| Configured total budget | $5,107,912 | $5,107,912 |
| Forecast media-driven Sales (MMM) | $15.01M | $15.17M |
| Forecast iROAS | 2.94 | 2.97 |
| Additional forecast media sales | Comparison baseline | About $157,920 |
The comparison reports approximately $157.92k more media-driven sales, or about 1%, at effectively unchanged investment. The displayed difference in total calculated spend is $1.16 from rounding around the fixed budget amounts. The forecast improvement is attributable to the changed schedule under the same channel-budget constraints.
Meta Prospecting illustrates the channel-level effect: its budget remains approximately $572.26k, while forecast Sales (MMM) rises from about $1.57M to $1.63M. The comparison reports approximately $61.26k more sales for that channel.
4. Inspect what changes from week to week
Open Timeseries and select the optimized scenario. The Spend chart shows the weekly plan by channel. Use the expand control to read the complete schedule, and switch the Open scenario selection to the reference when comparing the two plans.
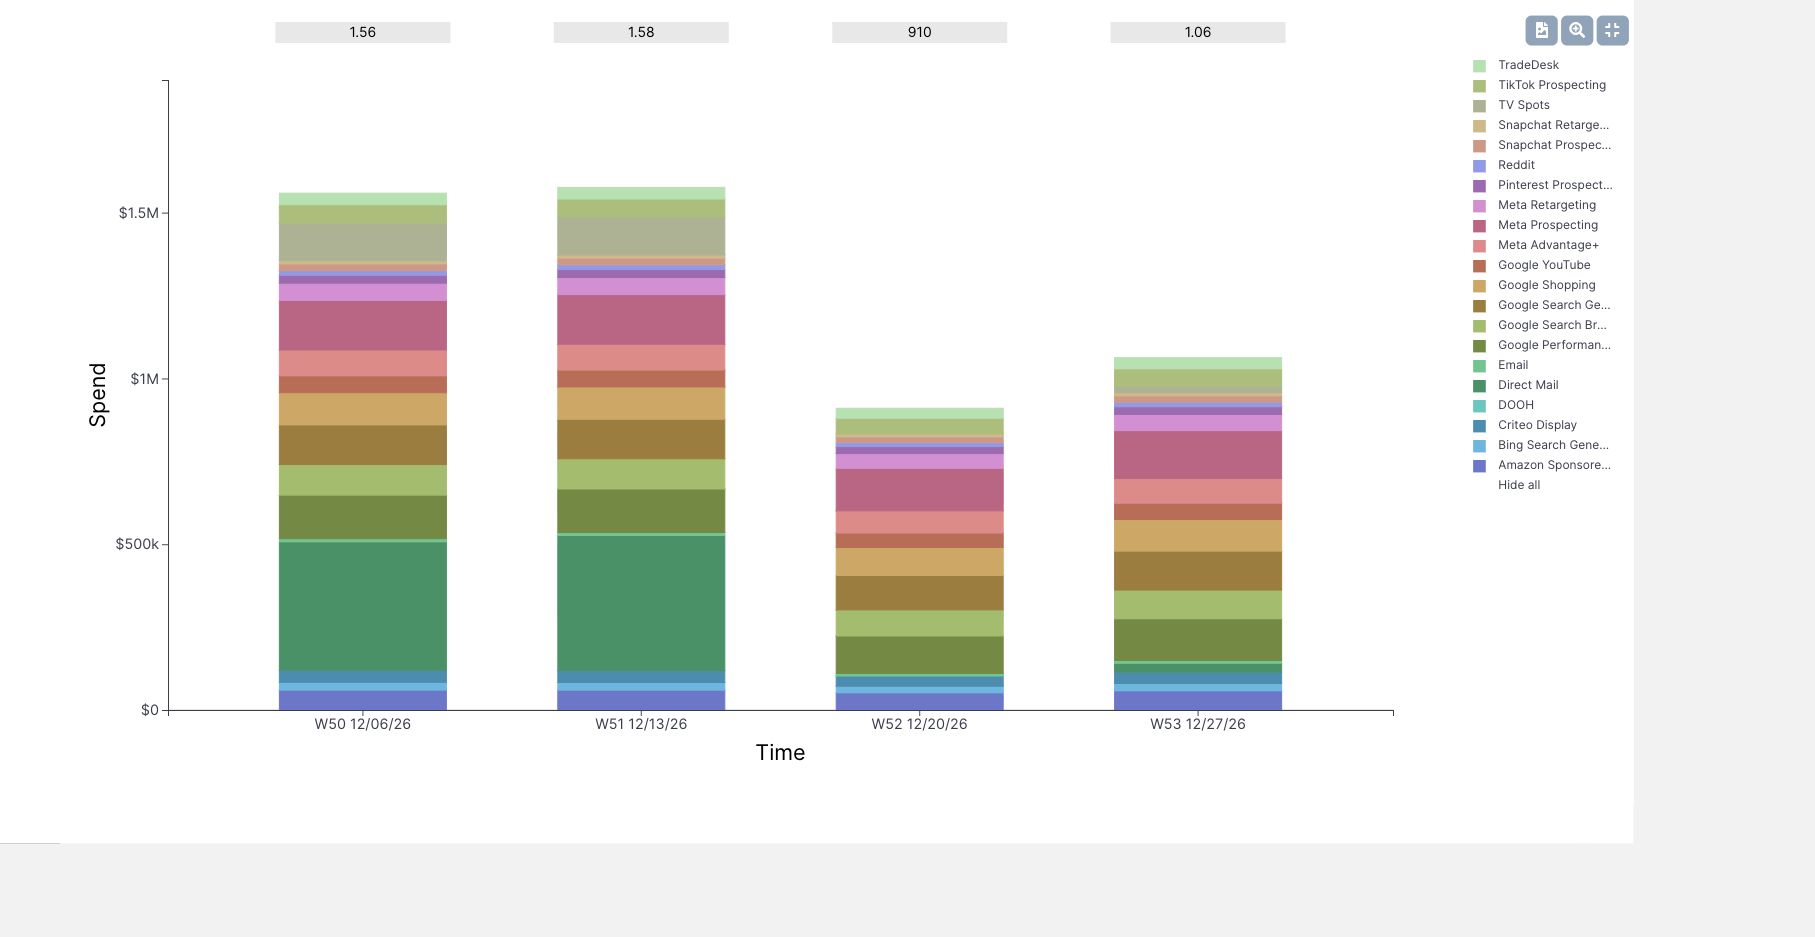
In the demo, total spending in the first week moves from approximately $1.68M to $1.56M. The second week moves from about $1.48M to $1.58M. The later weeks change too. Review the full sequence and individual channel rows before translating those totals into campaign budgets.
5. Apply the schedule to campaign planning
This workflow is useful when channel commitments are already agreed but weekly pacing remains flexible. Compare the expected gain with what the team can implement: available inventory, creative readiness, promotion dates and fixed media bookings can all affect the usable schedule.
Use the week-selection controls to reflect required activity dates, recalculate, and review the resulting schedule before handing it to the media team. Treat the sales difference as a forecast for the selected business conditions. If the channel totals are also open to change, extend the analysis with the guide to allocating next month’s media budget.
Further Reading and Resources
About the author

Lauri Potka is the Chief Operating Officer at Sellforte, with over 15 years of experience in Marketing Mix Modeling, marketing measurement and media spend optimization. Before joining Sellforte, he worked as a management consultant at the Boston Consulting Group, advising some of the world’s largest advertisers on marketing optimization. Follow Lauri on LinkedIn.


