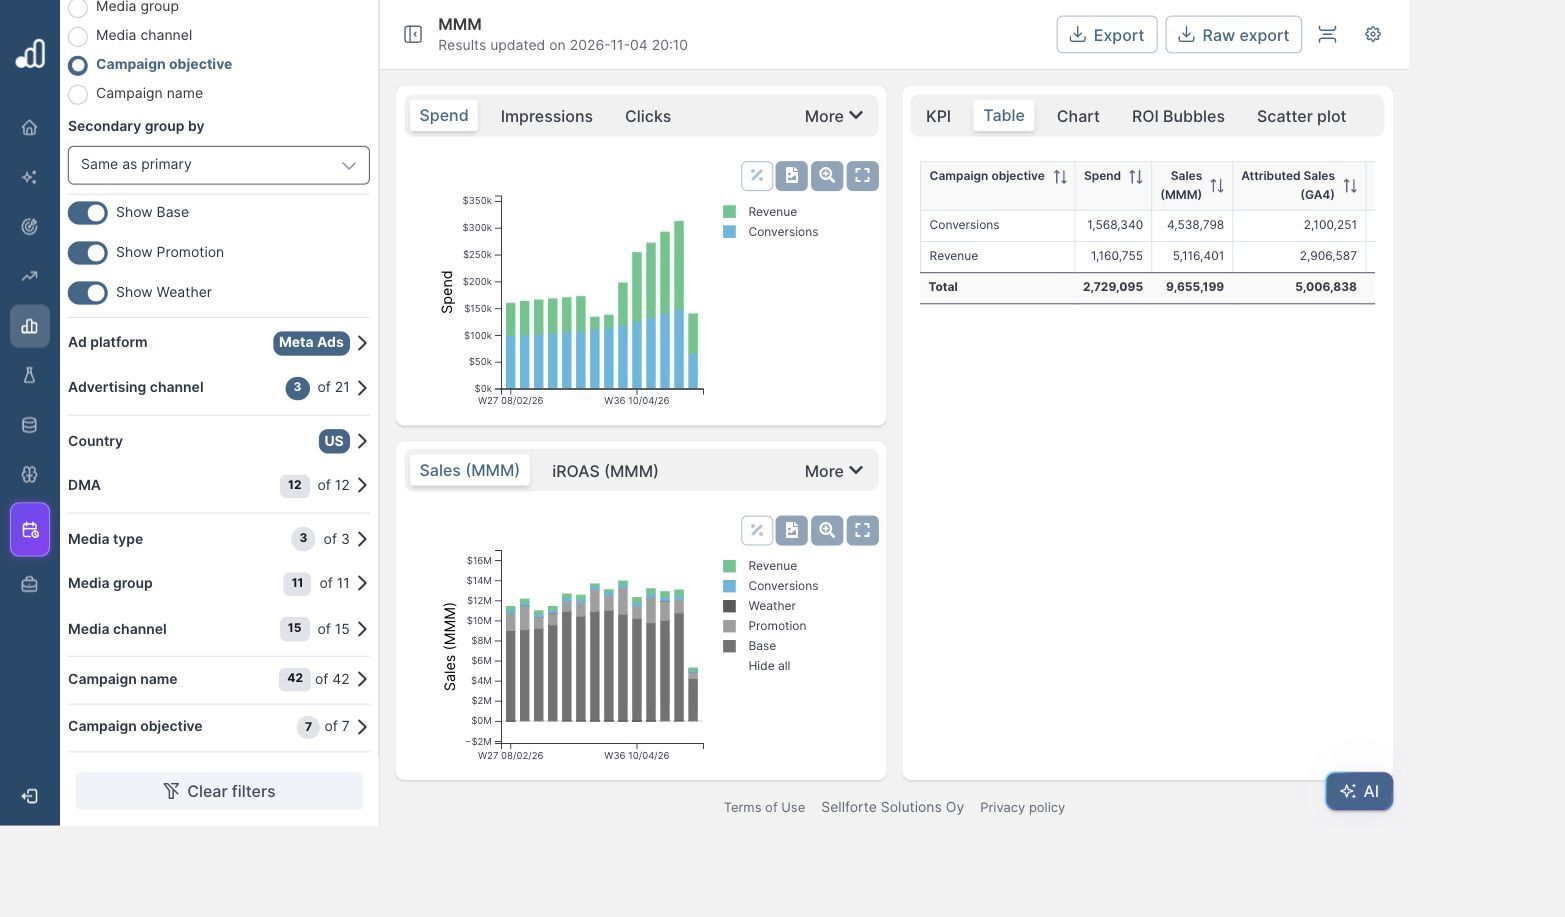
MMM Use Case

To see how a channel’s impact splits between new and existing customers, use the Customer type filter in Dashboards → MMM. Compare New with Returning while keeping the dates and media selection unchanged. The result shows which channels contribute most to new-customer sales and which rely more on returning customers.
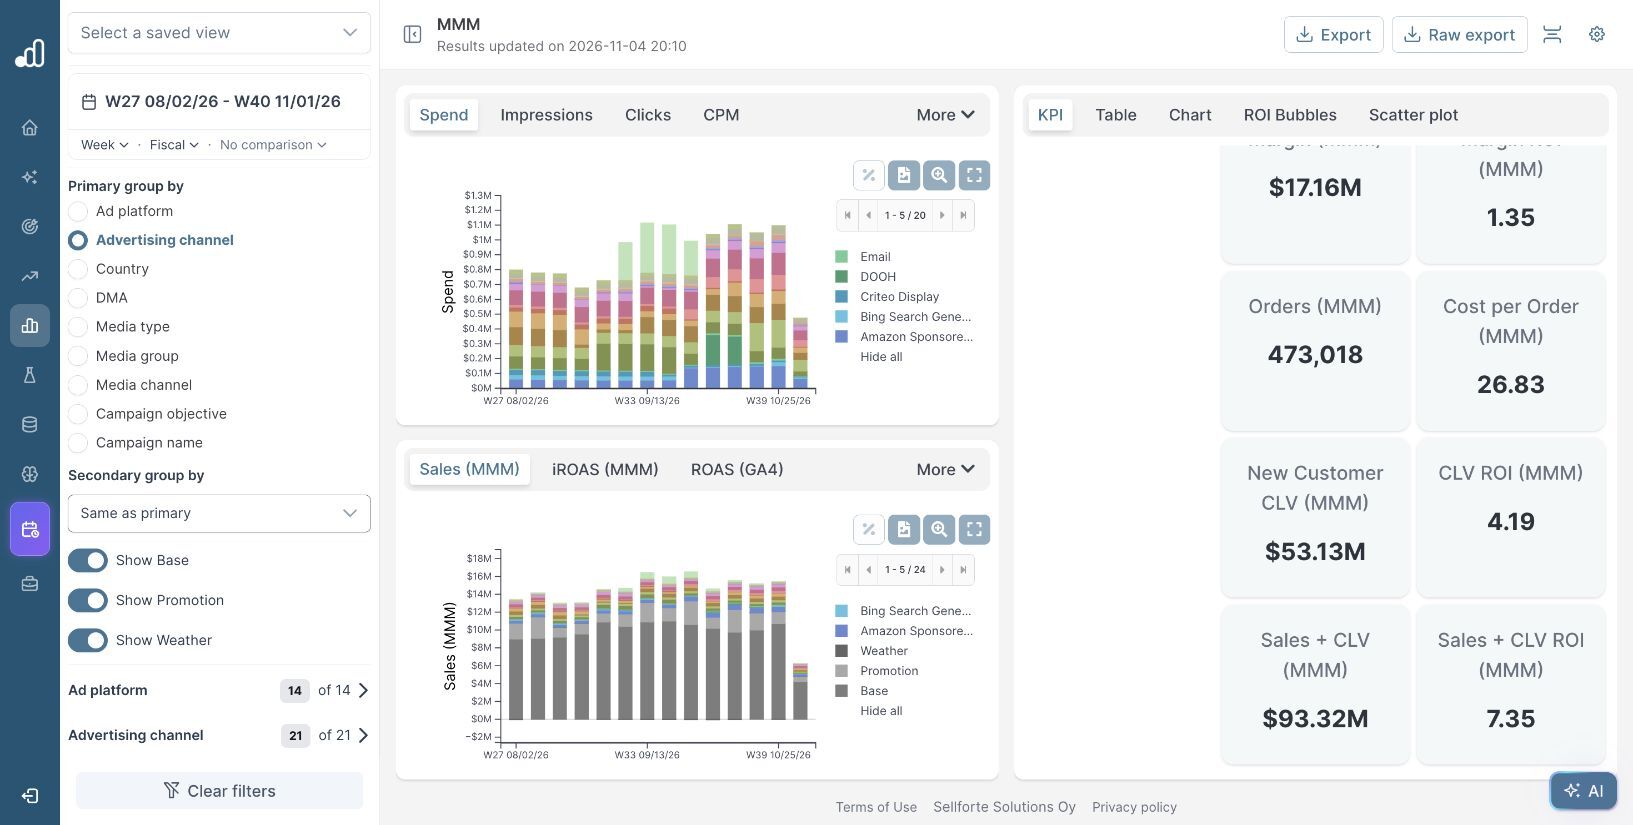
The screenshots and figures use simulated data from the public Sellforte demo. The dashboard is set to US and the displayed period W27 August 2 to W40 November 1, 2026.
Before you start: An MMM setup with sales split by customer type and a consistent definition of a new customer.
What you will produce: A comparison of each channel’s new-customer sales, returning-customer sales and new-customer share.
1. Start with the complete channel comparison
Choose Advertising channel as the primary grouping, then open Table. Keep Country set to US and all sales destinations selected for this example.
The unfiltered demo shows Meta Prospecting at $4,538,798 in Sales (MMM) and 2.89 iROAS. Meta Retargeting generates $3,343,924 at 5.68 iROAS. Those totals combine the contribution to different customer types. The next steps show how the composition differs.
2. Isolate new-customer sales
Scroll down the filter panel and open Customer type. Choose Deselect all, then select New. Click outside the menu and read Sales (MMM) in the channel table.
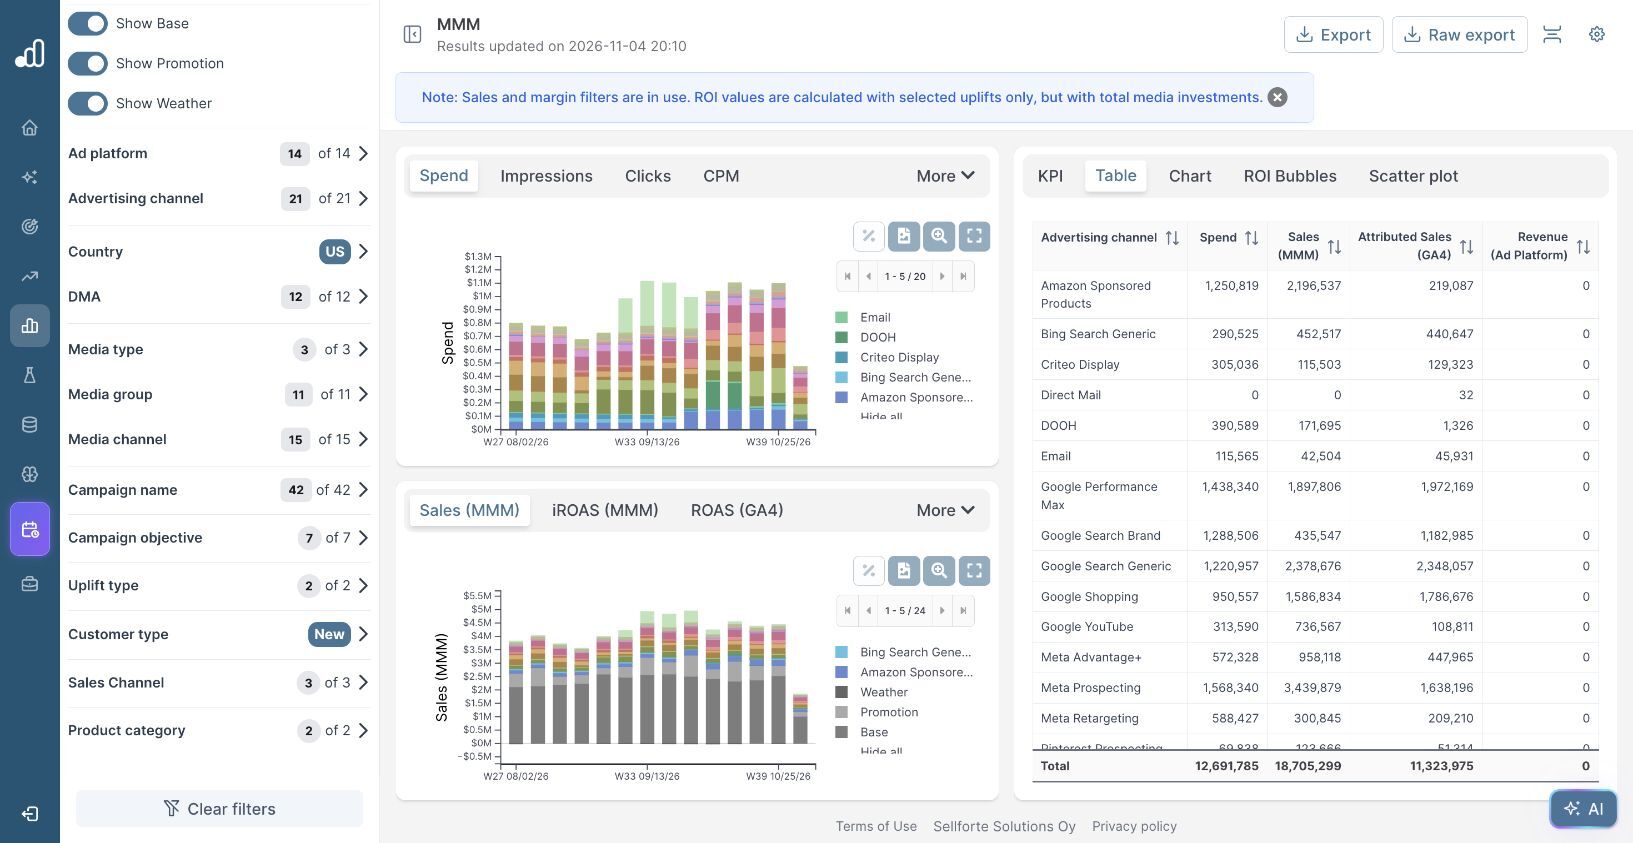
Meta Prospecting now shows $3,439,879 in modeled sales, compared with $300,845 for Meta Retargeting. Google Search Brand contributes $435,547.
The notice above the dashboard explains how to read the returns: sales filters limit the selected uplift, while the denominator remains total media investment. The new-customer iROAS therefore measures new-customer sales per dollar of the channel’s full spend. It does not imply that the entire budget was spent exclusively on acquiring new customers.
3. Compare with returning-customer sales
Open Customer type again, deselect New and select Returning. Keep all other selections unchanged and read the same channel rows.
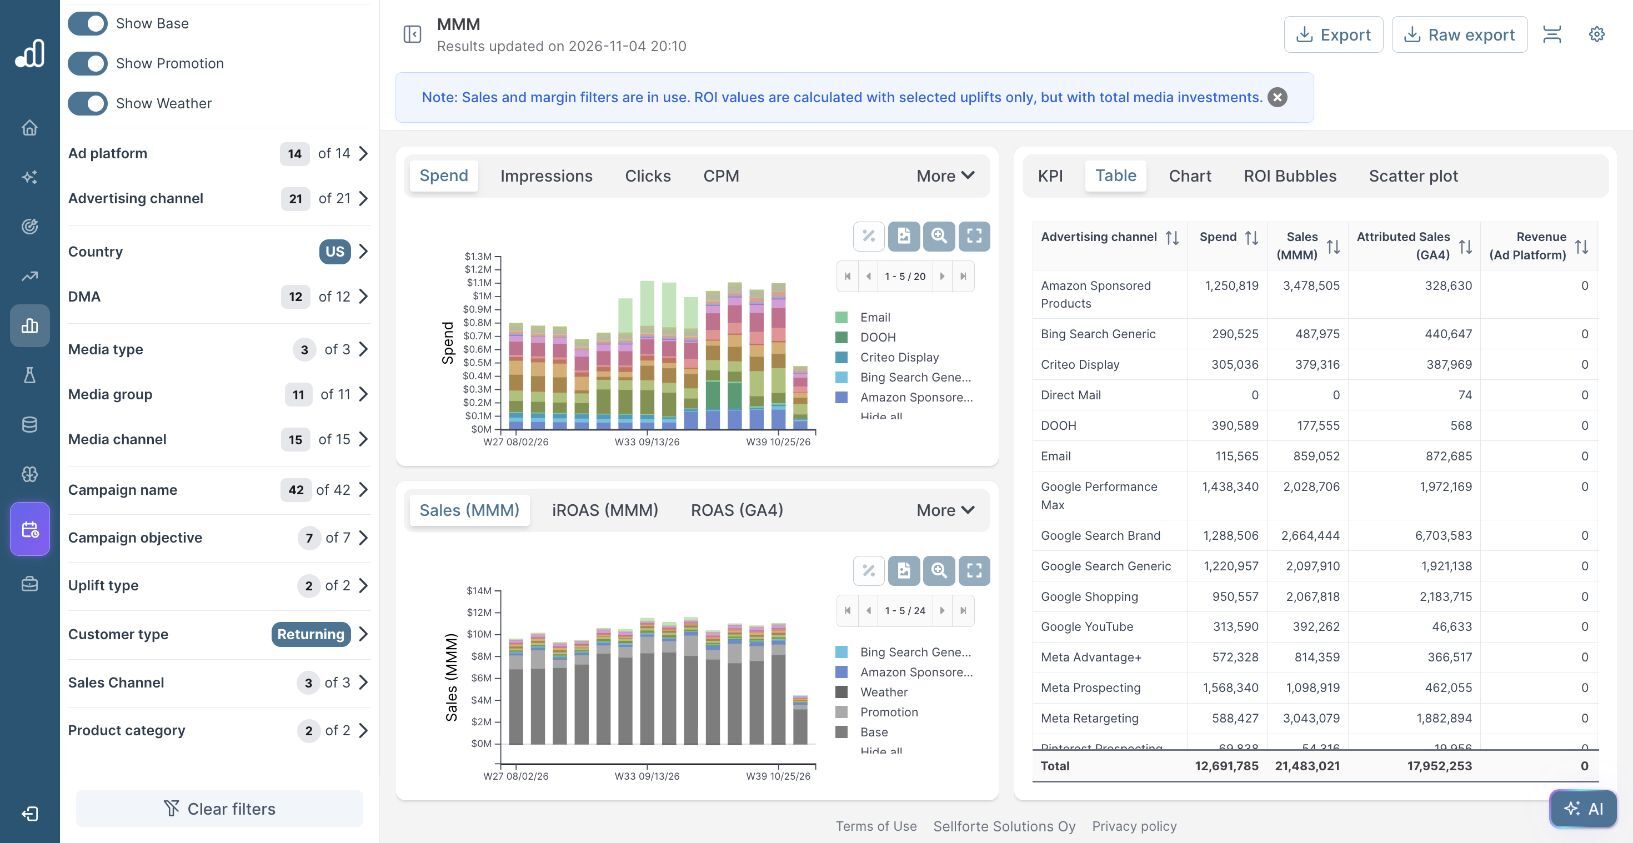
| Advertising channel | New-customer Sales (MMM) | Returning-customer Sales (MMM) | New-customer share |
|---|---|---|---|
| Meta Prospecting | $3,439,879 | $1,098,919 | 75.8% |
| Meta Retargeting | $300,845 | $3,043,079 | 9.0% |
| Google Search Brand | $435,547 | $2,664,444 | 14.1% |
Calculate the share using the two sales contributions. For Meta Prospecting: $3,439,879 ÷ ($3,439,879 + $1,098,919) ≈ 75.8%. These are shares of modeled incremental sales, not shares of unique customers.
The demo also lists N/A as a customer-type option. If your model has a meaningful unclassified contribution, keep it visible as a separate category when reconciling the total. Do not silently assign it to either customer group. Small differences of a dollar can also arise when displayed values are rounded.
4. Compare efficiency for the acquisition objective
| Advertising channel | Total spend | New-customer sales per dollar of spend |
|---|---|---|
| Meta Prospecting | $1,568,340 | 2.19 |
| Meta Retargeting | $588,427 | 0.51 |
| Google Search Brand | $1,288,506 | 0.34 |
Retargeting has the higher overall iROAS, but Prospecting generates more new-customer sales per dollar of total spend in this example. A single overall ROAS target would hide that difference in their roles.
Use the split when assessing whether the media mix supports an acquisition objective. A channel dominated by returning-customer sales can still be valuable; the question is how much new-customer contribution the business needs alongside repeat purchases.
If the acquisition decision also depends on future purchases, extend the comparison with New Customer CLV and combined customer value. Use the current sales split to understand the immediate contribution, then include the configured lifetime-value measure when evaluating the longer-term acquisition investment.
Further Reading and Resources
About the author

Lauri Potka is the Chief Operating Officer at Sellforte, with over 15 years of experience in Marketing Mix Modeling, marketing measurement and media spend optimization. Before joining Sellforte, he worked as a management consultant at the Boston Consulting Group, advising some of the world’s largest advertisers on marketing optimization. Follow Lauri on LinkedIn.
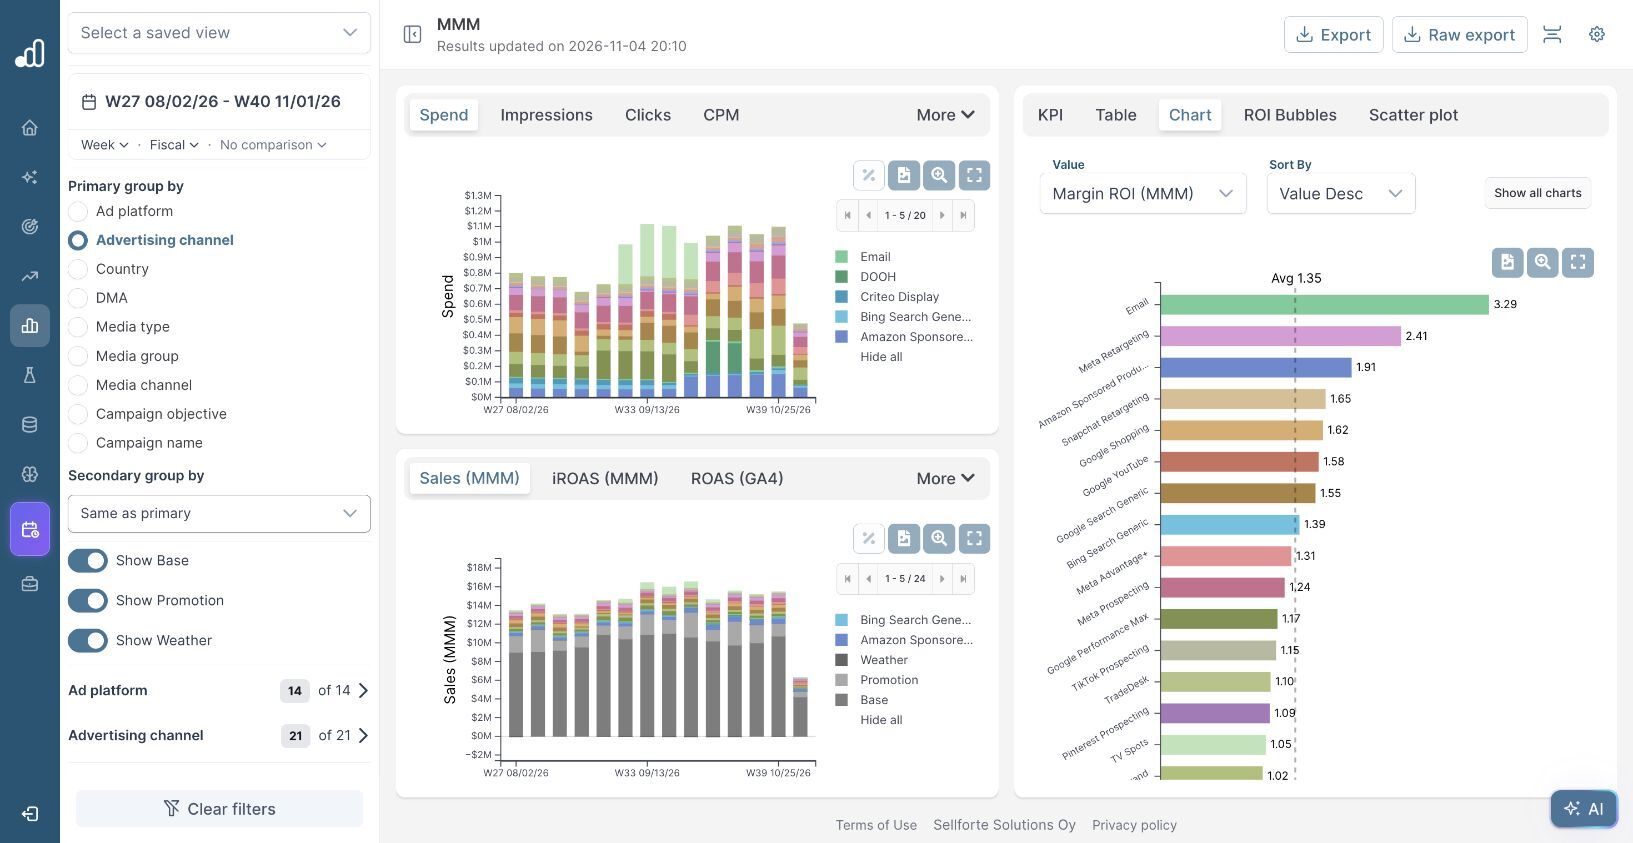
How to Compare Channels by Incremental Margin
How to Compare Channels by Customer Lifetime Value