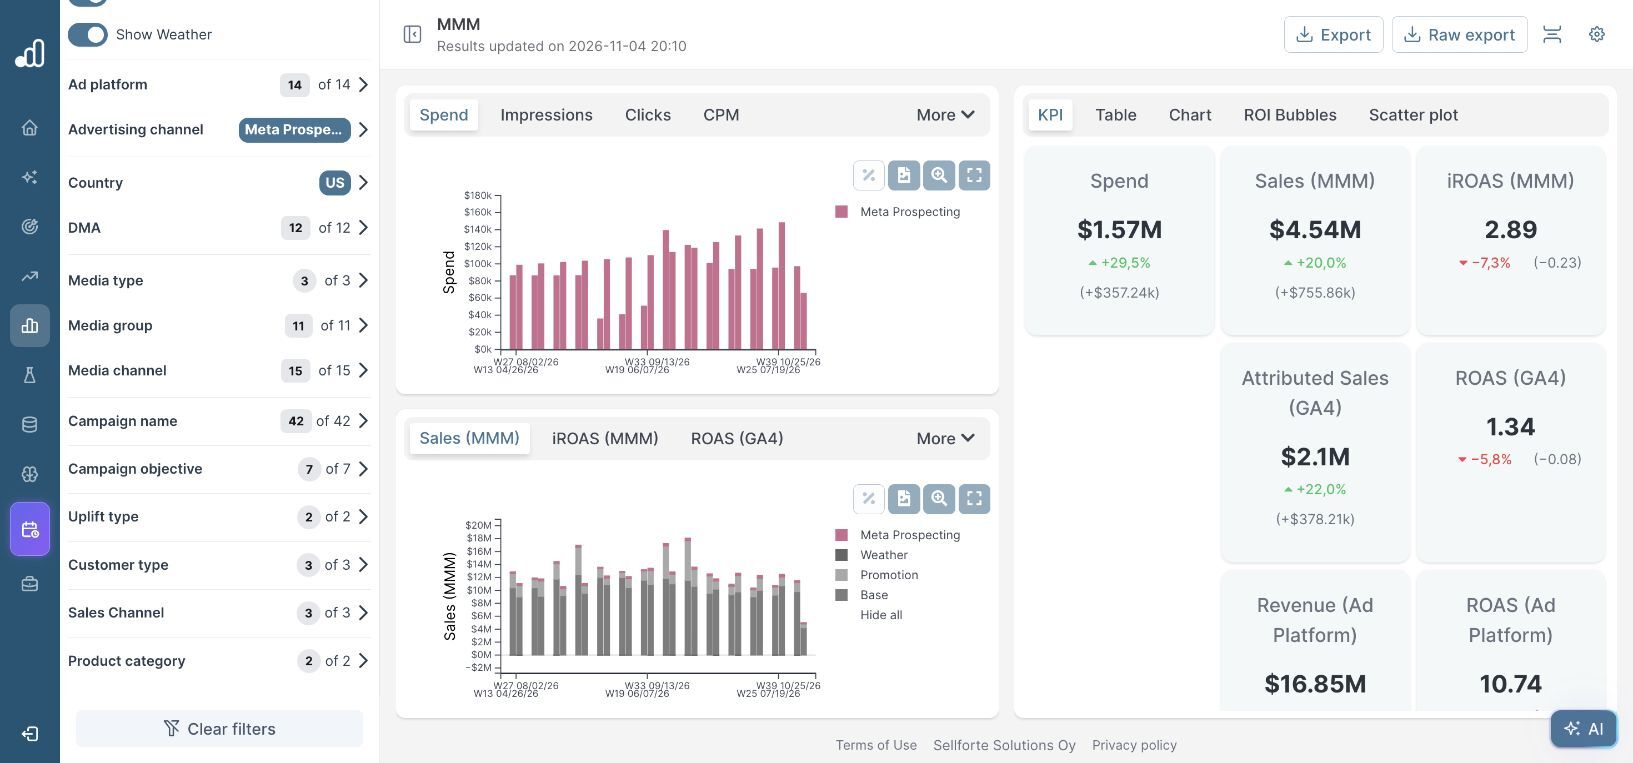
MMM Use Case

To see which channels drive incremental sales in Sellforte, open Dashboards → MMM, choose a consistent period and market, and compare Spend, Sales (MMM) and iROAS (MMM). Read the contribution and the return together before deciding which activity deserves attention.
This walkthrough uses the public Sellforte demo, with US data and the displayed period W27 August 2–W40 November 1, 2026. The screenshots and figures are simulated demo data, captured on November 15, 2026.
Before you start: You need access to MMM and an agreed sales definition. Check that the selected period has complete data.
What you will produce: A channel comparison that distinguishes the size of the contribution from average efficiency, followed by a clear next step.
1. Set the period, market and grouping
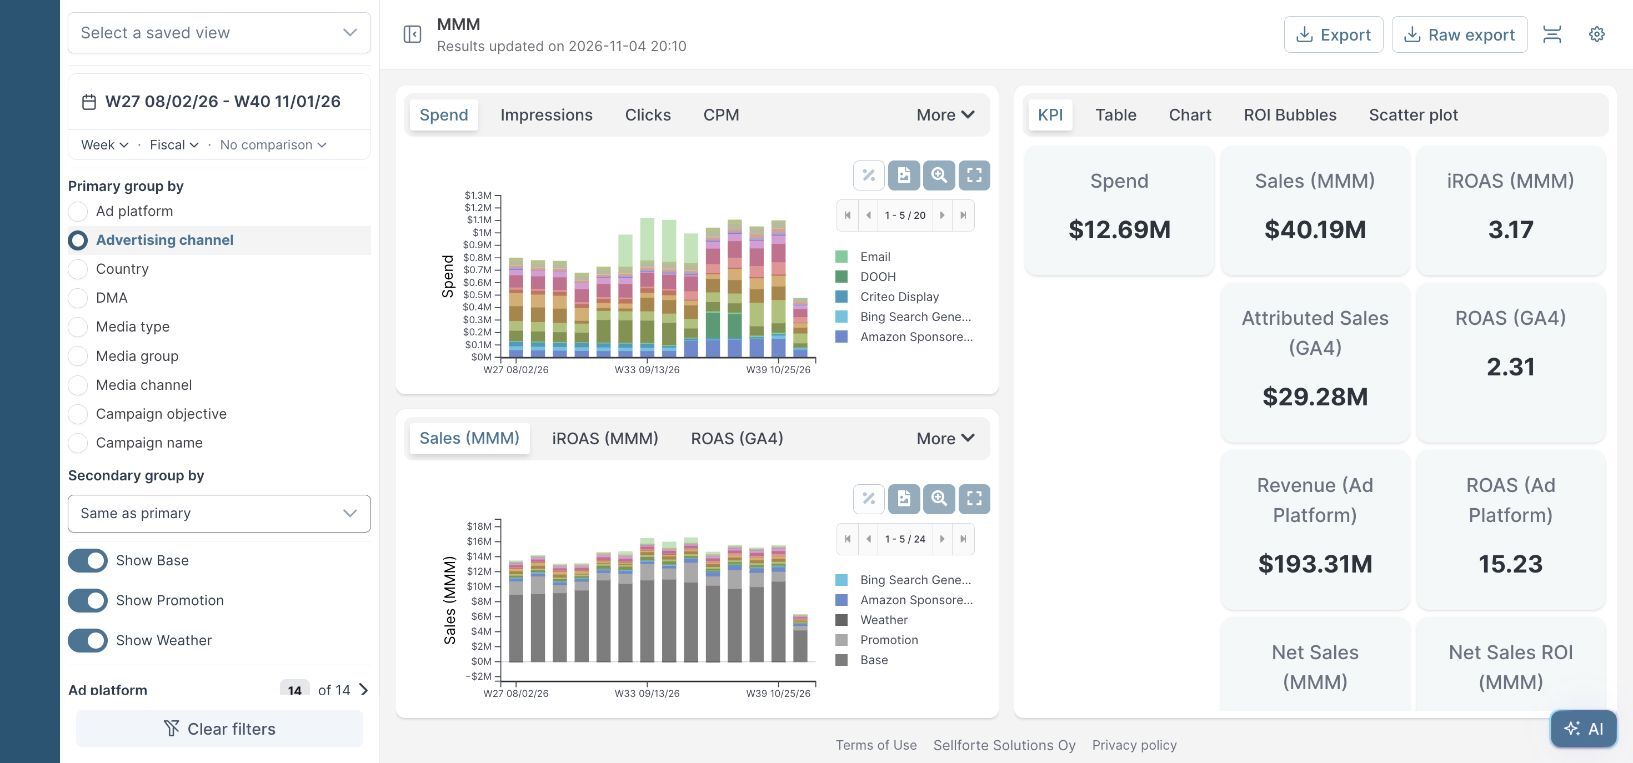
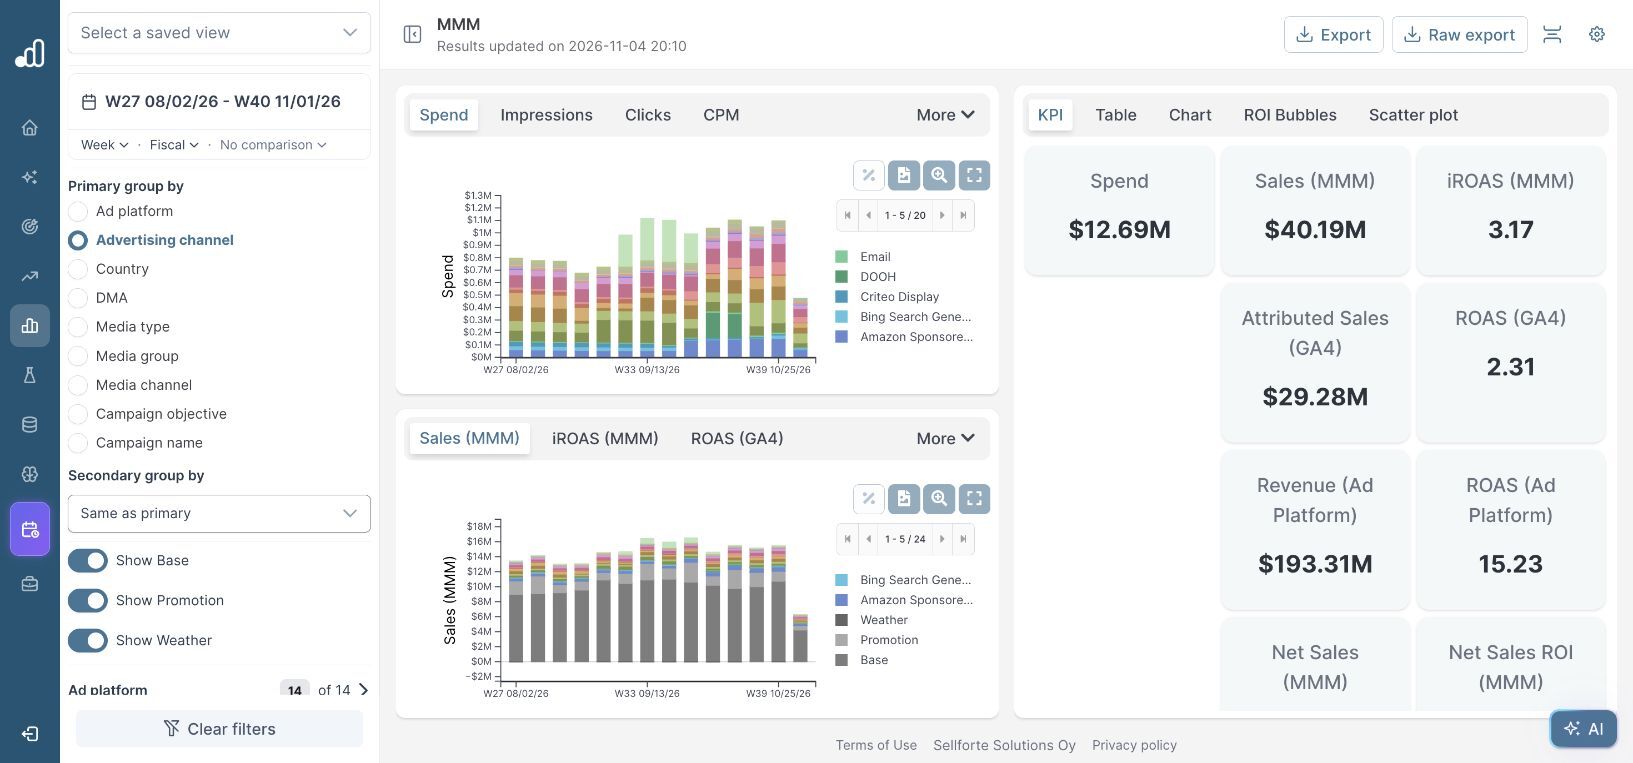
Open MMM under Dashboards. Use the date selector at the top of the filter panel and choose Advertising channel under Primary group by. Keep Country set to US for this example.
Review the other filters before reading a number. The example includes all available advertising channels, DMAs, customer types, sales channels and product categories in this dashboard. A view limited to ecommerce or new customers answers a narrower question.
2. Separate media contribution from total sales
The lower time-series chart can show Sales (MMM) with Show Base, Show Promotion and Show Weather enabled. This gives context for changes in the business: a stronger sales week can coincide with changes in modeled base demand or promotions as well as media.
In this view, the media KPI cards show $12.69M spend, $40.19M Sales (MMM) and 3.17 iROAS (MMM). The exact table totals are $12,691,785 and $40,188,320. Their ratio is approximately 3.17. Do not describe the media contribution card as the company's total sales, or add a total row to its component rows.
3. Compare the channel rows
Choose Table on the right. Read the spend denominator and modeled sales for each channel, then use its iROAS column to compare average return. The following rows come from the same filtered demo view.
| Advertising channel | Spend | Sales (MMM) | iROAS (MMM) |
|---|---|---|---|
| Amazon Sponsored Products | $1,250,819 | $5,675,042 | 4.54 |
| Meta Prospecting | $1,568,340 | $4,538,798 | 2.89 |
| Meta Retargeting | $588,427 | $3,343,924 | 5.68 |
| $115,565 | $901,556 | 7.80 |
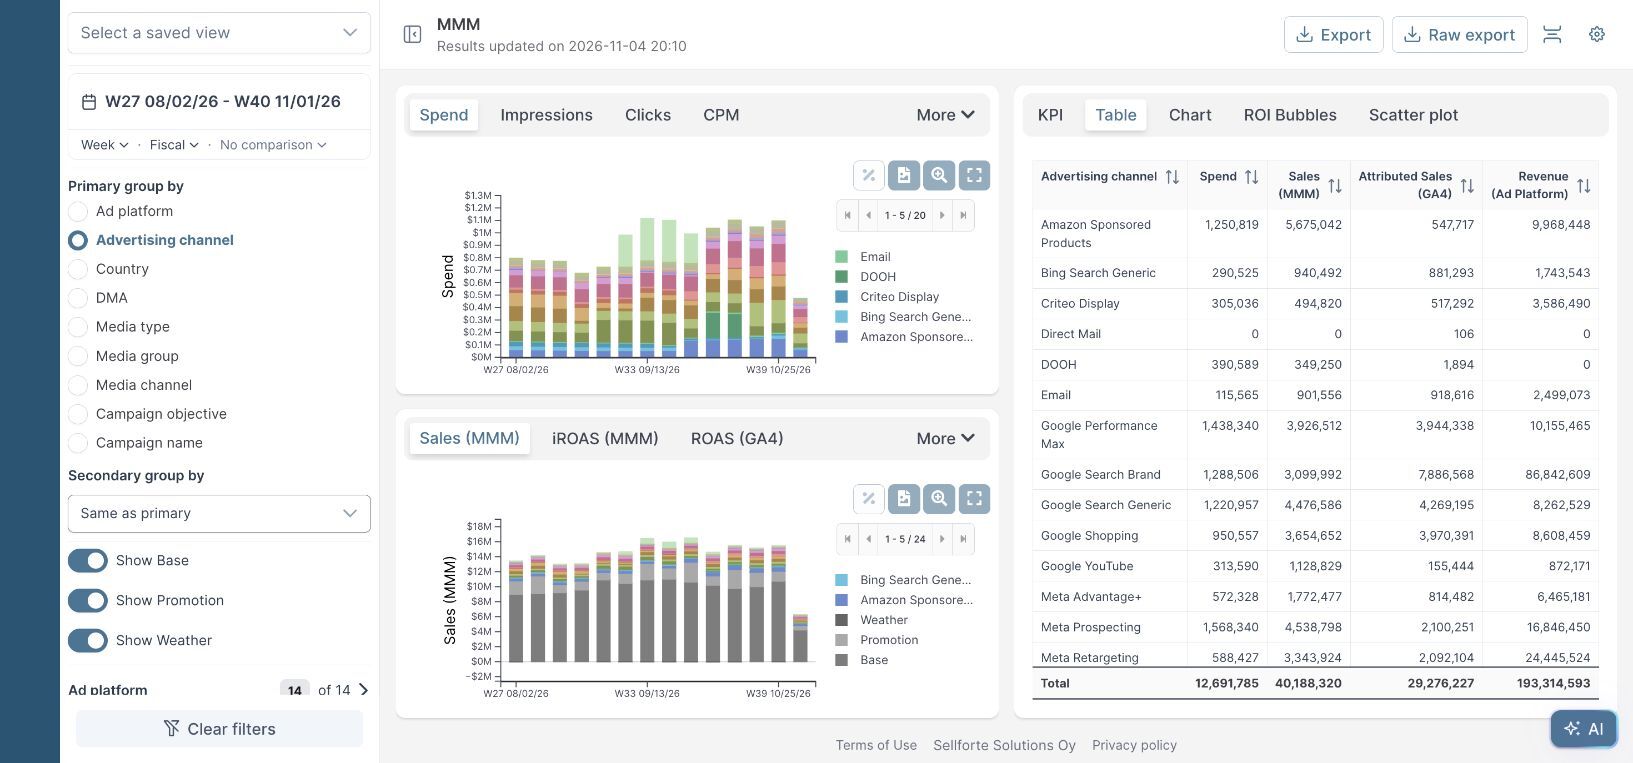
Amazon Sponsored Products contributes more modeled sales than the other channels in this selection. Email has the highest average iROAS of these four rows, but a much smaller absolute contribution and spend. Meta Prospecting contributes more sales than Meta Retargeting while having a lower average return. These observations describe different aspects of performance.
4. Use ROI Bubbles to see scale and efficiency together
Open ROI Bubbles and keep Sales (MMM) selected. The horizontal axis shows modeled sales, the vertical axis shows iROAS, and bubble size represents spend. Use the table to confirm values when labels overlap or points are close together.
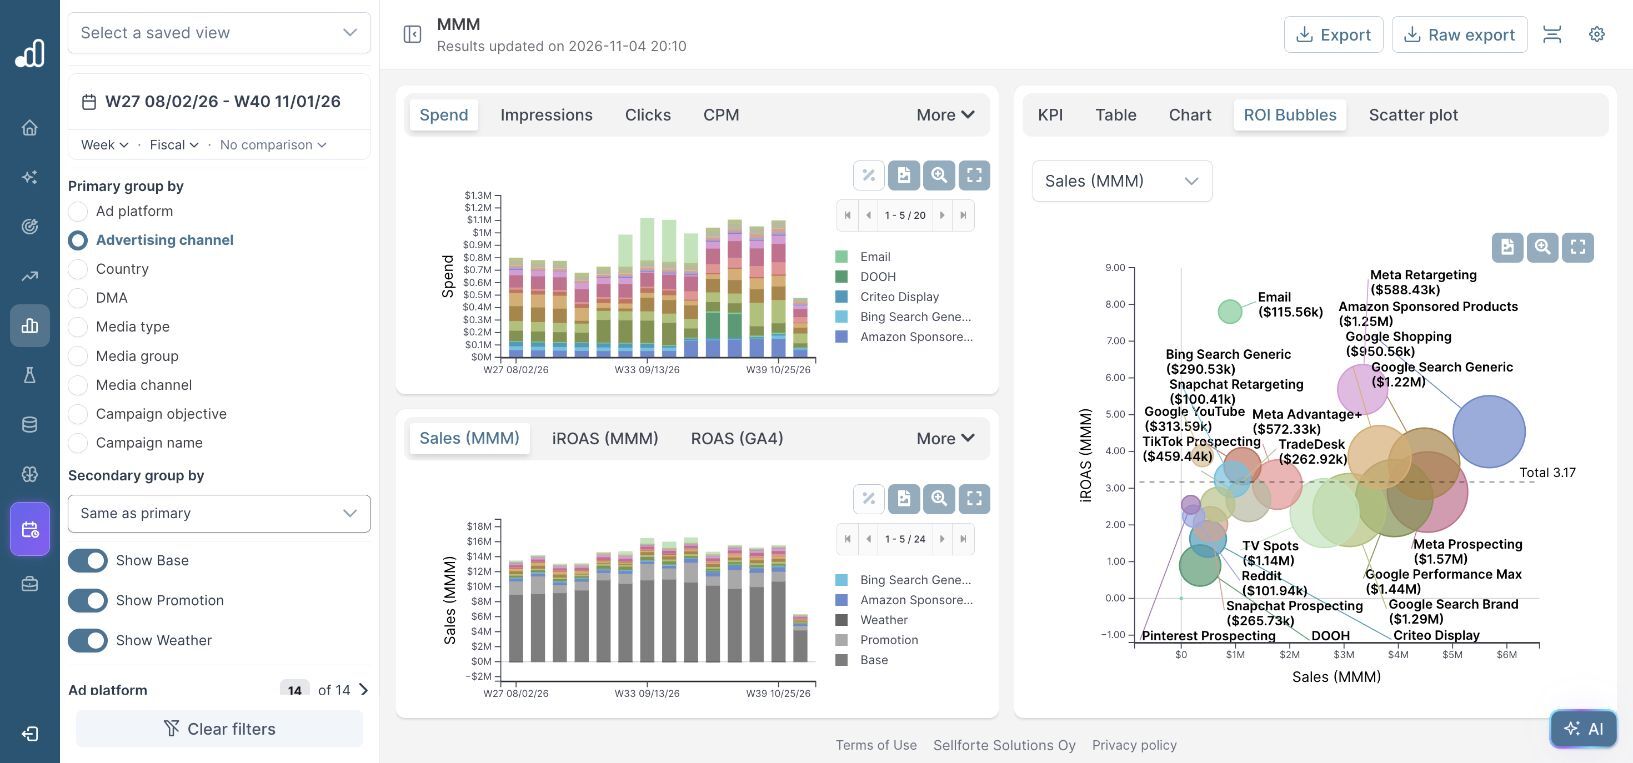
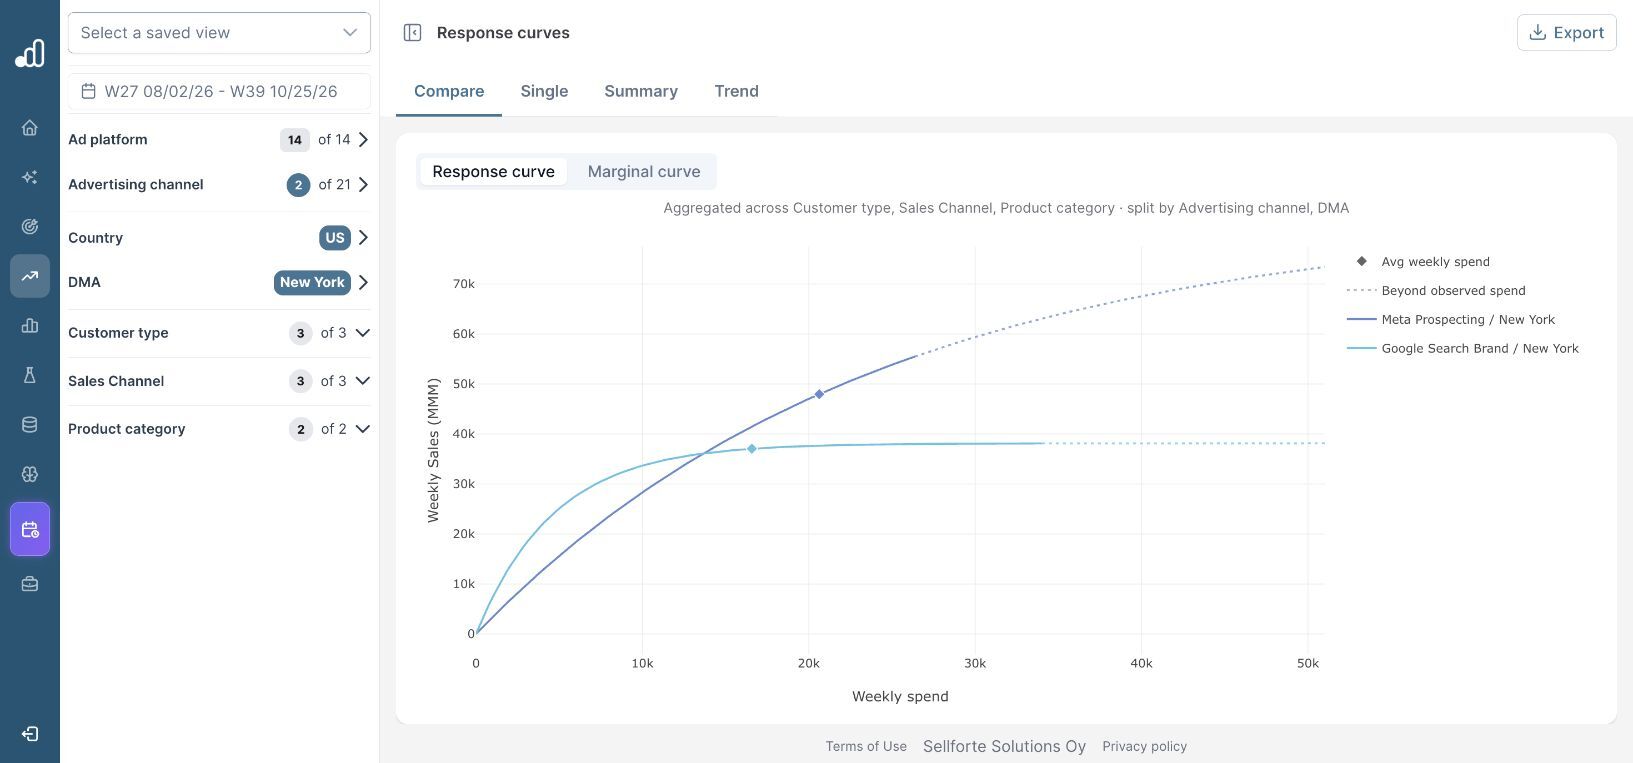
The bubble chart shows each channel's average return over the selected period. For the next budget decision, check saturation and room to scale using response curves and marginal incremental ROAS (miROAS).
Further Reading and Resources
Read the results
Move from measurement to decisions
About the author

Lauri Potka is the Chief Operating Officer at Sellforte, with over 15 years of experience in Marketing Mix Modeling, marketing measurement and media spend optimization. Before joining Sellforte, he worked as a management consultant at the Boston Consulting Group, advising some of the world’s largest advertisers on marketing optimization. Follow Lauri on LinkedIn.
How to Compare MMM Results with Platform ROAS
How to Spot Saturation and Find Room to Scale