MMM Use Case

To forecast the effect of a media budget increase or reduction, create several Budget optimization scenarios in Sellforte’s Media optimizer. Keep the forecast period, sales definition and channel constraints consistent, change the total budget, and compare the modeled sales outcomes.
This walkthrough uses simulated data from the public Sellforte demo, captured on November 15, 2026. All plans cover four weeks starting December 6, 13, 20 and 27, 2026 (shown as W50–W53).
Before you start: A forecast period, an agreed starting budget and channel spending limits.
What you will produce: A comparison of a current-budget plan with a 20% reduction and a 20% increase, including the sales gained or lost.
1. Build the current-budget scenario
Open Planning → Media optimizer and select + to create a scenario. Choose Reference Period as the plan basis, Sales (MMM) as the Optimization KPI and Budget optimization as the mode. Select Use Sellforte performance forecast.
For this example, the planning horizon is W50–W53, 2026, with Use same weeks from last year as the reference period. The scope includes US, all 12 DMAs, both customer types and both sales channels, with Product category set to Overall. Group the plan by Advertising channel; leave DMA grouping unchecked.
The starting budget is $5,107,912. Keep both Promo scenario and Baseline scenario at Last 12 weeks YOY. Set the channel ranges to ±50% of reference spend using the custom percentage field and Apply. Keep Email fixed at its $35,029 reference amount using Single. DOOH has no reference spend or active weeks and remains at zero.
These ranges are assumptions for the demo exercise. In your plan, use limits that reflect buying commitments, campaign capacity and the spend levels supported by the model. Select Optimize to calculate the current-budget case.
2. Copy the scenario and change the total budget
Select +, choose Copy own scenario and copy the current-budget setup. Create one copy for a reduction and one for an increase. Click the budget amount to open New target value and enter the new total.
| Scenario | Total media budget |
|---|---|
| Current budget | $5,107,912 |
| −20% budget | $4,086,330 |
| +20% budget | $6,129,494 |
In the budget editor, clear Update budget boundaries before saving. That keeps the channel limits identical across these three scenarios. Leave the dates, performance forecast, baseline and promotion assumptions unchanged, then optimize each copy.
All three plans optimize their allocation within the same limits. The current-budget case is therefore an optimized plan at the current total budget. To measure the separate benefit of changing the allocation from your existing media plan, add a Reference scenario.
3. Compare sales volume and efficiency
Use Result Table to read the media contribution and iROAS for each scenario. In Result Charts, select the three scenarios under Open scenarios and turn Show base and Show promo on to compare the total sales forecast.
| Scenario | Media-driven Sales (MMM) | Total forecast sales | Media iROAS |
|---|---|---|---|
| −20% budget | $14.20M | $67.33M | 3.48 |
| Current budget | $16.27M | $69.40M | 3.19 |
| +20% budget | $17.72M | $70.85M | 2.89 |
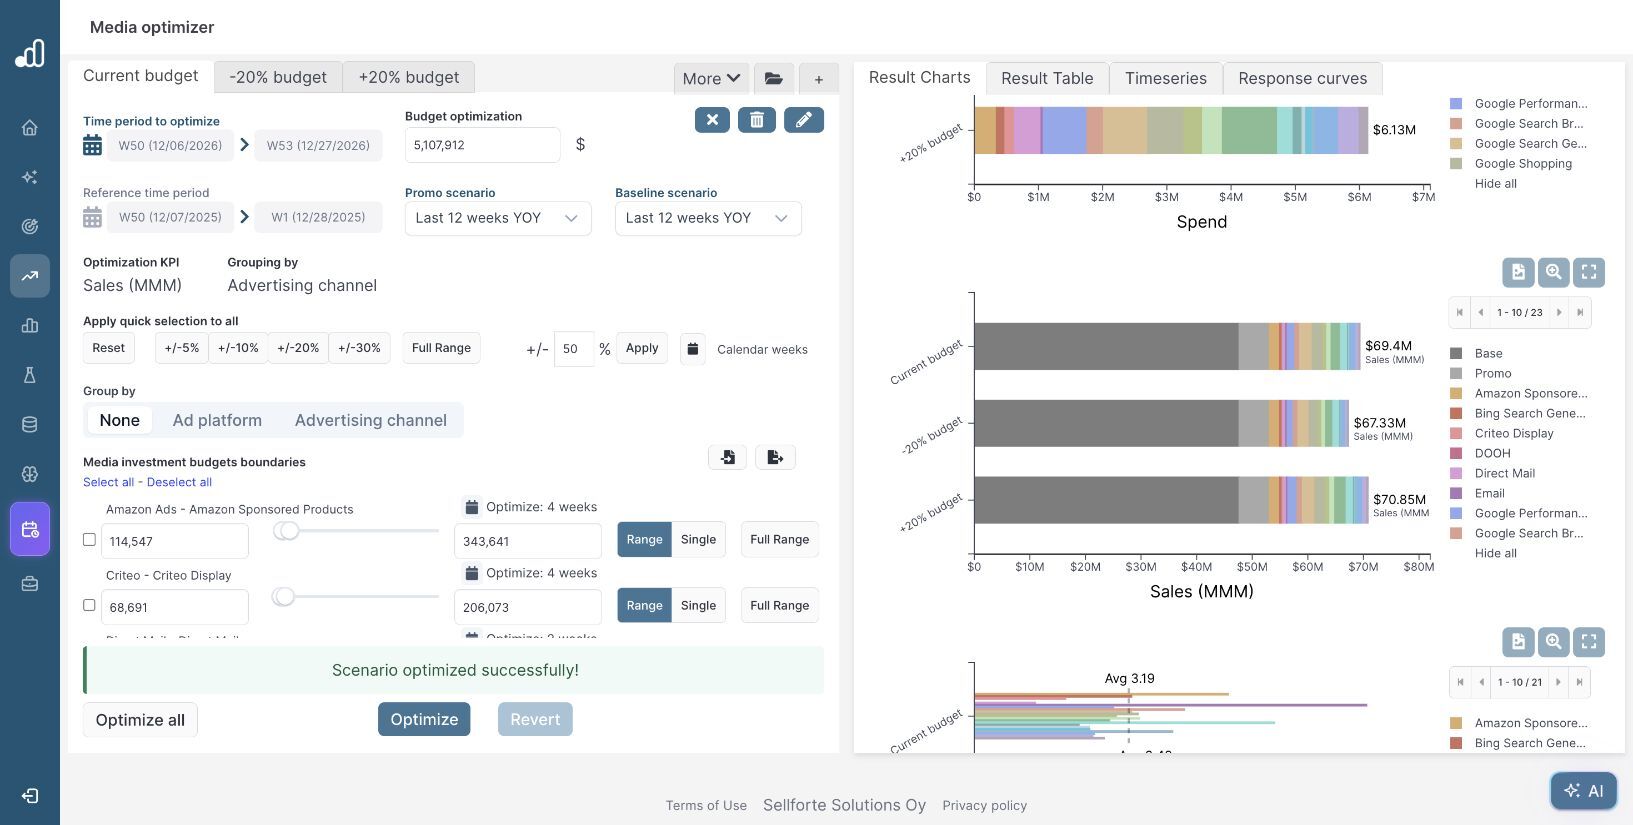
The smaller budget has the highest average iROAS, but it also generates the least modeled sales. The larger budget produces more sales at a lower average return. The forecast therefore lets you assess the trade-off between efficiency and growth directly.
The total sales forecast includes base and promotion effects. Media iROAS uses the media-driven contribution. Dividing total forecast sales by media spend would credit non-media sales to the budget.
4. Evaluate the return on the budget change
Compare the difference in modeled sales with the difference in spend between the matched scenarios:
| Budget decision | Change in spend | Change in modeled sales | Sales per dollar added or saved |
|---|---|---|---|
| Increase from current budget | +$1.02M | +$1.45M | About $1.42 gained per extra $1 |
| Reduce from current budget | −$1.02M | −$2.07M | About $2.03 lost per $1 saved |
These calculations use rounded dashboard forecasts. They describe the average modeled return over each full budget change, including the optimizer's allocation changes. They are different from the local marginal incremental ROAS (miROAS) at one spend level.
Use the additional sales and their contribution margin to assess whether the extra $1.02M fits the business’s growth and profitability targets. For a required budget cut, the smaller-budget case quantifies the modeled sales cost and provides the channel allocation that limits that cost under the selected constraints.
Before adopting the plan, review Result Table for channels at their limits and Timeseries for weekly pacing. These are model forecasts under the selected assumptions; the resulting budget and pacing still need to fit stock, campaign and cash constraints.
Further Reading and Resources
Build the scenarios
Assess the next investment
About the author

Lauri Potka is the Chief Operating Officer at Sellforte, with over 15 years of experience in Marketing Mix Modeling, marketing measurement and media spend optimization. Before joining Sellforte, he worked as a management consultant at the Boston Consulting Group, advising some of the world’s largest advertisers on marketing optimization. Follow Lauri on LinkedIn.
How to Spot Saturation and Find Room to Scale
How to Measure Digital Advertising’s Impact on In-Store Sales