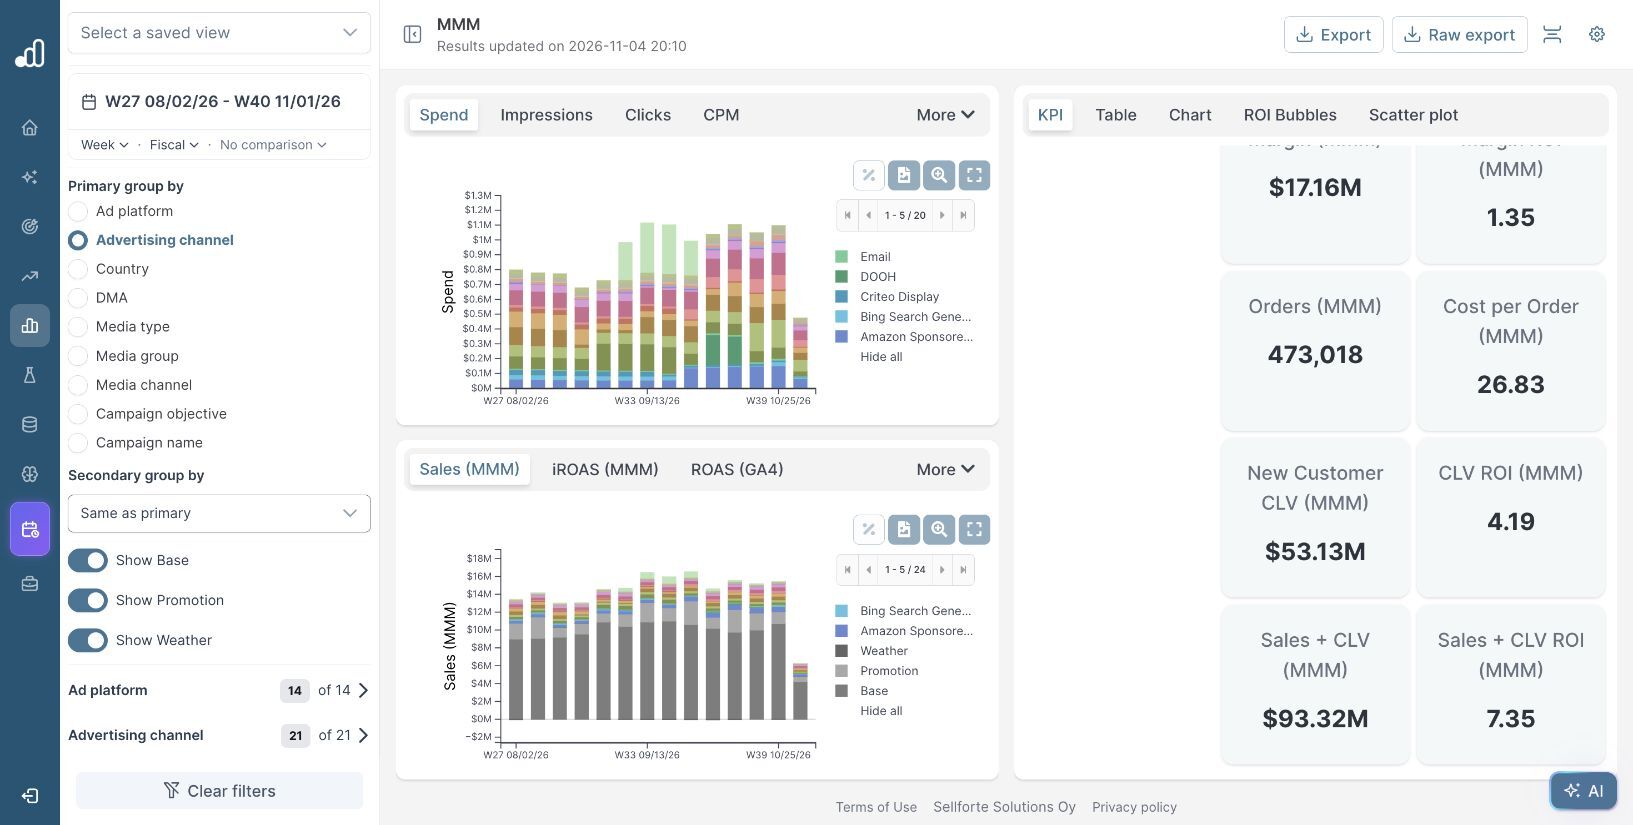
MMM Use Case

To measure how digital advertising contributes to in-store sales, open Dashboards → MMM and filter Sales Channel to Stores. The channel table then shows the modeled store-sales contribution of your media, including digital channels whose effects can be missed by online-only reporting.
This walkthrough uses simulated data from the public Sellforte demo, captured on November 15, 2026. The selected US period is W27 August 2–W40 November 1, 2026.
Before you start: MMM results that separate ecommerce and store sales, with both sales destinations included in the model.
What you will produce: A comparison of each digital channel’s online and store contribution, plus its combined incremental return.
1. Select the media channels and period
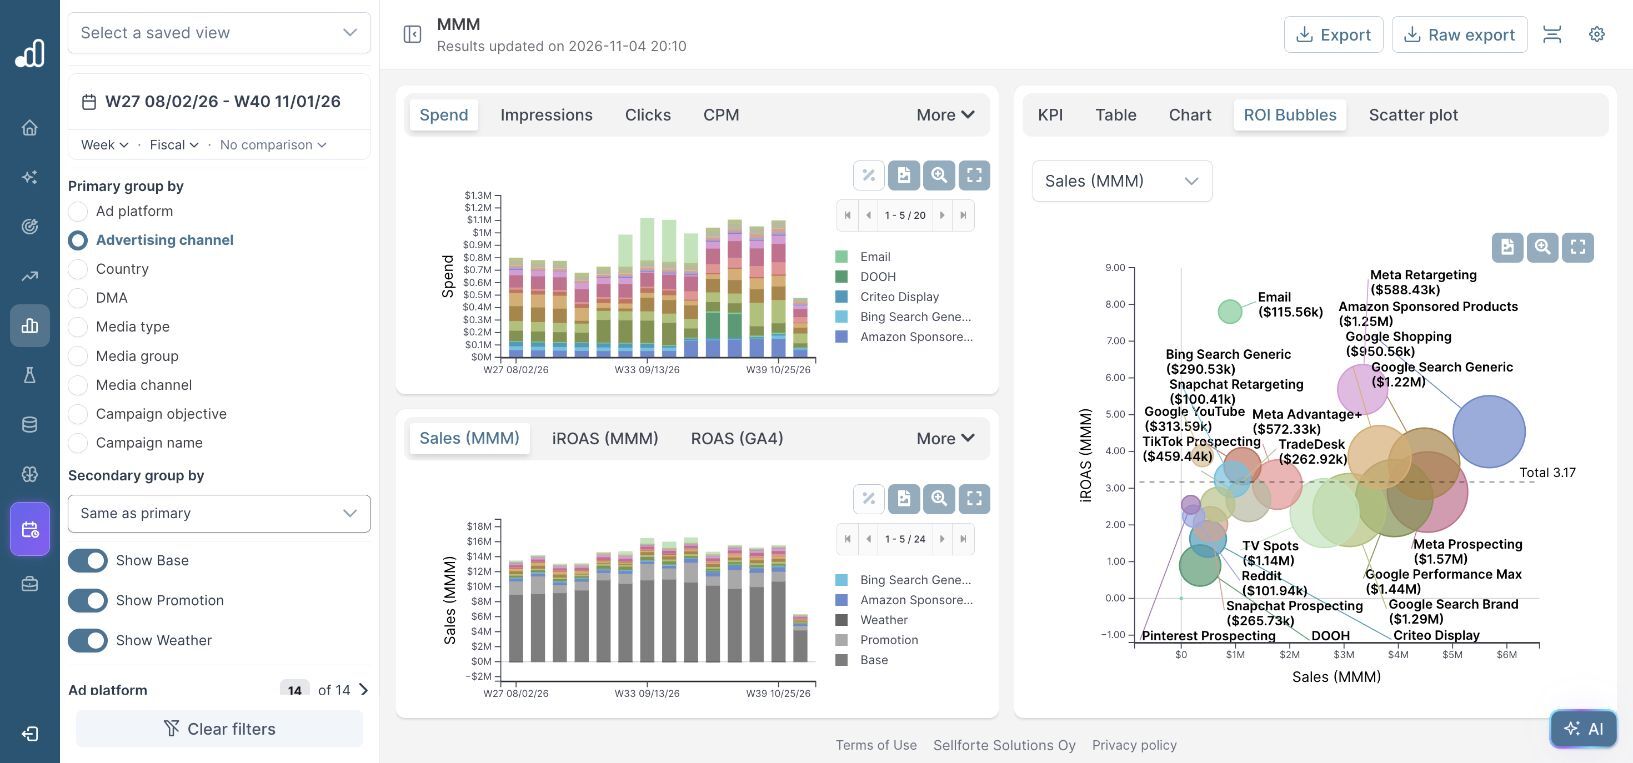
Open MMM and choose Advertising channel as the primary grouping. Keep the period and Country selection fixed. You can leave the full channel list visible or narrow the Advertising channel filter to the digital activity you want to evaluate.
For this walkthrough, compare Google YouTube, Google Search Brand and Meta Prospecting. Keep the same channel selection when changing the sales destination.
2. Read the contribution to store sales
Scroll down the filter panel to Sales Channel. Open it, deselect the existing options, and select Stores. Open Table on the right and read Sales (MMM) for each channel.
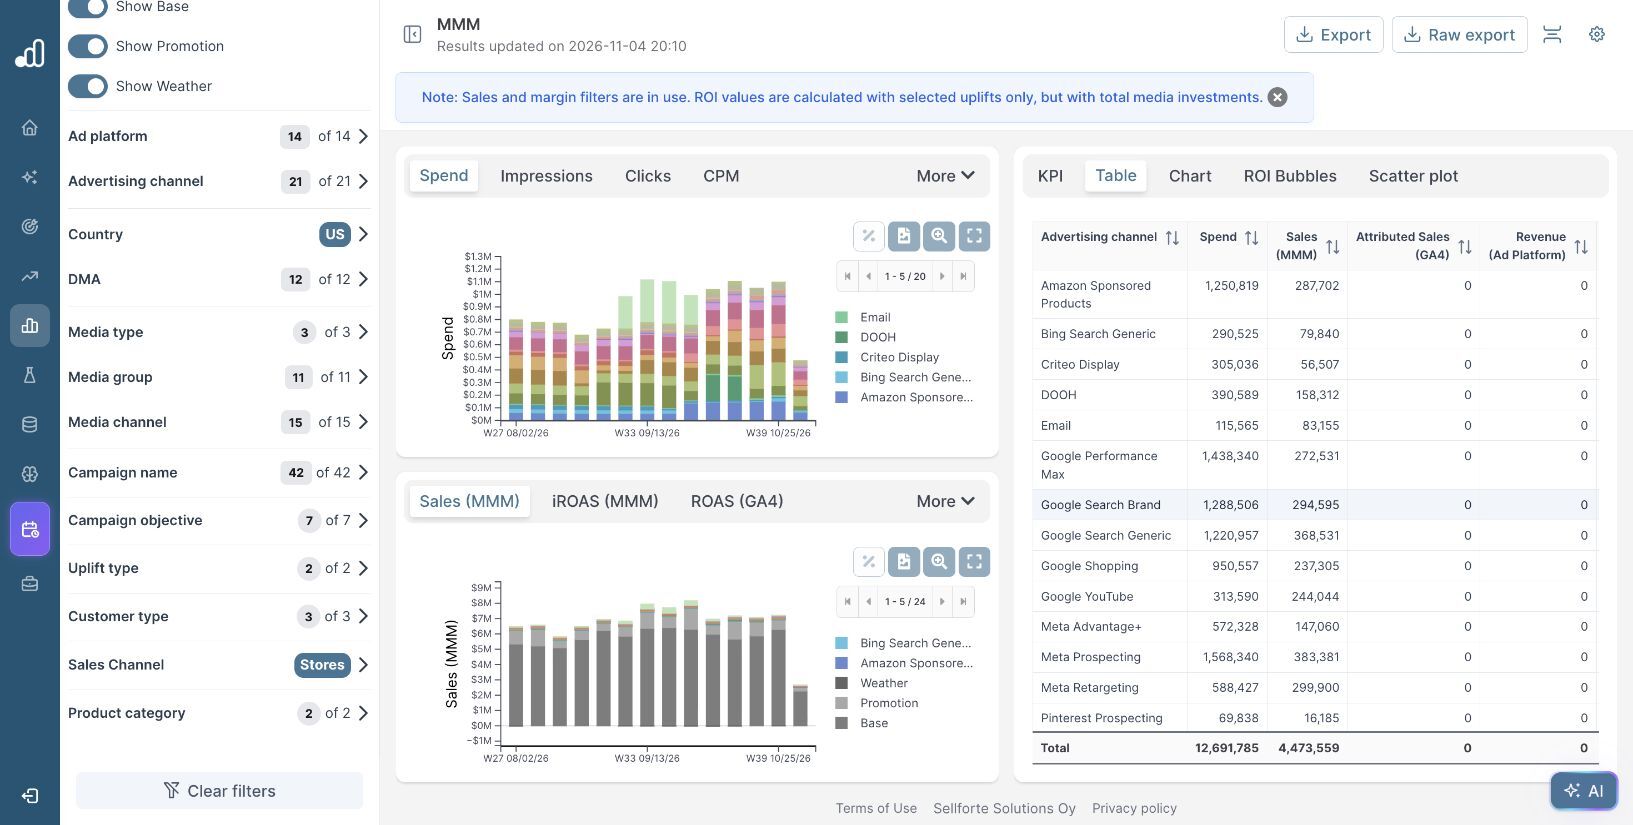
The notice at the top of the demo explains the denominator: sales and margin filters limit the selected uplift, while ROI still uses total media investment. A store-only iROAS is therefore the store contribution per dollar of that channel's full spend. It is not the return on a separate store-only budget.
3. Compare Stores with Ecom
Change Sales Channel from Stores to Ecom without changing the period, market or media filters. Read the same channel rows. The following values come from those two views.
| Digital channel | Ecom Sales (MMM) | Store Sales (MMM) | Store share of combined sales |
|---|---|---|---|
| Google YouTube | $884,785 | $244,044 | 21.6% |
| Google Search Brand | $2,805,397 | $294,595 | 9.5% |
| Meta Prospecting | $4,155,417 | $383,381 | 8.4% |
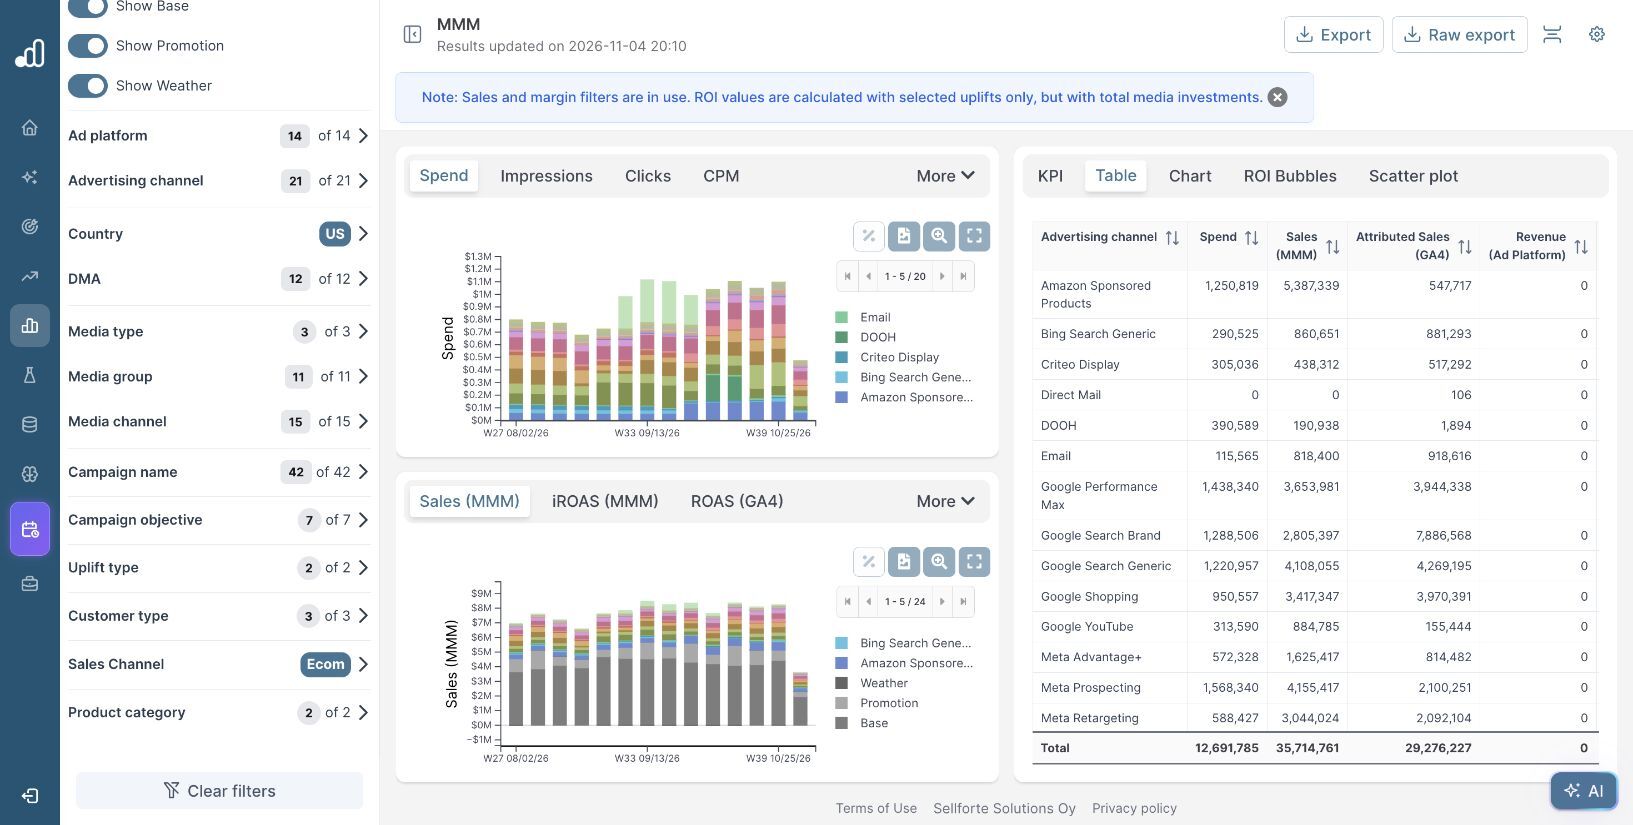
For YouTube, the modeled store contribution is $244,044 out of $1,128,829 across Ecom and Stores. The store share is $244,044 ÷ ($884,785 + $244,044) ≈ 21.6%. An assessment limited to ecommerce would leave that portion of its modeled sales contribution out.
These percentages describe where the modeled incremental sales occurred. They do not identify individual shoppers or imply that a known percentage of ad viewers visited a store.
4. Use the combined contribution in budget decisions
For an omnichannel budget, combine the relevant sales contributions and divide by the channel's spend once. YouTube's spend is $313,590 in both filtered views. Its ecommerce contribution gives approximately 2.82 iROAS, and the store contribution adds approximately 0.78. Together, the modeled return is 3.60.
Use this combined return when comparing digital investment with channels evaluated on total retail sales. Keep store-only results available for retail teams assessing how media supports their sales targets. If online and store margins differ, also compare the corresponding margin metrics before drawing a profitability conclusion.
To decide how much to invest next, take the full sales scope into a budget scenario and inspect marginal incremental ROAS (miROAS). This keeps a digital channel's store contribution in the decision while accounting for diminishing returns.
Further Reading and Resources
Read the full sales picture
Plan with the full contribution
About the author

Lauri Potka is the Chief Operating Officer at Sellforte, with over 15 years of experience in Marketing Mix Modeling, marketing measurement and media spend optimization. Before joining Sellforte, he worked as a management consultant at the Boston Consulting Group, advising some of the world’s largest advertisers on marketing optimization. Follow Lauri on LinkedIn.
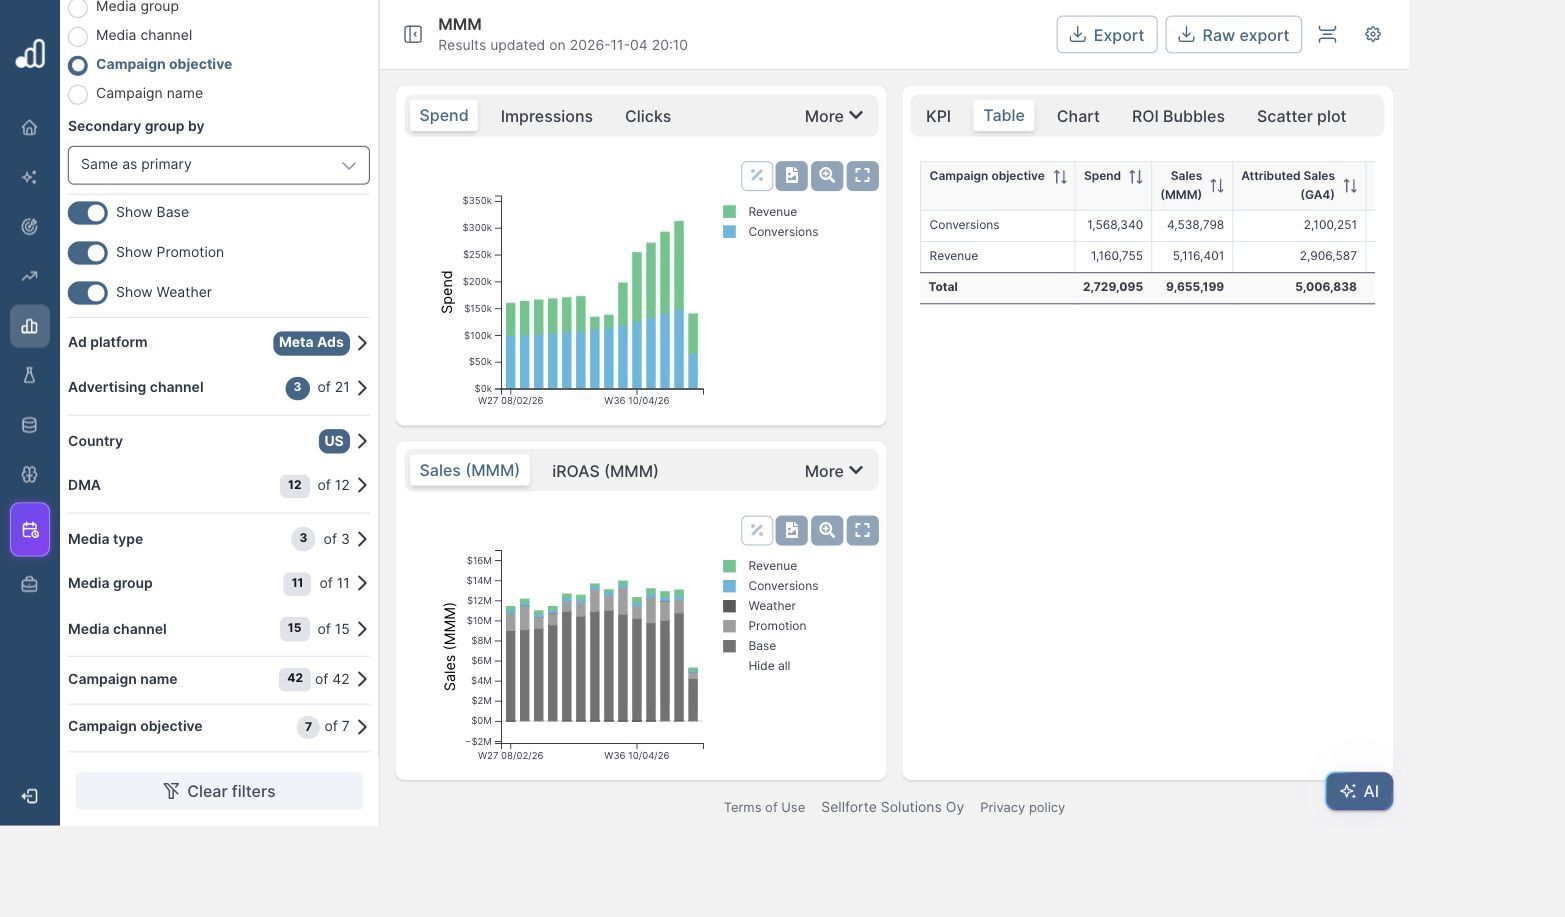
How to Compare Campaign Objectives by Incremental Sales
How to See Which Channels Drive Incremental Sales