

MMM Use Case

To compare media performance across regions, select DMA under Primary group by in the Sellforte MMM dashboard. Start with the overall media mix, then filter to one advertising channel to see how its sales contribution and iROAS differ between markets.
The screenshots and figures use simulated data from the public Sellforte demo. The dashboard is set to US and the displayed period W27 August 2 to W40 November 1, 2026.
Before you start: MMM results and media investment available at a consistent geographic level. The public demo uses US designated market areas (DMAs).
What you will produce: A regional comparison that identifies where to investigate stronger or weaker channel performance.
1. Compare the regional media mix
Open Dashboards → MMM, choose the period, and select DMA as the primary grouping. Leave all advertising channels selected initially. Open Table to compare each region’s Spend, Sales (MMM) and iROAS (MMM).
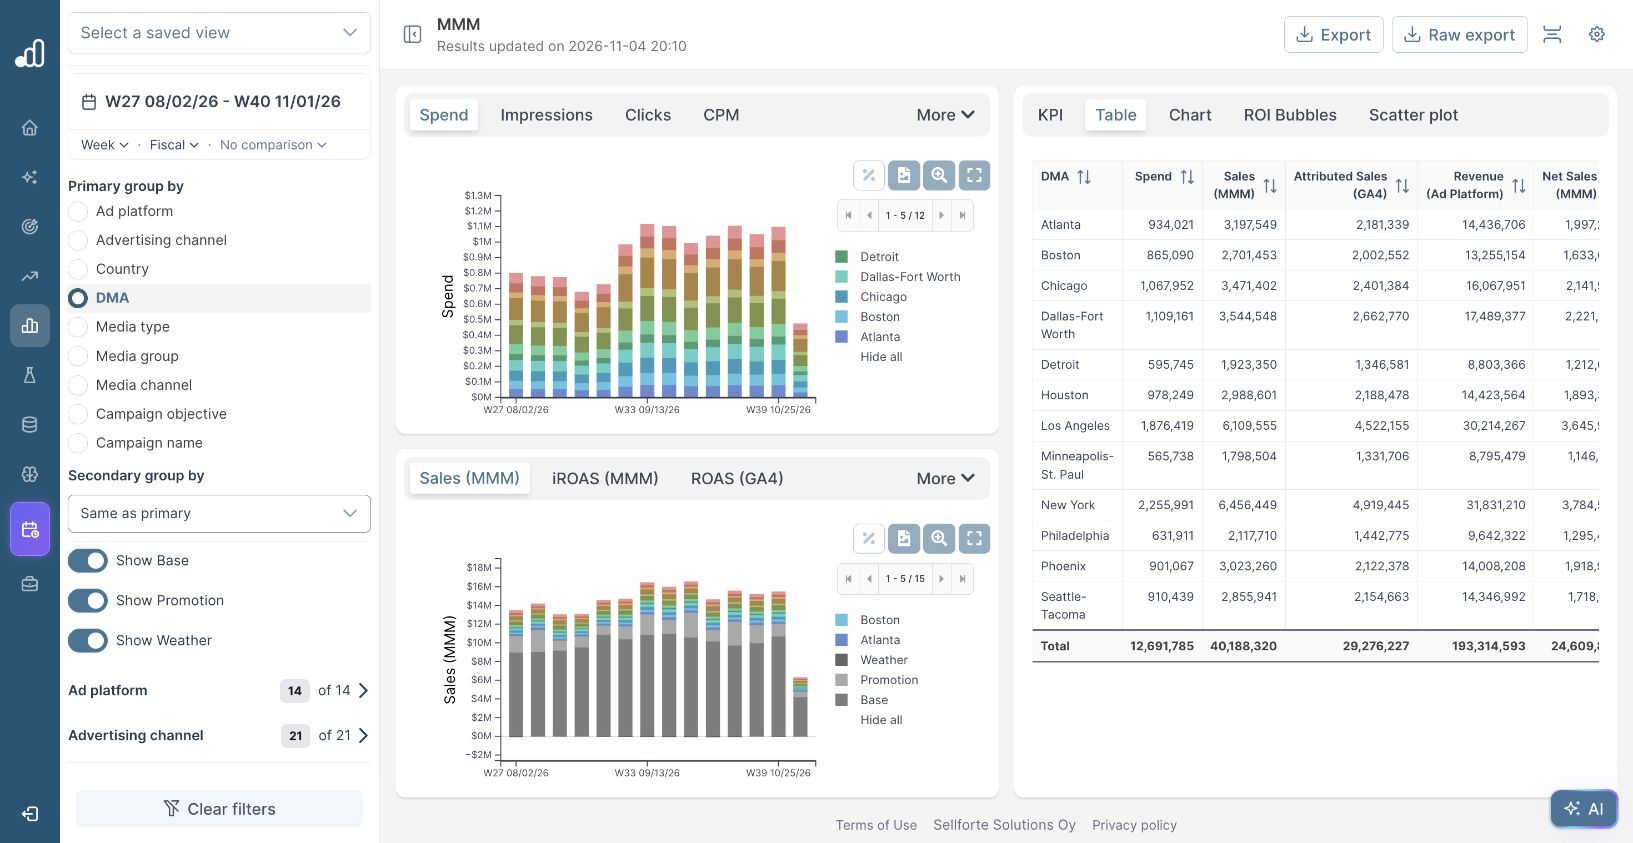
| DMA | Spend across media | Sales (MMM) | iROAS |
|---|---|---|---|
| New York | $2,255,991 | $6,456,449 | 2.86 |
| Los Angeles | $1,876,419 | $6,109,555 | 3.26 |
| Chicago | $1,067,952 | $3,471,402 | 3.25 |
New York produces the largest modeled media contribution of these three regions, while Los Angeles and Chicago produce more sales per media dollar. Read both measures: a large market can have a substantial sales contribution without the highest return.
This first comparison reflects each region’s entire media mix. Differences can come from which channels receive the budget as well as how those channels perform locally.
2. Compare the same channel in each region
Open the Advertising channel filter. Choose Deselect all and select Meta Prospecting, then return to the dashboard. Keep DMA as the primary grouping, Country as US, and the same dates and sales filters.
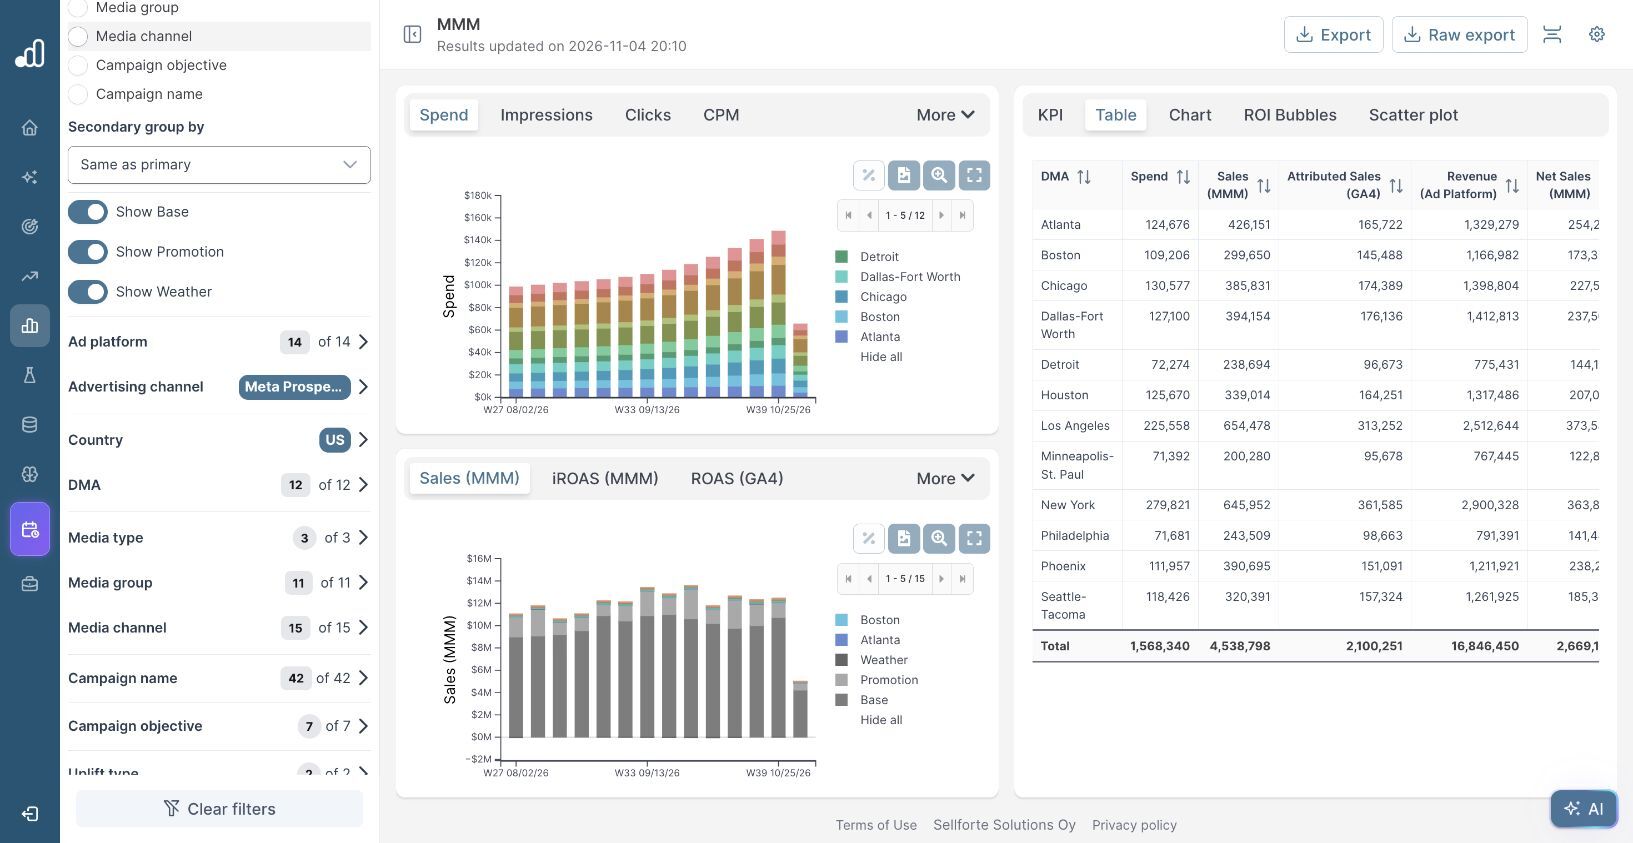
| DMA | Meta Prospecting spend | Sales (MMM) | iROAS |
|---|---|---|---|
| New York | $279,821 | $645,952 | 2.31 |
| Los Angeles | $225,558 | $654,478 | 2.90 |
| Chicago | $130,577 | $385,831 | 2.95 |
| Phoenix | $111,957 | $390,695 | 3.49 |
Meta Prospecting’s overall iROAS is 2.89. That average combines a 2.31 return in New York with 3.49 in Phoenix. Los Angeles generates slightly more incremental sales than New York with less spend in the selected period.
Calculate a combined regional return by dividing summed incremental sales by summed spend. A simple average of the regional iROAS values would give a small market the same weight as a large one.
3. Investigate the regional differences
For the regions you want to examine, use the DMA filter to narrow the view and inspect the weekly sales and investment charts. Check whether the difference persists across weeks or is concentrated in one part of the period. Compare equivalent weeks and keep the customer and sales-channel scope unchanged.
The New York result suggests a useful follow-up: determine whether the lower return reflects its current spend level, local media costs, campaign mix or the sales response in that market. The aggregate iROAS comparison identifies the difference; it does not, by itself, explain its cause.
If the business has different margins or a different new-customer mix across regions, use the corresponding outcome alongside revenue. The guides to incremental margin and new-customer contribution show how to make those comparisons.
4. Turn regional opportunities into a budget proposal
Phoenix is a candidate to examine for additional Meta Prospecting investment in this example. Before moving budget, compare the forecast return at the proposed spend and check the market’s available scale. The highest historical average return does not automatically identify the best destination for the next dollar.
Where your model supports regional response curves or planning dimensions, use them to compare the proposed market allocations. Review marginal incremental ROAS (miROAS) and keep local delivery constraints in the plan. This turns the regional comparison into a specific question: can moving a defined amount between these markets improve the expected total contribution?
Further Reading and Resources
Understand the results
About the author

Lauri Potka is the Chief Operating Officer at Sellforte, with over 15 years of experience in Marketing Mix Modeling, marketing measurement and media spend optimization. Before joining Sellforte, he worked as a management consultant at the Boston Consulting Group, advising some of the world’s largest advertisers on marketing optimization. Follow Lauri on LinkedIn.


