MMM Use Case

To explain why sales changed year on year, compare the same business scope in Sellforte’s Home → History view and read the Sales Decomposition. It separates the change into media, promotion, baseline and other modeled drivers, so you can see which parts of the business explain the movement.
In this public Sellforte demo example, US sales fell by $26.63 million while media iROAS improved. The decomposition shows why those two results can happen together. The same workflow applies when sales grow.
Before you start: A year-on-year comparison covering the same market, customer types and sales channels.
What you will produce: An explanation of the sales movement and a clear direction for the follow-up analysis.
1. Align the period and business scope
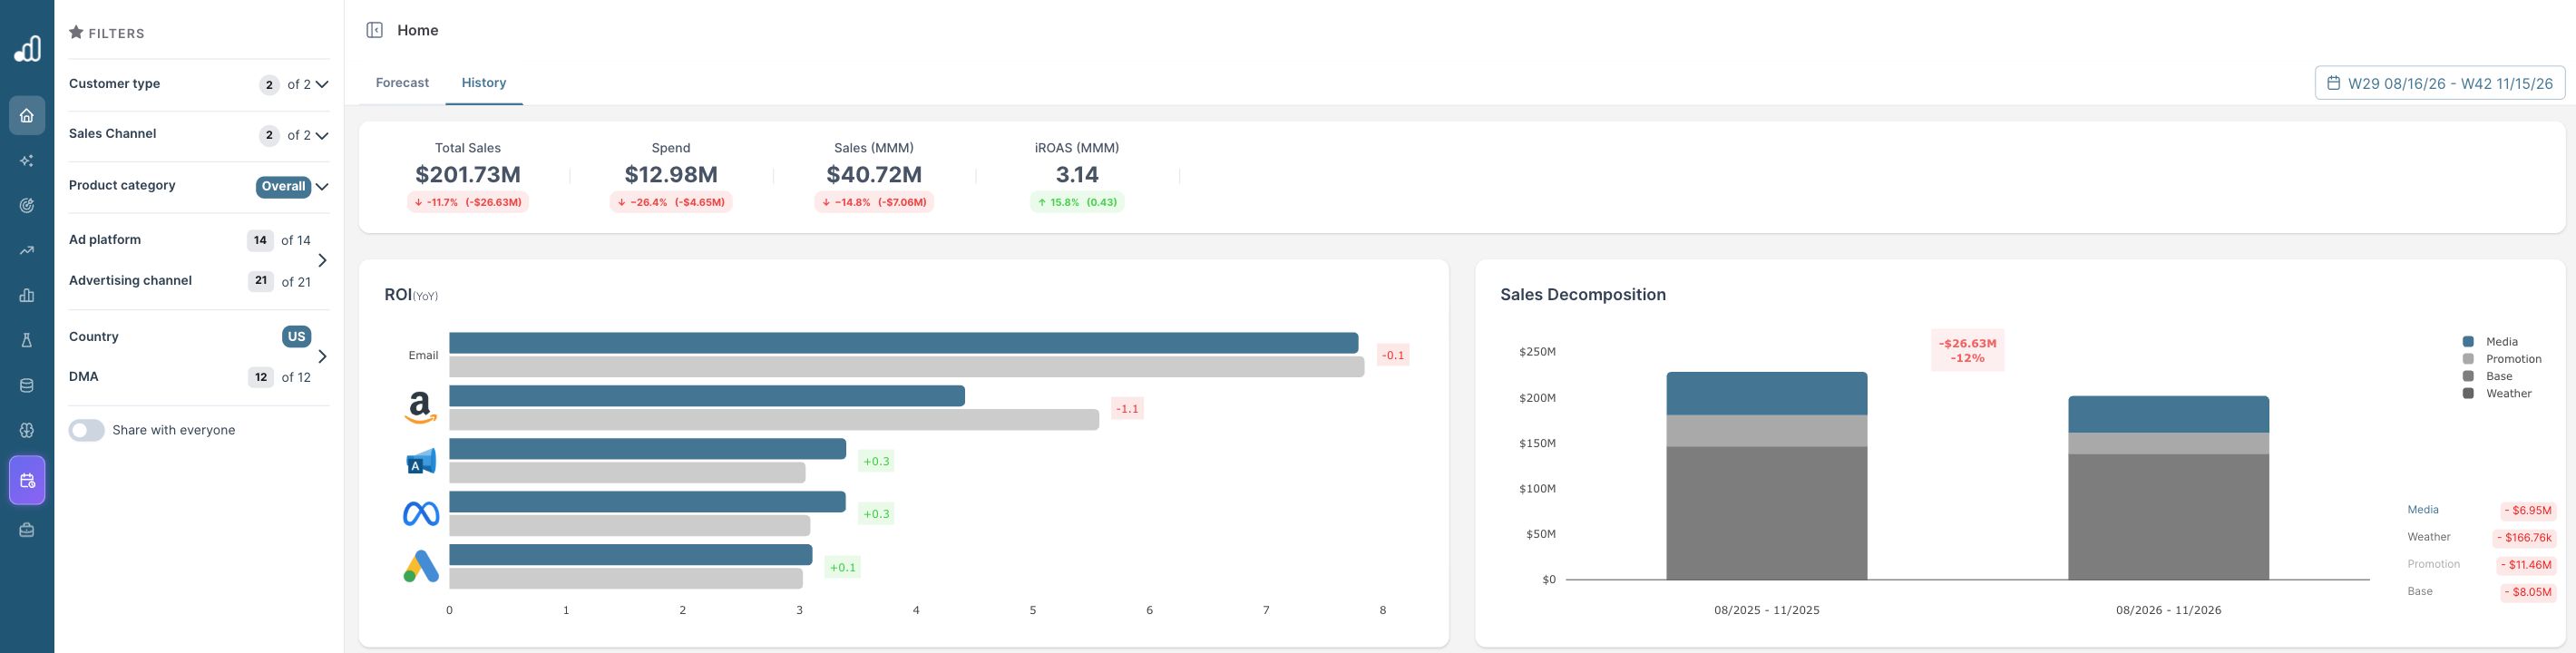
Open Home and select History. Use the sidebar to confirm the period and filters. This example uses the displayed range W29 August 16–W42 November 15, 2026. The comparison bars are labeled August–November 2026 and August–November 2025. Country is US, with all 12 DMAs, both customer types, both sales channels and the Overall product category included.
Check the dates on the comparison chart, especially when the selected period ends partway through a month. A comparison between a partial current month and a full prior-year month would answer a different question.
2. Establish what changed in sales and efficiency
| Metric | Selected period | Year-on-year change |
|---|---|---|
| Total sales | $201.73M | −11.7% / −$26.63M |
| Media investment | $12.98M | −26.4% / −$4.65M |
| Media iROAS | 3.14 | +15.8% / +0.43 |
The business generated fewer sales, spent substantially less on media and earned a higher incremental return per media dollar. An improvement in efficiency can coexist with a reduction in sales volume. The iROAS movement alone does not explain the total sales decline.
The next question is how much of the change came from media and how much came from other sources. Use the decomposition for that bridge.
3. Read the contribution of each sales driver
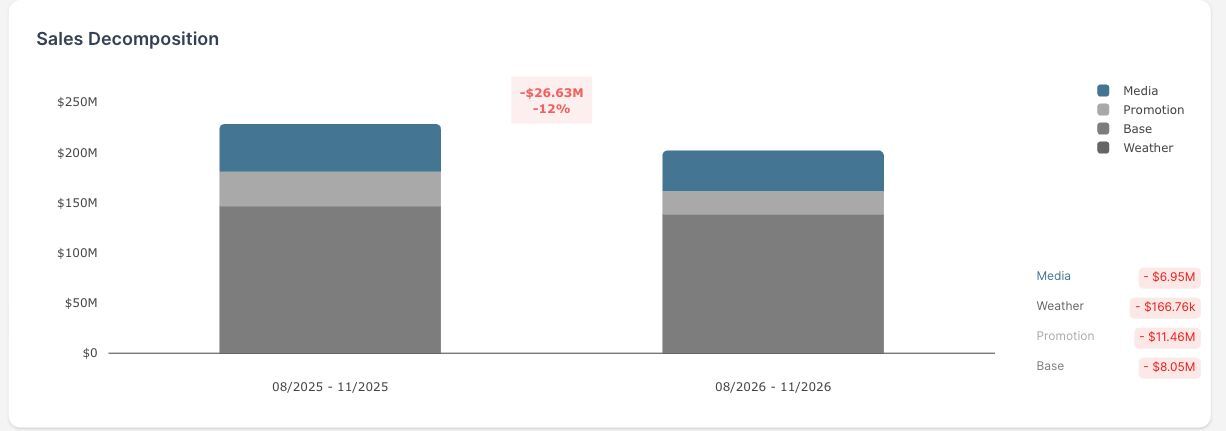
The Sales Decomposition compares stacked sales bars for the two periods and shows the change by component on the right.
| Driver | Change in sales contribution | Approximate share of the decline |
|---|---|---|
| Promotion | −$11.46M | 43.0% |
| Base | −$8.05M | 30.2% |
| Media | −$6.95M | 26.1% |
| Weather | −$166.76k | 0.6% |
The displayed components add to approximately −$26.63M. The shares use each component’s absolute decline divided by the total decline; small differences are due to rounding.
Promotion and base contribution together fell by $19.51M, about 73% of the total decline. Media accounts for roughly a quarter. This gives the sales discussion a more useful starting point than attributing the entire shortfall to advertising.
4. Follow the largest changes into the relevant views
Start with promotions because they explain the largest share here. Review changes in promotional timing, discount depth and supported products. Use the promotion-versus-media walkthrough to examine the periods behind the aggregate result.
For the base decline, investigate the business factors that changed outside the measured media and promotion contributions. Depending on the model and available data, these could include demand trends, distribution, assortment or pricing. The Base total is an aggregate; it does not identify a particular commercial cause by itself.
For media, break down the $6.95M decline by channel and market. The lower total spend makes reduced media contribution plausible, but channel-level analysis is needed to separate budget reductions from changes in performance. The channel performance diagnosis provides that next step.
5. Direct the business response toward the drivers
In this example, the first follow-up belongs with the teams responsible for promotions and underlying sales demand, alongside a review of the media budget cuts. Marketing can then assess how much incremental sales volume a revised plan could recover at an acceptable return.
A blanket media increase would need to address a specific growth opportunity and be supported by a forecast. Use the budget-change scenario workflow to estimate that opportunity. Keep the promotion and baseline assumptions explicit so that a media plan is not expected to repair every part of the sales shortfall.
Further Reading and Resources
About the author

Lauri Potka is the Chief Operating Officer at Sellforte, with over 15 years of experience in Marketing Mix Modeling, marketing measurement and media spend optimization. Before joining Sellforte, he worked as a management consultant at the Boston Consulting Group, advising some of the world’s largest advertisers on marketing optimization. Follow Lauri on LinkedIn.
How to Compare Channels by Incremental Margin
How to See Which Channels Drive Incremental Sales