MMM Use Case

To see which experiments inform your MMM, open an experiment in Sellforte and inspect Model calibration impact. The panel lists the model features the study informs and the study’s share of calibration evidence for each feature. Compare studies against the same feature to understand which evidence carries the most weight.
This walkthrough uses two Meta Conversion Lift studies in the public Sellforte demo: a July 2026 prospecting study and an August 2026 full-funnel study. Both inform Meta Prospecting, and their calibration weights differ. The study data is simulated.
Before you start: Experiment results connected to Sellforte and a channel or model feature whose calibration you want to inspect.
What you will produce: An understanding of which studies inform that part of the model, how their evidence is weighted, and where further testing would be useful.
1. Open the experiment and confirm what it measured
Go to Experiments, find Meta Prospecting — Conversion Lift repeat, Jul 2026 and select Show analyses. Open the Purchase - Web analysis. Confirm the experiment’s outcome, dates and scope before interpreting its link to the MMM.
The study ran from July 5 to August 1, 2026. Its result cards show $288.61k in spend, $890k in incremental sales and 3.08 test iROAS, with a 90% confidence interval of 2.68–3.48.

The confidence interval describes uncertainty in the experimental estimate. It serves a different purpose from the calibration weight shown below.
2. Read the experiment’s model calibration impact
Scroll to Model calibration impact. In this example, the panel lists features labeled Meta Ads | Meta Prospecting | Conversions | US | [DMA] | short, with 35.3% weight for each of the 12 listed DMAs.
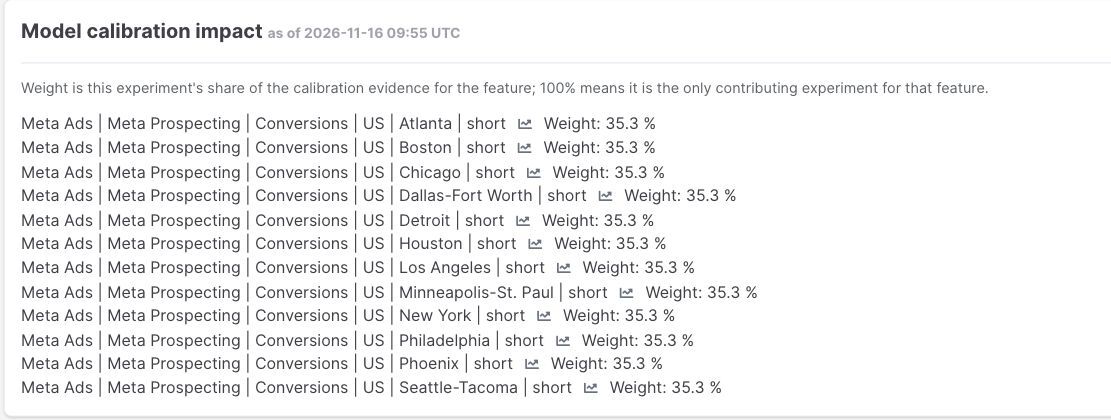
For the Atlanta Meta Prospecting feature, 35.3% means this study contributes that share of its calibration evidence. It does not mean that 35.3% of Atlanta sales are incremental, or that the experiment has 35.3% statistical confidence. A weight of 100% would mean it is the only contributing experiment for that feature.
The repeated 35.3% rows are separate mappings of the same study to different features. Do not add them across DMAs or treat them as 12 independent experiments.
3. Compare another study on the same feature
Return to the experiment list and open Meta full-funnel — Conversion Lift, Aug 2026, then its Purchase - App + Web analysis. It ran from August 2–29 and reports test iROAS of 3.14, with a 90% interval of 2.76–3.51.
Its calibration panel maps the study to both Meta Advantage+ and Meta Prospecting features. For Meta Prospecting, the displayed weight is 48.5%. For Meta Advantage+, it is 81.0%.
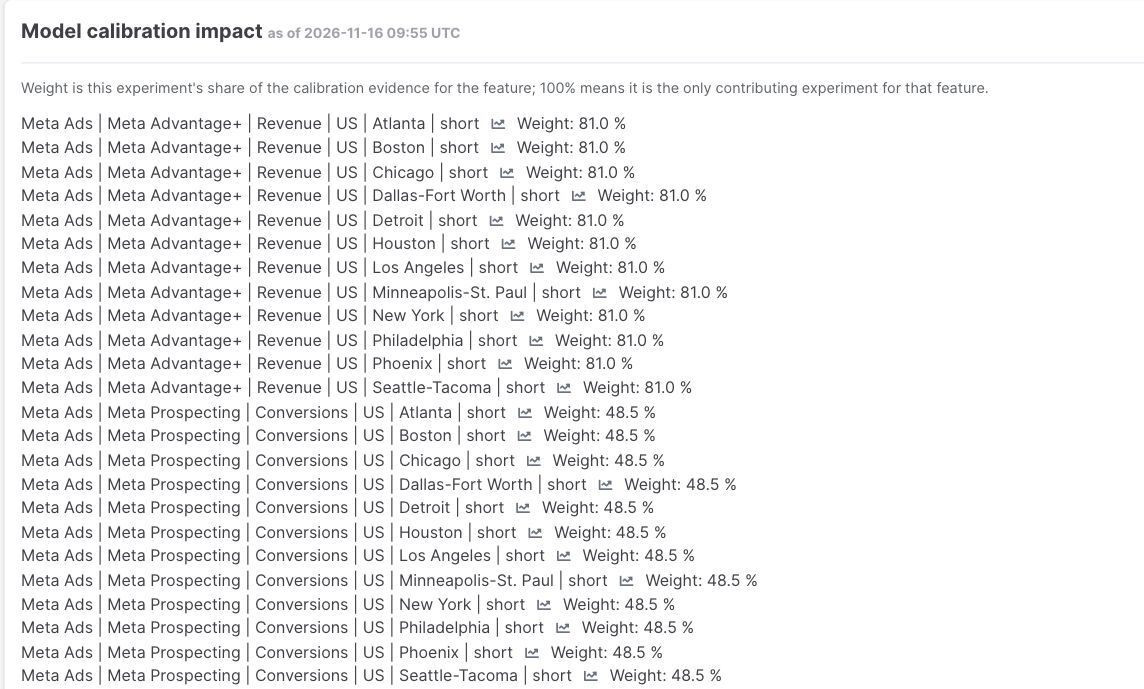
| Study | Feature being compared | Calibration evidence weight |
|---|---|---|
| July prospecting / Purchase - Web | Meta Prospecting · Conversions · US · Atlanta · short | 35.3% |
| August full-funnel / Purchase - App + Web | Meta Prospecting · Conversions · US · Atlanta · short | 48.5% |
| August full-funnel / Purchase - App + Web | Meta Advantage+ · Revenue · US · Atlanta · short | 81.0% |
For the same Atlanta Meta Prospecting feature, the two studies together account for 83.8% of calibration evidence. The remaining 16.2% comes from other contributing evidence in that feature’s experiment set. These two examples are not the full inventory.
The 81.0% Advantage+ weight has a different denominator because it belongs to a different feature. It cannot be added to the Prospecting weights.
4. Separate evidence weight from the final MMM result
A calibration weight tells you how the experiment contributes to the evidence used to inform a feature. It does not tell you how far the final MMM iROAS moved, and the final MMM result need not equal the test’s point estimate.
The studies also measure different outcome scopes: Purchase - Web and Purchase - App + Web. Keep that distinction visible when comparing their results. Sellforte’s guide to calibration with Meta Conversion Lift studies explains how experiment evidence informs the model.
5. Use the evidence map to prioritize further testing
For a Meta Prospecting planning decision, the July and August studies are both relevant sources of calibration evidence. The August study carries more weight for the selected feature. Read those studies before commissioning another test intended to answer the same question.
Then look for decisions where the available experiments are old, narrowly scoped or poorly matched to the activity you now plan to scale. Those gaps can help prioritize the next experiment. A feature with several relevant studies may need a different follow-up from one supported by a single study in a very different setting.
Use the experiment mapping alongside market-level model fit checks. Together, they show the evidence informing the model and how well it represents the sales you plan against.
Further Reading and Resources
Understand experiment calibration
Review the model evidence
About the author

Lauri Potka is the Chief Operating Officer at Sellforte, with over 15 years of experience in Marketing Mix Modeling, marketing measurement and media spend optimization. Before joining Sellforte, he worked as a management consultant at the Boston Consulting Group, advising some of the world’s largest advertisers on marketing optimization. Follow Lauri on LinkedIn.
How to Spot Saturation and Find Room to Scale
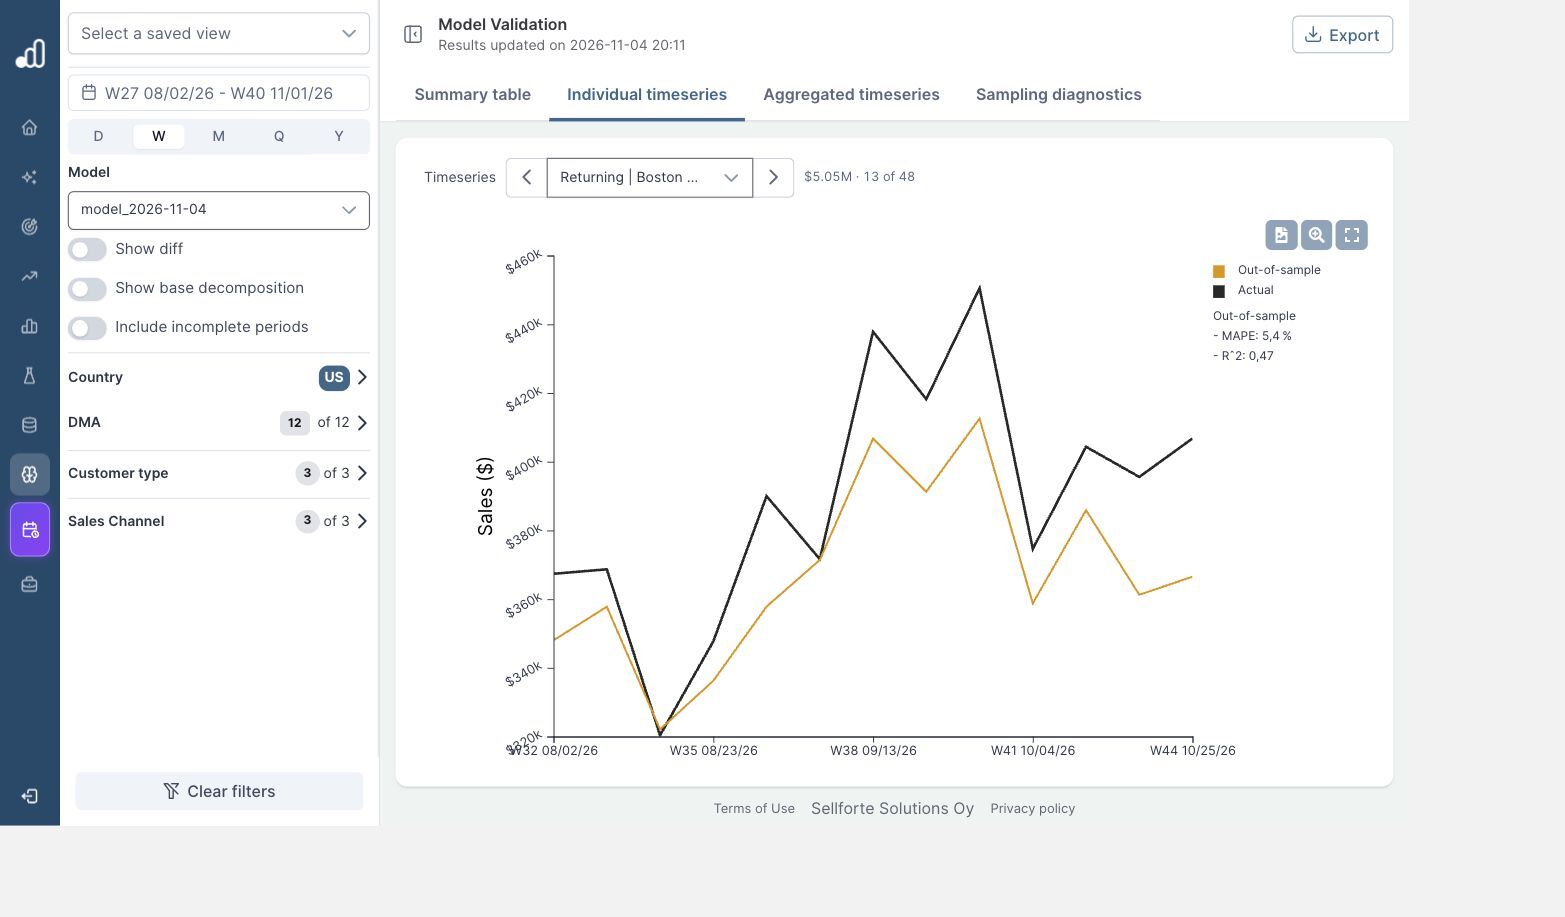
How to Check MMM Model Fit for the Markets You Plan In