MMM Use Case

To understand a channel's performance change, compare its spend, incremental sales and iROAS across periods, then inspect the delivery metrics behind the change. Sellforte's MMM dashboard lets you keep that analysis within one filtered view.
This walkthrough uses Meta Prospecting in the US public Sellforte demo. It compares the displayed periods W27 August 2–W40 November 1, 2026 and W13 April 26–W26 July 26, 2026. Screenshots and values are simulated demo data captured on November 15, 2026.
Before you start: You need complete data for both periods and access to the channel's media metrics. Note promotions, creative changes and tracking changes that may affect the comparison.
What you will produce: A quantified description of the change, plausible explanations to check, and an action tied to the evidence.
1. Select the channel and comparison period
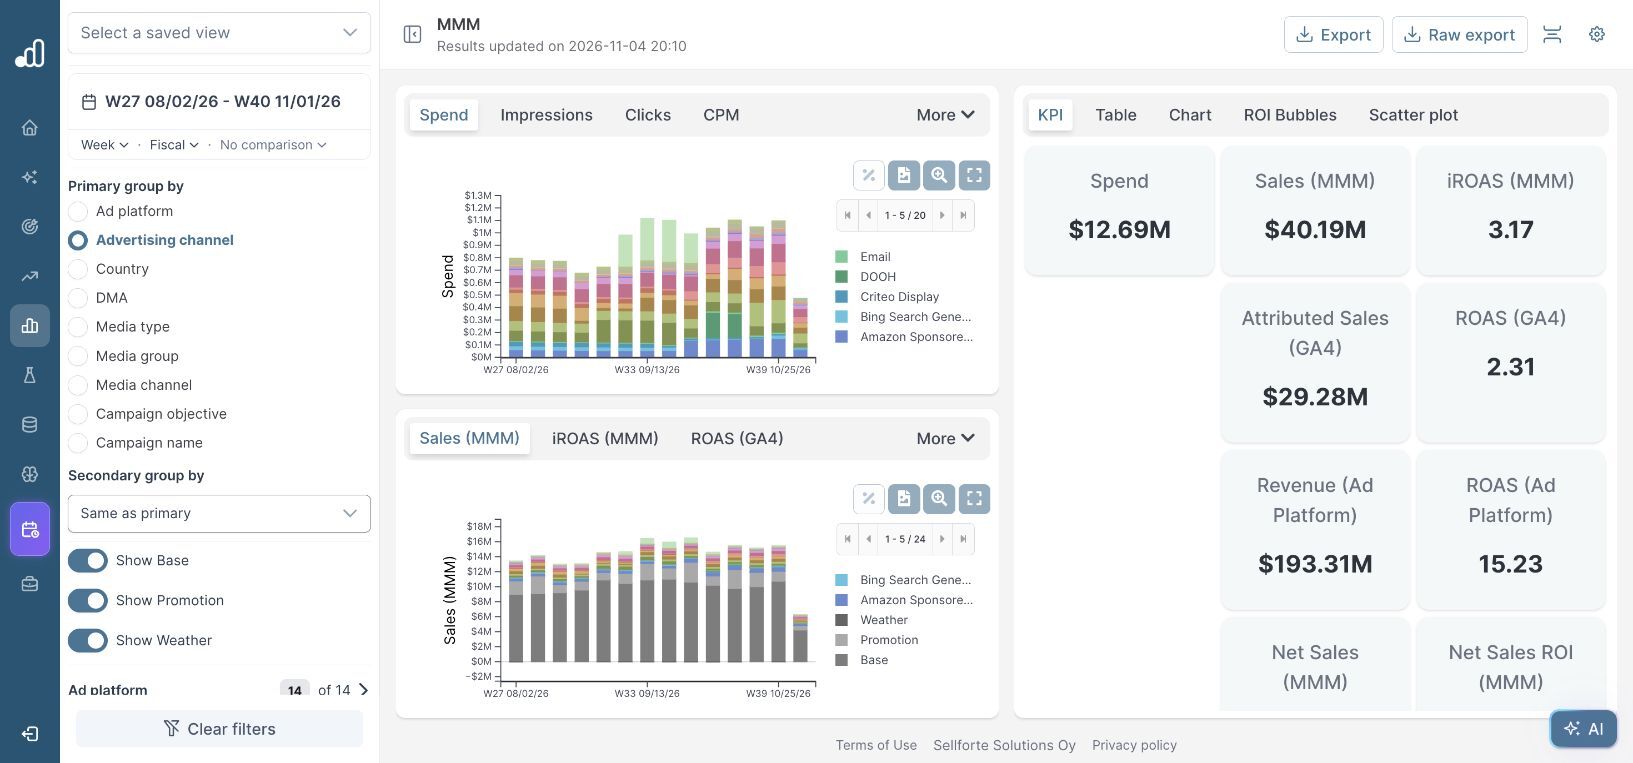
Open Dashboards → MMM. Choose Advertising channel as the primary grouping. Expand its filter, use Deselect all, and select Meta Prospecting. Confirm Country: US.
Open No comparison beneath the date selector and choose Previous period. Check the comparison dates that appear. A preceding period is useful for spotting change, but it may have different demand, promotions and auction conditions. Use a different comparison when that better fits the business question.
2. Describe what changed precisely
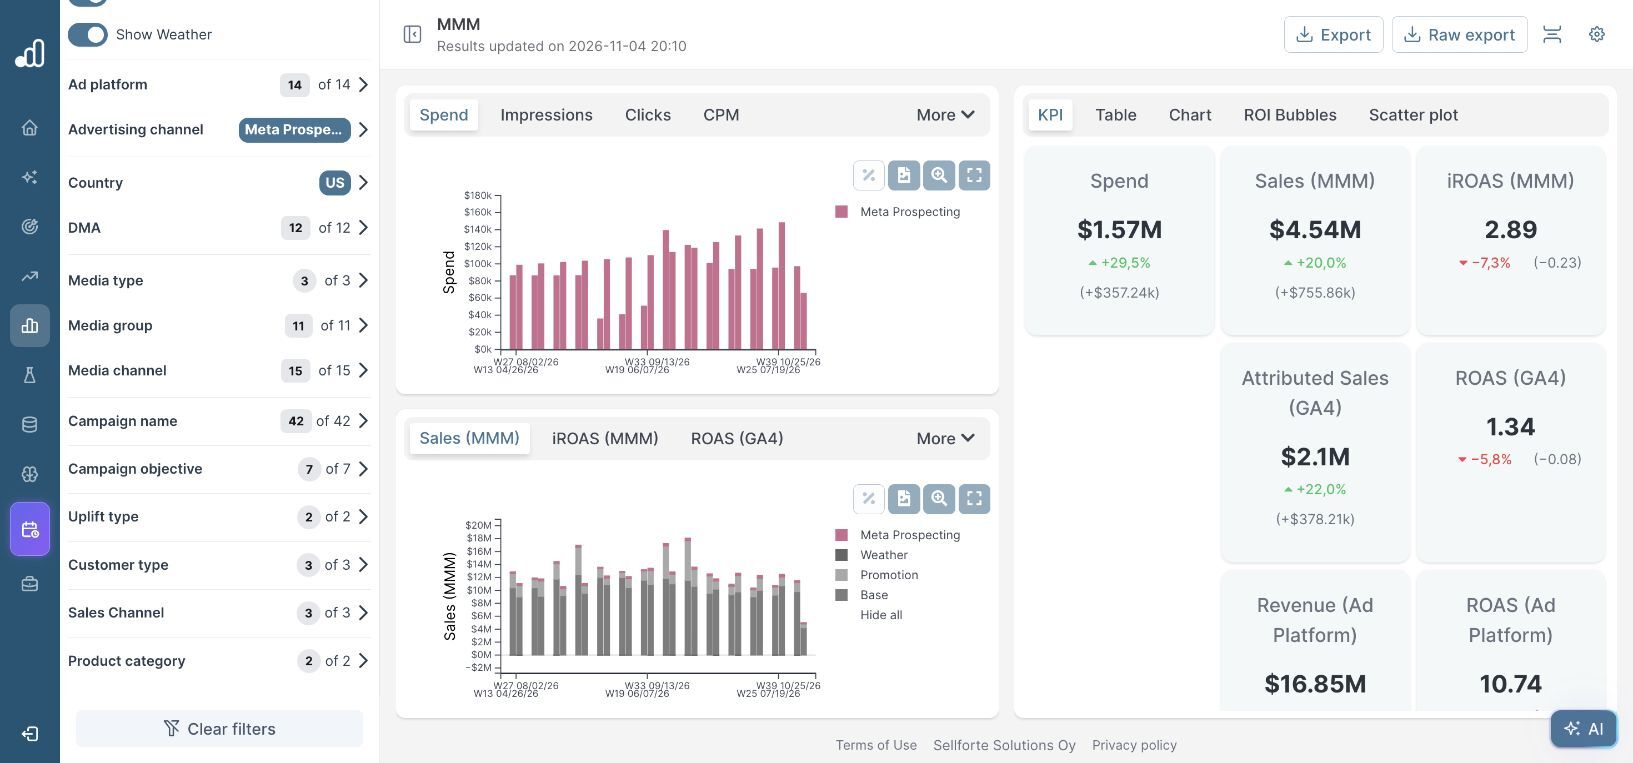
| Metric | Current demo value | Displayed change |
|---|---|---|
| Spend | $1.57M | +29.5% (+$357.24k) |
| Sales (MMM) | $4.54M | +20.0% (+$755.86k) |
| iROAS (MMM) | 2.89 | −7.3% (−0.23) |
Incremental sales increased, while average efficiency declined. Calling this simply a performance decline would miss the additional sales. The immediate question is why sales grew more slowly than spend, and whether the additional investment was worthwhile at the margin.
These are dashboard estimates for two periods, not an experiment on the budget increase. Dividing the between-period sales difference by the spend difference does not isolate the causal return on added spend: other conditions changed too.
3. Inspect CPM and the return trend
In the upper chart, select CPM. In the lower chart, select iROAS (MMM). Keep the channel and comparison filters unchanged. The demo's CPM series is generally higher in the later period, while the return chart shows how efficiency varies within it.
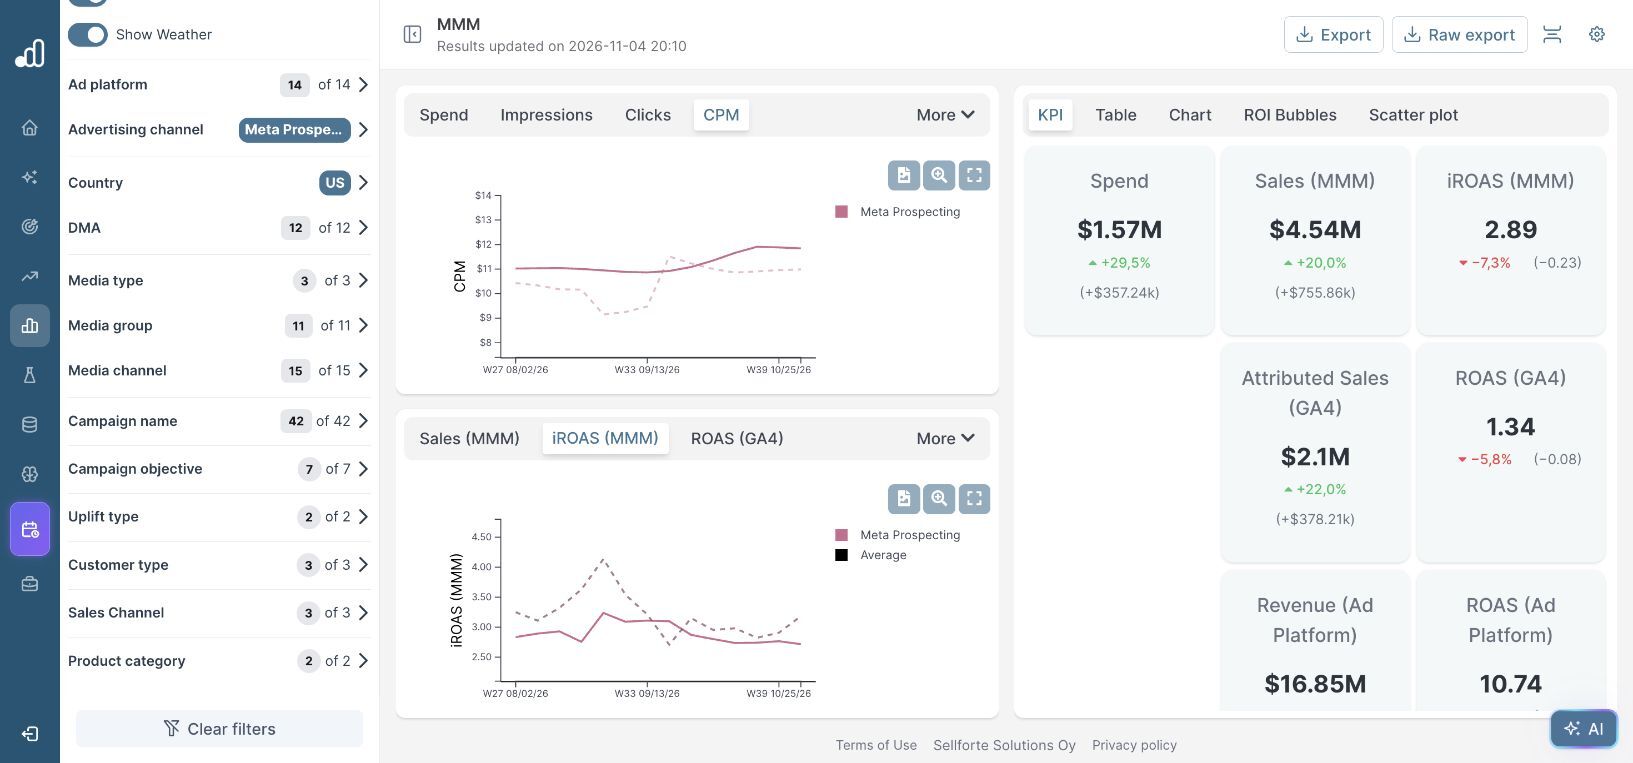
Higher CPM means a given budget buys fewer impressions, all else equal. It is a plausible contributor to the change, but the chart does not prove that auction prices caused the full iROAS decline. Audience composition, placement, creative, demand and modeled carryover may also differ.
4. Check the explanation against the funnel
Use Impressions and Clicks in the upper chart to see whether the spending increase translated into additional delivery and traffic. Use the additional metrics under More where they are available in your account. Compare conversion and order-value changes using consistent definitions.
| Observation | Useful follow-up |
|---|---|
| Spend grows faster than impressions | Check CPM, placement and audience mix. |
| Delivery grows but clicks lag | Review click-through rate, creative and audience response. |
| Traffic holds up but sales weaken | Check conversion, stock availability, site changes and order value. |
| Average iROAS falls as spend rises | Inspect the response curve and marginal return; do not infer saturation from this pattern alone. |
Confirm data completeness and the model update timestamp before escalating a small difference. The demo shows Results updated on 2026-11-04 20:10. The KPI view does not show uncertainty intervals, so percentage changes alone do not establish statistical significance.
5. Write the finding and the next check
US Meta Prospecting spend increased 29.5%, while modeled incremental sales increased 20.0%. Average iROAS fell to 2.89, down 7.3%. Higher CPM is visible in the delivery data and merits investigation. Check the audience and creative mix, then review marginal returns before changing the budget again.
Assign an owner to the follow-up and preserve the filters with the readout. If the proposed action is a budget increase, use the current response curve and miROAS. If the explanation remains uncertain and the decision is material, consider whether a targeted incrementality test would resolve it.
Further Reading and Resources
Investigate the results
Choose the next action
About the author

Lauri Potka is the Chief Operating Officer at Sellforte, with over 15 years of experience in Marketing Mix Modeling, marketing measurement and media spend optimization. Before joining Sellforte, he worked as a management consultant at the Boston Consulting Group, advising some of the world’s largest advertisers on marketing optimization. Follow Lauri on LinkedIn.
How to See Which Channels Drive Incremental Sales
How to Compare MMM Results with Platform ROAS