


Incrementality in marketing is the part of an outcome, such as sales or conversions, that would not have happened without a given marketing activity. It is measured against a counterfactual baseline: the sales a business would have made anyway from seasonality, promotions, organic demand and other media. Incremental revenue divided by spend gives incremental ROAS (iROAS).
This page is a short definition. For an in-depth guide, read What is incrementality in marketing? on the Sellforte blog.
Formula
- Incremental sales = sales with the activity − sales without the activity (the counterfactual)
- Relative lift = incremental sales ÷ sales without the activity
- Incremental ROAS (iROAS) = incremental revenue ÷ media spend
The counterfactual can never be observed directly for the same customers and the same period, so it has to be estimated, either with a randomized control group or with a statistical model. See causal inference.
Example of incrementality in digital marketing
You are Head of Marketing in an eCommerce business and have just wrapped up your Black Friday campaign. Like many eCommerce businesses, you use last-click attribution for cross-channel measurement. The figures below are illustrative.
Branded search. Last-click attribution credits branded search with $800 000 of revenue on $50 000 of spend, a ROAS of 16.
Meta Advantage+. Last-click credits Meta Advantage+ campaigns with $140 000 of revenue on $100 000 of spend, a ROAS of 1.4.
First conclusion: cut Meta Advantage+ and move budget to branded search.
Incrementality view. A marketing mix model (MMM) estimates that only 25% of the branded search revenue credited by last-click was incremental, because most of those shoppers were already looking for the brand. The incremental ROAS is therefore 4.0. For Meta Advantage+, the model estimates incremental revenue four times higher than last-click reports, an incremental ROAS of 5.6.
| Last-Click Attribution ROAS | MMM ROAS | |
| Branded Search | 16.0 | 4.0 |
| Meta Advantage+ | 1.4 | 5.6 |
New conclusion: Meta Advantage+ was more effective than branded search, and budget should shift towards it, not away from it.
💡Pro tip: See Incrementality-based Measurement in Action
Book a demo with Sellforte to compare your current measurement approach to incrementality-based measurement.
Visualizing incrementality
MMMs usually show incrementality as a sales decomposition chart, which splits total sales into the parts driven by each factor. In the example below from the Sellforte platform:
- Base sales (dark gray) are the sales you would get without media or promotions.
- Promotion-driven sales (light gray) are the sales driven by promotions.
- Media-driven sales (colors) are the incremental sales driven by advertising on each platform.

Why attribution and incrementality differ
Platform attribution and last-click attribution credit conversions that follow an ad or a click. They cannot separate conversions that would have happened anyway, conversions caused by the ad, and conversions caused by other media. Field experiments show how large the gap can be. In eBay's paid search experiments, the effectiveness of search advertising for a well-known brand was small, and for non-brand keywords most spend reached frequent buyers whose purchases were not influenced by the ads (Blake, Nosko & Tadelis, 2015). Across 15 large Facebook experiments, common observational methods often failed to recover the effect measured by randomization (Gordon et al., 2019).
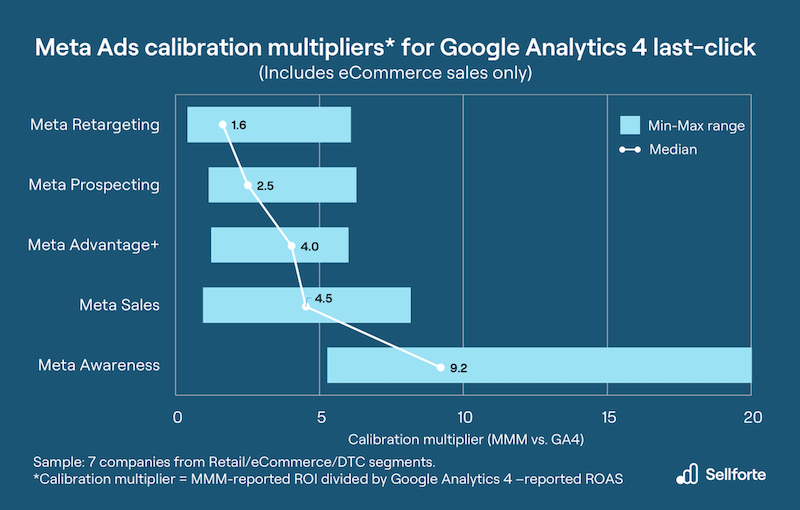
Last-click typically over-credits bottom-of-funnel channels such as branded search and under-credits upper-funnel channels such as paid social. The chart below shows typical multipliers for Meta Ads when moving from Google Analytics 4 last-click to incrementality-based measurement in Sellforte's calibrations:
Why incrementality matters for advertisers
Incremental ROAS shows where the next euro of spend actually adds sales, which is the basis for reallocating budget. A Sellforte study estimated that eCommerce businesses moving from attribution-based to incrementality-based measurement can drive about +6.5% more revenue, from three levers:
- Better allocation across individual campaigns
- Better allocation across channels
- Better budget pacing over time (weekly spend allocation)
In that study, most of the improvement came from campaign-level optimization:

How incrementality is measured
- Incrementality tests: controlled experiments that compare a group exposed to advertising with a randomized holdout group that is not, such as conversion lift tests or geo tests. See What is incrementality testing?
- Marketing mix modeling: statistical time-series models that estimate the relationship between media and sales for all channels continuously.
Experiments are not free of error. Advertising effects are small relative to the natural variation in sales, so even large tests can be imprecise: across 25 field experiments, the median confidence interval on ROI was over 100 percentage points wide (Lewis & Rao, 2015). In practice, tests are therefore used to calibrate the MMM, and the MMM provides continuous incremental ROI for all channels. You can see an example in the no-sign-up Sellforte demo.
Case example: BrandAlley moves to incrementality-based measurement
BrandAlley, a UK-based online fashion retailer, first deployed Sellforte's MMM to measure the incremental sales impact of its channels. It then added experiments, starting with Meta's Conversion Lift test for Meta Ads, and used them to validate the model. Read the full case study.
Key takeaways
- Incrementality is the difference between sales with and without an activity; the "without" part must be estimated.
- Attribution-based ROAS can rank channels in the wrong order; incremental ROAS is the basis for budget decisions.
- Experiments and MMM complement each other: tests anchor the model, the model measures every channel every week.
Related terms
- Causality
- Causal inference
- Return on advertising spend (ROAS)
- Branded search advertising
- Adstock
- Geo lift test
- Holdout group
Further reading on Sellforte
- What is incrementality in marketing? (in-depth guide)
- What is incrementality testing?
- ROAS, iROAS and miROAS
- The 3 danger zones of last-click
References
- Blake, T., Nosko, C., & Tadelis, S. (2015). Consumer heterogeneity and paid search effectiveness: A large-scale field experiment. Econometrica, 83(1), 155–174. https://doi.org/10.3982/ECTA12423
- Gordon, B. R., Zettelmeyer, F., Bhargava, N., & Chapsky, D. (2019). A comparison of approaches to advertising measurement: Evidence from big field experiments at Facebook. Marketing Science, 38(2), 193–225. https://doi.org/10.1287/mksc.2018.1135
- Lewis, R. A., & Rao, J. M. (2015). The unfavorable economics of measuring the returns to advertising. The Quarterly Journal of Economics, 130(4), 1941–1973. https://doi.org/10.1093/qje/qjv023
Authors

Lauri Potka is the Chief Operating Officer at Sellforte, with over 15 years of experience in Marketing Mix Modeling, marketing measurement, and media spend optimization. Before joining Sellforte, he worked as a management consultant at the Boston Consulting Group, advising some of the world’s largest advertisers on data-driven marketing optimization. Follow Lauri in LinkedIn, where he is one of the leading voices in MMM and marketing measurement.


