


Causal inference is the set of methods for estimating cause-and-effect relationships from data: how much an outcome changes when a cause is changed, holding everything else equal. In marketing, it answers which campaigns and channels actually drive sales, rather than merely being associated with them, by comparing observed outcomes with an estimated counterfactual.
For the underlying concept, see What is causality?
The Ladder of Causation
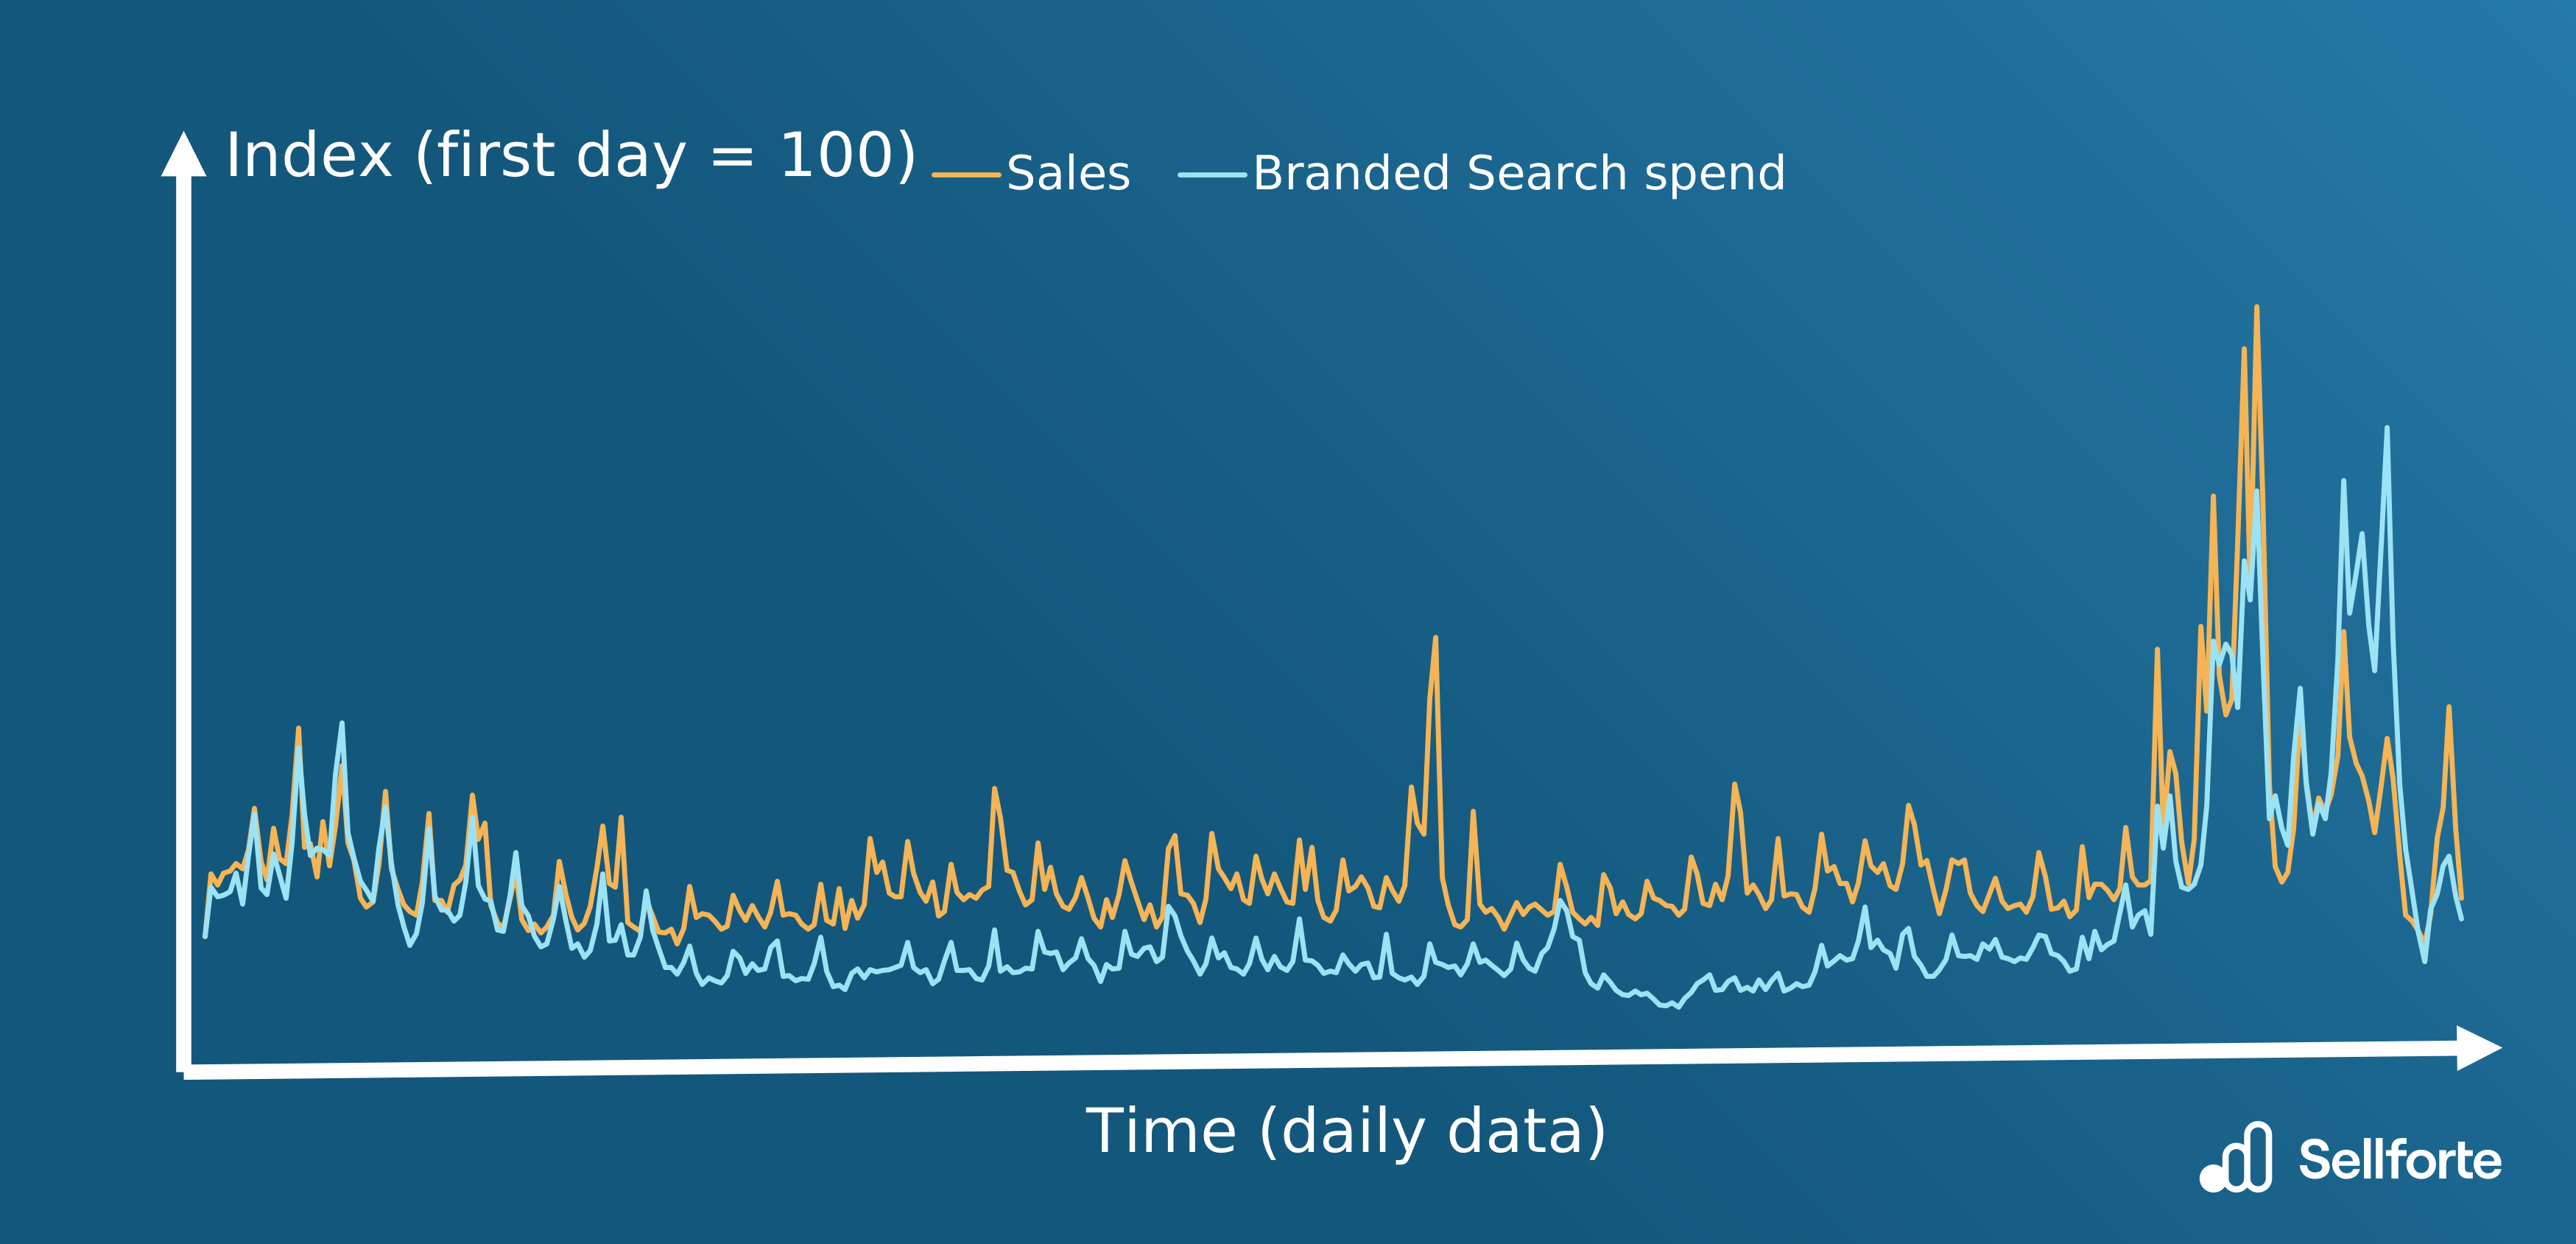
Judea Pearl describes three levels of causal reasoning, the Ladder of Causation: association, intervention and counterfactuals (Pearl & Mackenzie, 2018). Each level answers questions the level below cannot. As an example, take the question of whether branded search advertising has a causal effect on sales. The chart below shows example data on branded search spend and sales.
1. Association (seeing)
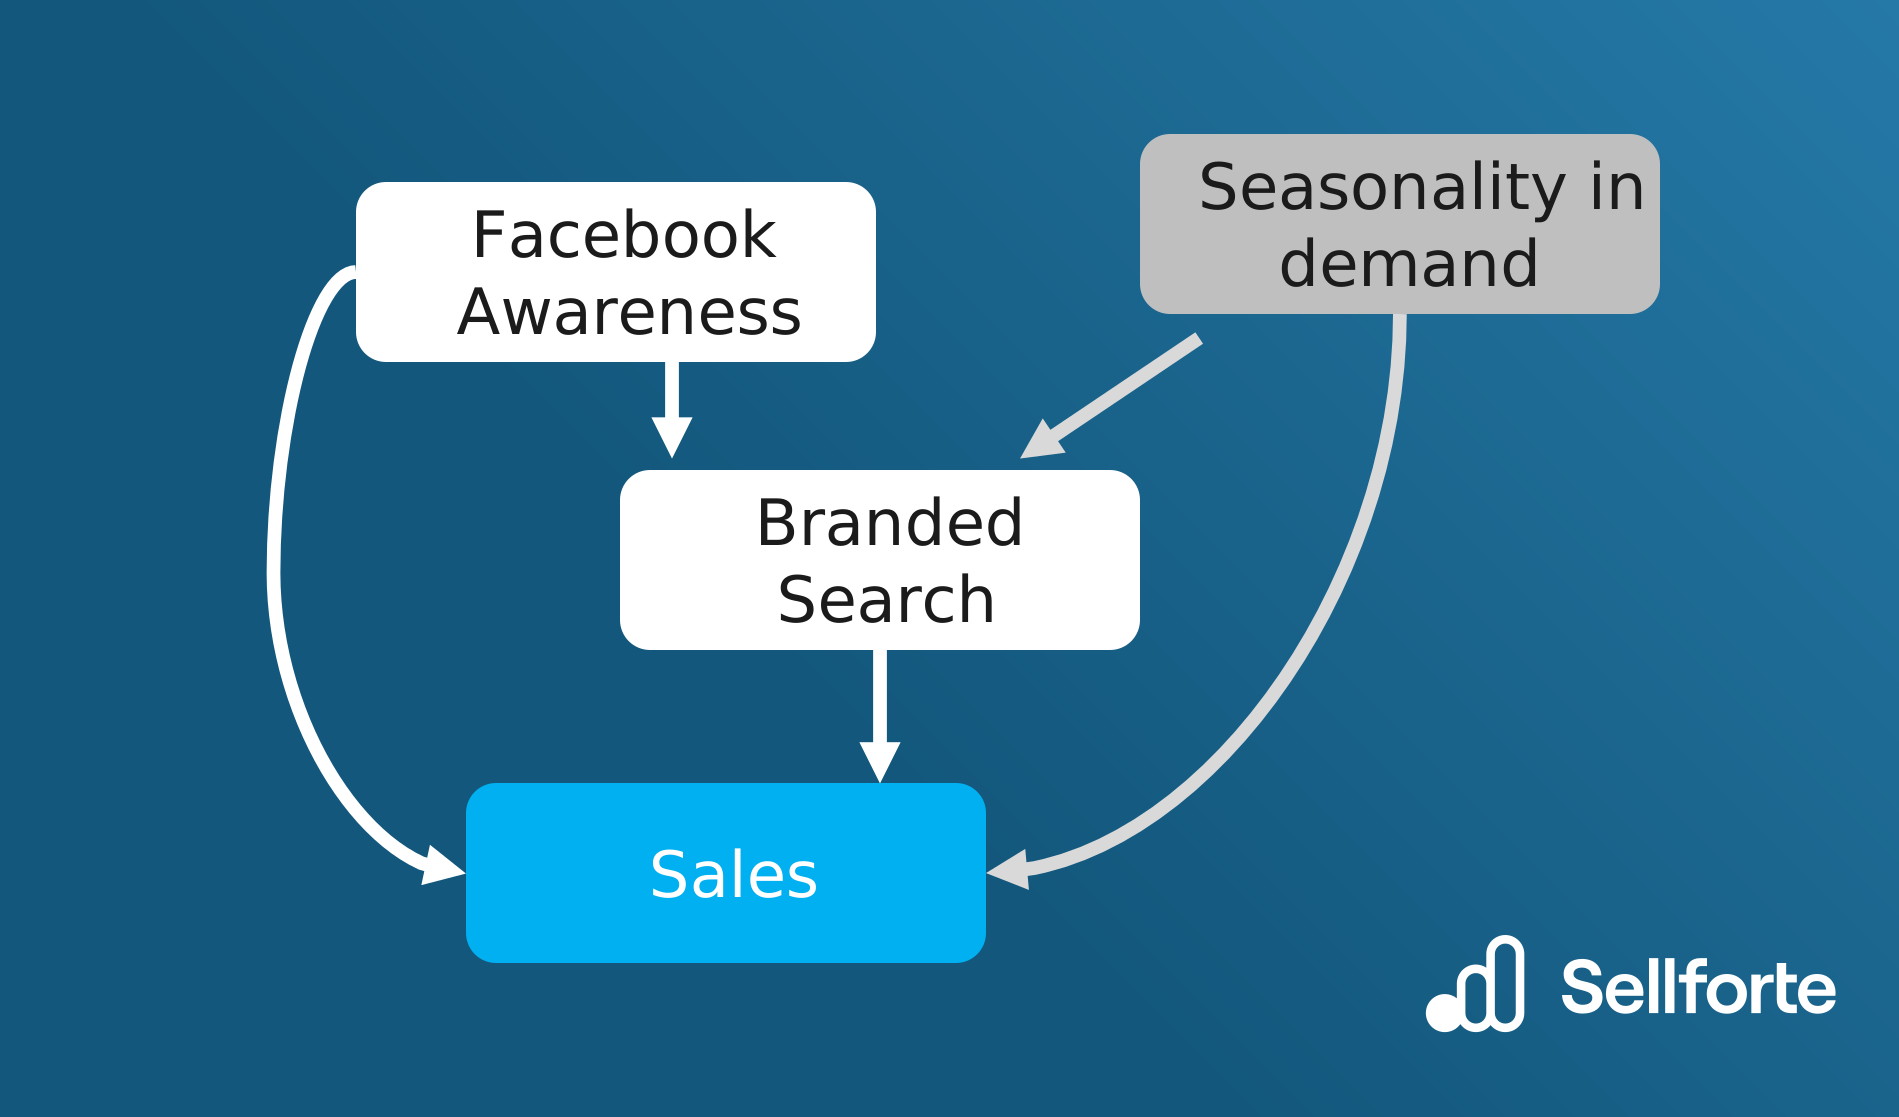
The first level is about observing data: which variables move together. Branded search spend and sales are clearly correlated. Concluding from this alone that branded search drives sales is risky, because confounders such as seasonal demand and awareness media raise both branded searches and sales.
2. Intervention (doing)
The second level asks what happens if we act. A geo experiment can pause branded search ads in randomly selected regions while keeping them on in others. The difference in sales between the two sets of regions estimates the effect of the intervention.
3. Counterfactuals (imagining)
The third level asks what would have happened to the same units if things had been different. For branded search, the counterfactual question is: what would the users who were exposed to or clicked the branded search ad have done if the ad had not been shown? Some would not have bought, but many would have clicked the organic listing or come to the site directly and bought anyway. The incremental effect of the ad is the difference between their observed purchases and these counterfactual purchases. Non-clickers are not the counterfactual; they are a different group of people.
Key concepts
Potential outcomes and counterfactuals
Each unit, such as a customer or a region, has a potential outcome with the treatment and one without it. The causal effect is the difference, but only one outcome is ever observed (Rubin, 1974). Every method below is a way of estimating the missing outcome.
Causal graphs and DAGs
Causal graphs, usually drawn as directed acyclic graphs (DAGs), show assumed causal relationships between variables as arrows. They tell the analyst which variables must be controlled to remove confounding and which must not be controlled, such as mediators and colliders (Pearl, 2009; Hernán & Robins, 2020).
Confounding variables
A confounder influences both the suspected cause and the outcome and creates a correlation between them that is not causal. In marketing, seasonality is the most common confounder: budgets are raised for peak periods when demand is high anyway.
Treatment and control groups
Comparing a group that received the treatment (for example, saw an ad) with a comparable group that did not is the basic design for estimating the counterfactual.
Methods for causal inference in marketing
Randomized controlled trials (RCTs)
Random assignment makes treatment and control groups comparable on average, so the difference in outcomes estimates the causal effect. In marketing, holdout-based conversion lift tests and randomized geo tests are RCTs. A/B tests that compare two ads on an ad platform are a special case, because the delivery algorithm may show each ad to a different audience; see causality for details.
Instrumental variables
An instrument is a variable that shifts the treatment but affects the outcome only through the treatment (Angrist & Pischke, 2009). Variation in media weight caused by inventory availability can serve as an instrument, provided that availability does not itself relate to demand.
Regression discontinuity design
This design uses a cutoff in treatment assignment. For example, the effect of loyalty program benefits can be estimated by comparing customers just above and just below a spending threshold.
Difference-in-differences
Difference-in-differences compares the change in outcomes over time in a treated group with the change in an untreated group. It removes common trends, assuming that the two groups would have followed parallel trends without the treatment (Angrist & Pischke, 2009).
Synthetic control and Bayesian structural time series
The synthetic control method builds the counterfactual for a treated unit as a weighted average of untreated units that matches its pre-treatment history (Abadie, Diamond & Hainmueller, 2010). In marketing, a campaign market can be compared with a weighted combination of non-campaign markets. Bayesian structural time-series models, implemented in Google's CausalImpact package, predict the counterfactual time series from control series and give a probabilistic estimate of the effect (Brodersen et al., 2015). Both are widely used to analyze geo tests.
Causal inference in marketing mix modeling
A marketing mix model is an observational model, so its estimates are causal only if its structure is right: confounders such as seasonality, promotions and prices are included, mediators are handled correctly, and carryover and saturation are modeled. Causal MMMs make these assumptions explicit with DAGs and anchor the estimates with experiments. Results from lift tests and geo tests are used to calibrate the model, and the MMM then provides continuous incremental ROAS (iROAS) for every channel. Attribution models, by contrast, assign credit to touchpoints in a journey and do not estimate a counterfactual.
Challenges
- Selection bias: ad targeting makes exposed and unexposed users systematically different, so naive comparisons overstate effects.
- External validity: an effect measured in one period, market or segment may not hold in another.
- Noise and power: advertising effects are small relative to the variation in sales, so tests and models need large samples or long periods for precise estimates.
Key takeaways
- Every causal estimate compares what happened with an estimated counterfactual for the same units.
- Randomization is the most reliable way to estimate the counterfactual; quasi-experiments and models rely on stated assumptions.
- In MMM, DAGs make the assumptions explicit and experiments calibrate the results.
Related terms
- Causality
- Directed acyclic graph (DAG)
- Incrementality
- Hierarchical Bayesian modeling
- Bayesian statistics
- Geo lift test
Further reading on Sellforte
- What is causal marketing mix modeling?
- What is causal attribution in marketing?
- What is incrementality testing?
References
- Abadie, A., Diamond, A., & Hainmueller, J. (2010). Synthetic control methods for comparative case studies: Estimating the effect of California's tobacco control program. Journal of the American Statistical Association, 105(490), 493–505. https://doi.org/10.1198/jasa.2009.ap08746
- Angrist, J. D., & Pischke, J.-S. (2009). Mostly harmless econometrics: An empiricist's companion. Princeton University Press. https://doi.org/10.1515/9781400829828
- Brodersen, K. H., Gallusser, F., Koehler, J., Remy, N., & Scott, S. L. (2015). Inferring causal impact using Bayesian structural time-series models. The Annals of Applied Statistics, 9(1), 247–274. https://doi.org/10.1214/14-AOAS788
- Hernán, M. A., & Robins, J. M. (2020). Causal inference: What if. Chapman & Hall/CRC. https://miguelhernan.org/whatifbook
- Pearl, J. (2009). Causality: Models, reasoning, and inference (2nd ed.). Cambridge University Press. https://doi.org/10.1017/CBO9780511803161
- Pearl, J., & Mackenzie, D. (2018). The book of why: The new science of cause and effect. Basic Books. http://bayes.cs.ucla.edu/WHY/
- Rubin, D. B. (1974). Estimating causal effects of treatments in randomized and nonrandomized studies. Journal of Educational Psychology, 66(5), 688–701. https://doi.org/10.1037/h0037350
Authors

Dr. Paavo Niskala is a Principal Engineer at Sellforte. With PhD in the field of computational plasma physics, he has over 10 years of experience in designing and building complex data-intensive systems. Paavo has especially focused on using data science in critical business applications, such as Marketing Mix Modeling, which helps businesses make better marketing decisions. Follow Paavo in LinkedIn.


