


Causality is the relationship between a cause and its effect: a change in one variable (the cause) produces a change in another (the effect). In marketing measurement, the causal question is whether an activity actually drives sales or other outcomes, or whether it only moves together with them because both respond to something else.
Causality vs. correlation
Correlation means that two variables move together. Causation means that intervening on one variable would change the other. In the potential-outcomes framework, the causal effect of an ad on a customer is the difference between the outcome with the ad and the outcome without it (Rubin, 1974). Only one of the two outcomes can ever be observed for the same customer at the same time, which Holland (1986) called the fundamental problem of causal inference. Causal effects must therefore be estimated by comparing groups or periods that differ only in the cause.
Branded search illustrates the gap. In the dataset below, branded search spend and sales have a correlation coefficient of 0.62. Branded search can drive sales, but it is unlikely to be as effective as the correlation suggests. It is a demand capture channel: when awareness media such as TV or Meta awareness campaigns raise interest in the brand, more people search for it, and branded search spend rises with them unless it is capped. Part of the correlation is therefore caused by other media and by underlying demand, not by the search ads themselves.

Methods for establishing causality
The process of estimating cause-and-effect relationships from data is called causal inference. Methods differ in how strong the evidence they provide is.
Randomized controlled trials (RCTs)
Subjects are randomly assigned to treatment and control groups, so the groups differ only by chance and by the treatment. RCTs give the most credible estimates and are standard in clinical drug trials. In advertising, holdout tests are RCTs.
Natural experiments and quasi-experimental methods
When randomization is not possible, analysts use variation that is as good as random, for example regions where a campaign did not run because of a budget or inventory constraint. Difference-in-differences, regression discontinuity and instrumental variables are the main quasi-experimental designs; Varian (2016) reviews them in a marketing context.
Model-based causal inference
Structural causal models and causal graphs make explicit which variables cause which, and determine which variables must be controlled to identify an effect from observational data (Pearl, 2009). Synthetic control methods and propensity score matching belong to the same family.
Why causality matters in marketing measurement
Budget allocation is a causal question: what happens to sales if spend changes? Measurement that is not causal can credit channels that only capture demand created elsewhere, keep funding activities that do not drive results, and miss channels that do.
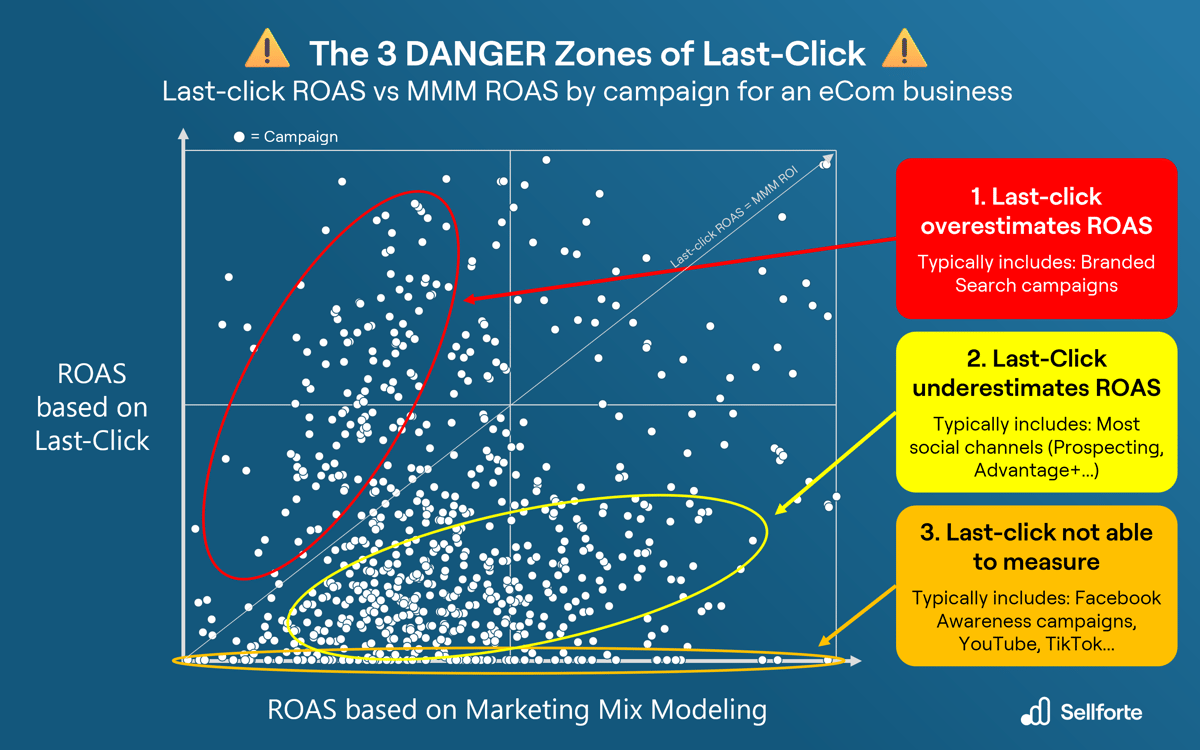
Last-click attribution is a widely used approach that is not based on causal principles. It credits the last clicked ad before a conversion and ignores earlier advertising and the sales that would have happened anyway. A Sellforte study of last-click attribution found that last-click ROAS by campaign was not correlated with the incremental ROI estimated by Sellforte's marketing mix model (MMM). The chart below compares the two methods and highlights where they differ most.
Challenges in establishing causality in marketing
- Confounding: seasonality, competitor actions and the economy influence both marketing spend and sales.
- Selection bias: ad platforms target people who are already likely to buy, so exposed and unexposed customers differ even without the ad.
- Time lags: effects build up and decay over weeks (see adstock), which blurs the link between exposure and purchase.
- Diminishing returns: effectiveness falls as spend in a channel grows and the channel saturates.
- Low signal-to-noise ratio: sales vary a lot for reasons unrelated to advertising, and the effect of a single campaign is small by comparison, especially in weekly data.
Causal marketing measurement in practice
1. Ad platforms' conversion lift tests
Conversion lift tests estimate the incrementality of advertising on one platform by holding out a randomized control group of users from the ads:
- Meta Conversion Lift randomly assigns users to test and control groups and withholds the ads from the control group.
- Google Conversion Lift compares conversions in treatment and control groups, based on users or on geography, and reports incremental conversions and relative lift (Google, n.d.-a).
- TikTok Conversion Lift Study splits the audience into a test group that sees the ads and a control group that does not.
Google Ads campaign experiments are a different tool. A custom experiment splits traffic or budget between a base campaign and a modified trial campaign (Google, n.d.-b). It compares two versions of a campaign, not advertising against no advertising, so it does not measure the campaign's total incrementality.
A/B tests of two ads vs. holdout lift tests. When a platform A/B test compares two ads, such as two creatives, the delivery algorithm can show each ad to a different mix of users. This "divergent delivery" confounds the effect of the ad with the effect of the audience, so the test cannot tell which ad would work better on the same people (Braun & Schwartz, 2025). The critique applies to comparisons between ads. A holdout-based conversion lift test randomizes users into test and control groups before delivery and compares the two whole groups, or the exposed users with their control-group counterparts, so the comparison remains a valid randomized experiment (Johnson, Lewis & Nubbemeyer, 2017; Gordon et al., 2019).
Lift tests have real limits of their own:
- Snapshot: a test measures one platform, one period and one level of spend. It does not give continuous measurement or response curves.
- Platform-run: the test is designed, run and reported by the platform that sells the media, using the platform's own conversion tracking.
- Power and noise: advertising effects are small relative to the variation in sales. Across 25 large field experiments, the median confidence interval on ROI was over 100 percentage points wide (Lewis & Rao, 2015).
Used and interpreted with these limits in mind, lift tests are valuable for validating and calibrating marketing mix models. Case study: Validating a marketing mix model with Meta Conversion Lift studies.
2. Geo testing (geographic experiments)
Geo tests assign comparable geographic areas, for example U.S. states or Designated Market Areas (DMAs), to test and control conditions. The treatment, such as turning a channel on or off, is applied in the test areas, and sales are compared with the control areas. Geo tests work for channels that cannot be randomized at user level, such as TV or out-of-home, and use first-party sales data rather than platform tracking.
Geo tests are less standardized to analyze than platform lift tests. Common approaches estimate a counterfactual for the test areas from the control areas, for example with synthetic control or Bayesian structural time-series models. Sellforte's geo tests support this analysis. Like lift tests, geo tests are a snapshot, and their results are most useful as calibration input for an MMM.
3. Causal marketing mix models (MMM)
Causal marketing mix models apply causal inference principles to continuous measurement of all channels. They combine Bayesian modeling, calibration with experiments, and causal graphs that define which variables are confounders and which are mediators. Directed acyclic graphs (DAGs) make these assumptions explicit.
Key takeaways
- A correlation coefficient says how strongly two variables move together, not how much one causes the other.
- Randomized holdout tests give the most credible estimates, but each is a noisy snapshot of one platform and period.
- Causal MMM calibrated with experiments turns those snapshots into continuous incremental measurement for all channels.
Related terms
- Causal inference
- Directed acyclic graph (DAG)
- Incrementality
- Branded search advertising
- Bayesian statistics
Further reading on Sellforte
- What is causal marketing mix modeling?
- What is incrementality testing?
- Can you trust Meta conversion lift tests?
- Calibrating marketing mix models with experiments and attribution data
References
- Braun, M., & Schwartz, E. M. (2025). Where A/B testing goes wrong: How divergent delivery affects what online experiments cannot (and can) tell you about how customers respond to advertising. Journal of Marketing, 89(2), 71–95. Preprint: https://papers.ssrn.com/abstract=3896024
- Google. (n.d.-a). About Conversion Lift. Google Ads Help. Retrieved 2026-10-30, from https://support.google.com/google-ads/answer/12003020
- Google. (n.d.-b). Set up a custom experiment. Google Ads Help. Retrieved 2026-10-30, from https://support.google.com/google-ads/answer/6261395
- Gordon, B. R., Zettelmeyer, F., Bhargava, N., & Chapsky, D. (2019). A comparison of approaches to advertising measurement: Evidence from big field experiments at Facebook. Marketing Science, 38(2), 193–225. https://doi.org/10.1287/mksc.2018.1135
- Holland, P. W. (1986). Statistics and causal inference. Journal of the American Statistical Association, 81(396), 945–960. https://www.jstor.org/stable/2289064
- Johnson, G. A., Lewis, R. A., & Nubbemeyer, E. I. (2017). Ghost ads: Improving the economics of measuring online ad effectiveness. Journal of Marketing Research, 54(6), 867–884. https://doi.org/10.1509/jmr.15.0297
- Lewis, R. A., & Rao, J. M. (2015). The unfavorable economics of measuring the returns to advertising. The Quarterly Journal of Economics, 130(4), 1941–1973. https://doi.org/10.1093/qje/qjv023
- Pearl, J. (2009). Causality: Models, reasoning, and inference (2nd ed.). Cambridge University Press. https://doi.org/10.1017/CBO9780511803161
- Rubin, D. B. (1974). Estimating causal effects of treatments in randomized and nonrandomized studies. Journal of Educational Psychology, 66(5), 688–701. https://doi.org/10.1037/h0037350
- Varian, H. R. (2016). Causal inference in economics and marketing. Proceedings of the National Academy of Sciences, 113(27), 7310–7315. https://doi.org/10.1073/pnas.1510479113
Authors

Lauri Potka is the Chief Operating Officer at Sellforte, with over 15 years of experience in Marketing Mix Modeling, marketing measurement, and media spend optimization. Before joining Sellforte, he worked as a management consultant at the Boston Consulting Group, advising some of the world’s largest advertisers on data-driven marketing optimization. Follow Lauri in LinkedIn, where he is one of the leading voices in MMM and marketing measurement.


