


A geo lift test is a marketing experiment that measures the incremental effect of advertising by changing media in some geographic regions (the test group) and not in others (the control group). Comparing sales in the two groups against what would otherwise be expected gives the incremental lift and the incremental ROAS of the activity.
How a geo lift test works
In a geo experiment, non-overlapping geographic regions are assigned to a test or control condition, and each region receives its condition through geo-targeted advertising (Vaver & Koehler, 2011). Because the experimental unit is a region rather than a user, geo tests do not need user-level tracking or cookies. They can measure any sales outcome that can be split by region, including offline store sales, and they work for media that cannot target individuals, such as TV, radio and out-of-home.
A typical geo lift test has four phases:
- Pre-period. Historical sales by region are used to choose the regions and to check how well the control group tracks the test group.
- Test period. Media is changed in the test regions. Common designs are a holdout (a channel is switched off in the test regions) and a heavy-up (spend is increased in the test regions).
- Cool-down period. Measurement continues for a while after the change ends, so that delayed effects such as adstock are captured.
- Analysis. The counterfactual, meaning the sales the test regions would have had without the change, is estimated from the control regions, and the lift is the difference between actual and counterfactual sales.
Incremental ROAS (iROAS) = Incremental revenue in test regions / Change in media spend in test regions
Choosing test and control regions
The unit of randomization depends on the market. In the US, Designated Market Areas (DMAs) or states are common. In Europe, brands typically use postal code areas, NUTS regions or cities. Google's geo-based Conversion Lift uses sub-country regions as experimental units (Google, n.d.).
There are two broad ways to form the groups:
- Randomized assignment. Regions are randomly assigned to test and control. With many regions, randomization balances unobserved differences. Pairing similar regions before randomizing improves precision.
- Matched markets. With few regions, pure randomization can produce unbalanced groups by chance. Analysts then select test and control regions so that their pre-period sales move together. Matching improves comparability, but it relies on the pre-period relationship continuing during the test.
Analysis methods
Geo tests lack the standardized output of platform conversion lift studies, and the choice of analysis method affects the result. The three most common methods are:
| Method | How the counterfactual is built | Main assumption |
| Difference-in-differences | Change in test regions minus change in control regions, from pre-period to test period | Parallel trends: without the test, both groups would have changed by the same amount |
| Synthetic control | A weighted combination of control regions that reproduces the test regions' pre-period sales | The pre-period weights remain valid during the test |
| Bayesian structural time series | A time-series model of test-region sales with control regions as covariates, projected over the test period | The relationship with the covariates is stable and they are not affected by the test |
Synthetic control was introduced for comparative case studies with a small number of treated units: instead of picking one comparison region, it builds a weighted combination of untreated units that matches the treated unit before the intervention (Abadie, Diamond & Hainmueller, 2010). This suits geo tests well, because marketers usually test in a few regions.
Bayesian structural time series (BSTS) generalizes difference-in-differences to the time-series setting by explicitly modeling the counterfactual, and it returns a full posterior distribution of the effect (Brodersen et al., 2015). The method is implemented in the open-source CausalImpact R package.
In practice, running more than one method is a useful robustness check. If difference-in-differences and synthetic control give very different answers, the parallel trends or matching assumptions probably do not hold. The Sellforte post Why can two analyses of the same holdout test produce different lift? discusses this in more detail.
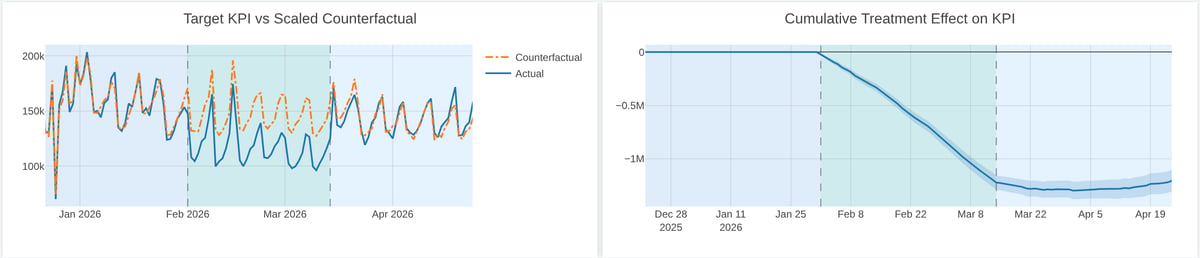
The example below is a GeoLift readout from the Sellforte demo (demo data). Advertising on Meta and Google was paused in one test market for six weeks. The left chart compares actual sales in the test market with a synthetic-control counterfactual built from untreated markets; the right chart shows the cumulative incremental effect with its uncertainty band. The summary tiles translate the effect into incremental sales and iROAS with a 90% credible interval.

Power and minimum detectable effect
A geo test should be designed so that it can detect the effect you expect. The minimum detectable effect (MDE) is the smallest lift the test can reliably distinguish from noise at the chosen significance level and power. If the expected lift is below the MDE, a "no significant effect" result tells you little.
The MDE of a geo test depends on:
- Noise in regional sales. The more sales fluctuate week to week, and the less closely control regions track the test regions in the pre-period, the larger the MDE.
- Size of the media change. A full holdout of a large channel produces a larger and easier-to-detect effect than a small heavy-up.
- Share of sales in test regions. Larger test regions increase the signal, but they also make the test more expensive and leave fewer regions for the control.
- Test duration. Longer tests average out noise but are more exposed to external events and require holding the media plan fixed for longer.
Power is best estimated before launch by simulation on historical data: apply a placebo "test" to past periods with no real change, measure how much the estimated effect varies, and derive the MDE from that variation. Advertising effects are often small compared with normal sales volatility, which makes them hard to detect even in large experiments (Lewis & Rao, 2015). The post When is a market or channel too small to justify an incrementality test? covers the practical thresholds.
Common pitfalls
- Spillover. People live, work and shop across region borders, national media reach all regions, and online orders may be shipped to a different region from where the ad was seen. Spillover into control regions shrinks the measured lift. Using larger regions, buffer zones between test and control, and ship-to rather than IP location for sales reduces the problem.
- Too few regions. With a handful of regions, one local event such as a store opening, a regional promotion, weather or a competitor campaign can dominate the result. Synthetic control and BSTS help, but they cannot fully compensate for a small sample.
- Imprecise geo-targeting. Ad platforms infer location from signals such as IP address, so some impressions leak into control regions. Check delivery reports by region during the test.
- Changes in other channels. If other media or promotions change differently in test and control regions during the test, the measured lift is no longer the effect of the tested channel alone.
- Short tests and carryover. Ending the measurement when the media change ends misses delayed effects and underestimates the lift of channels with long carryover.
Calibrating MMM with geo tests
A geo test gives a snapshot of one channel's incrementality, in specific regions and a specific period. It does not provide continuous measurement or response curves. A marketing mix model provides both, but its estimates for correlated channels can be uncertain. Combining the two addresses the weaknesses of each: the geo test result is used as prior information or a calibration target for the corresponding channel in the MMM, and the MMM extends the result to other periods, spend levels and channels.
When calibrating, account for differences between the test and the model: the test measures the effect at the tested spend level and period, while the MMM estimates average or marginal effects over time. Read more in MMM calibration explained and How should geo-lift and conversion-lift studies be combined when calibrating MMM?. Sellforte's Geolift module helps analyze geo tests.
Key takeaways
- A geo lift test compares test and control regions to estimate incremental sales and iROAS without user-level tracking, including offline sales and media that cannot target individuals.
- Difference-in-differences, synthetic control and Bayesian structural time series build the counterfactual in different ways. Comparing them is a useful robustness check.
- Estimate power and MDE before launch, plan for spillover, and use the result to calibrate MMM rather than as a stand-alone answer.
Related terms
Further reading on Sellforte
- What is incrementality testing? A practical guide
- MMM calibration explained: What it is, why it matters, and how to do it
- Calibrating marketing mix models with experiments and attribution data
References
- Abadie, A., Diamond, A., & Hainmueller, J. (2010). Synthetic control methods for comparative case studies: Estimating the effect of California's tobacco control program. Journal of the American Statistical Association, 105(490), 493–505. https://doi.org/10.1198/jasa.2009.ap08746
- Brodersen, K. H., Gallusser, F., Koehler, J., Remy, N., & Scott, S. L. (2015). Inferring causal impact using Bayesian structural time-series models. The Annals of Applied Statistics, 9(1), 247–274. https://doi.org/10.1214/14-AOAS788
- Google. (n.d.). About Conversion Lift. Google Ads Help. Retrieved 2026-10-30, from https://support.google.com/google-ads/answer/12003020
- Lewis, R. A., & Rao, J. M. (2015). The unfavorable economics of measuring the returns to advertising. The Quarterly Journal of Economics, 130(4), 1941–1973. https://doi.org/10.1093/qje/qjv023
- Vaver, J., & Koehler, J. (2011). Measuring ad effectiveness using geo experiments. Google Inc. https://research.google/pubs/measuring-ad-effectiveness-using-geo-experiments/
Authors

Dr. Paavo Niskala is a Principal Engineer at Sellforte. With PhD in the field of computational plasma physics, he has over 10 years of experience in designing and building complex data-intensive systems. Paavo has especially focused on using data science in critical business applications, such as Marketing Mix Modeling, which helps businesses make better marketing decisions. Follow Paavo in LinkedIn.


