MMM Use Case

A channel average can hide a weaker campaign receiving most of the budget. To find it, compare each campaign’s incremental sales with its spend, then calculate how much of the channel total it represents.
This walkthrough uses Meta Advantage+ in Sellforte’s public Performance Insights demo. It shows how to identify the campaign lowering the average and decide whether it deserves a budget review.
Before you start: Choose one advertising channel, a market and a period long enough to evaluate its campaigns.
What you will produce: A campaign-level explanation of the channel’s return and a prioritized review of its budget allocation.
1. Isolate one channel
Open Performance → Insights. Select US and October 19–November 15, 2026, keeping all 12 DMAs selected. Open the Advertising channel filter, deselect the other channels and select Meta Advantage+.
Choose the Campaign tab. Keep Spend, Sales (MMM), iROAS (MMM) and miROAS visible. Platform ROAS can remain alongside them, but use the MMM columns for this comparison of incremental return.
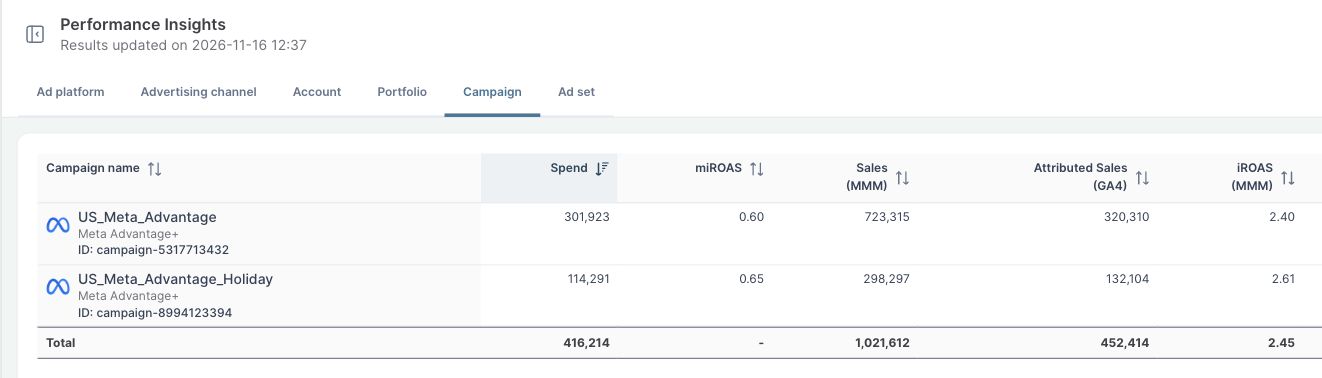
The two campaigns spent $416,214 and generated $1,021,612 in modeled incremental sales. Their combined iROAS is 2.45, calculated as total incremental sales divided by total spend.
2. Compare each campaign with the channel average
| Campaign | Spend | Incremental sales | iROAS | miROAS |
|---|---|---|---|---|
| US_Meta_Advantage | $301,923 | $723,315 | 2.40 | 0.60 |
| US_Meta_Advantage_Holiday | $114,291 | $298,297 | 2.61 | 0.65 |
| Channel total | $416,214 | $1,021,612 | 2.45 | — |
US_Meta_Advantage has the lower historical return, at 2.40. The Holiday campaign returns 2.61. Because the first campaign receives more spend, it has a larger influence on the channel average.
Use the total sales and spend to calculate the channel figure. A simple average of 2.40 and 2.61 would give the two campaigns equal weight even though their budgets differ substantially.
3. Calculate spend share and incremental-sales share
Spend share = campaign spend ÷ channel spend.
Incremental-sales share = campaign incremental sales ÷ channel incremental sales.
| Campaign | Share of spend | Share of incremental sales |
|---|---|---|
| US_Meta_Advantage | 72.5% | 70.8% |
| US_Meta_Advantage_Holiday | 27.5% | 29.2% |
The main campaign uses 72.5% of the budget but produces 70.8% of incremental sales. That makes it the first place to investigate the channel’s lower return. The difference is modest: the example does not reveal a dramatically failing campaign.
This share comparison helps prioritize larger accounts, too. A campaign with a low iROAS and a large share of spend matters more to the channel total than a tiny campaign with the same iROAS. Compare campaigns serving the same business objective before treating the ranking as a budget recommendation.
4. Check the ad sets and the next-dollar opportunity
Switch to Ad set while retaining the channel filter. In this demo, each campaign contains an ad set named Broad_Adv+_Purchase. The parent campaign shown below the name distinguishes them; their IDs also differ. The totals match their respective campaigns, so there is no further allocation difference hidden within these two campaigns in this view.
Before moving money, examine marginal incremental ROAS (miROAS) and the available campaign and ad-set recommendations. Here, miROAS is 0.60 for the main campaign and 0.65 for Holiday. The campaign with the higher historical average is therefore not automatically an attractive destination for additional spend.
Use this analysis to select the campaign for a closer review of audience, creative, bid settings and recent changes. If a recommendation supports reducing its spend, compare the expected incremental-sales loss with the gain available elsewhere. Make the allocation decision on that forward-looking trade-off.
Further Reading and Resources
Understand the results
About the author

Lauri Potka is the Chief Operating Officer at Sellforte, with over 15 years of experience in Marketing Mix Modeling, marketing measurement and media spend optimization. Before joining Sellforte, he worked as a management consultant at the Boston Consulting Group, advising some of the world’s largest advertisers on marketing optimization. Follow Lauri on LinkedIn.
How to See Which Channels Drive Incremental Sales
How to Understand Why a Channel’s Performance Changed