MMM Use Case

To assess whether a target ROAS change paid off, open Performance → Change Intelligence and compare actual spend and incremental sales with the estimated outcome if the setting had stayed unchanged. Divide the additional incremental sales by the additional spend, then compare that return with your business’s requirement.
This worked example follows US_Shopping_All in the public Sellforte demo. The simulated campaign lowered target ROAS from 5.95 to 4.90 on October 11, 2026. The analysis covers October 11–25.
Before you start: A detected target ROAS change with enough subsequent data to evaluate, and a required incremental return for your business.
What you will produce: A decision to keep, reverse or continue observing the change, based on the return on the spend it added or removed.
1. Open the change you want to evaluate
In Change Intelligence, filter Campaign name to US_Shopping_All and choose a date range containing October 11. Open the row for the decrease from 5.95 to 4.90. You can also reach this analysis through the latest change link on the campaign’s recommendation card.
Confirm the campaign, applied date and direction of the change. Lowering target ROAS allows the platform to pursue more volume at a lower attributed return requirement. Here, the change intention is labeled Scaling.
2. Compare actual results with the counterfactual
The Metrics Comparison table uses totals for the post-change window. Counterfactual means the estimated outcome over those same dates if target ROAS had remained at 5.95.
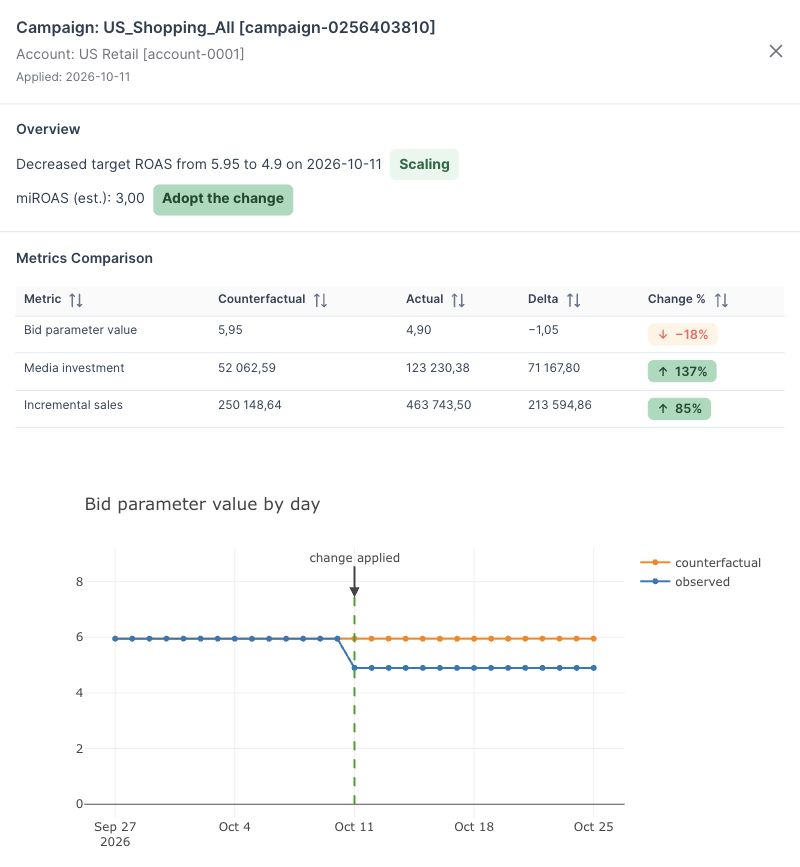
| Metric | Counterfactual | Actual | Change |
|---|---|---|---|
| Target ROAS setting | 5.95 | 4.90 | −1.05 |
| Media investment | $52,062.59 | $123,230.38 | +$71,167.80 |
| Incremental sales | $250,148.64 | $463,743.50 | +$213,594.86 |
The change added about $71,168 in spending and $213,595 in incremental sales relative to the counterfactual. Those are the amounts to use when judging the adjustment. The actual campaign totals include activity that would have happened even without the change.
3. Calculate the return on the added spend
For this change, miROAS = $213,594.86 ÷ $71,167.80 ≈ 3.00. Each additional dollar spent generated an estimated $3.00 in additional incremental sales.
The campaign’s actual average iROAS is approximately $463,743.50 ÷ $123,230.38 = 3.76. That average describes all the campaign’s spend during the period. The 3.00 miROAS answers the narrower question: how efficiently did the extra spending caused by the target change perform?
The guide to marginal incremental ROAS explains how to use this distinction in budget decisions. For an illustrative required miROAS of 2.5, the observed 3.00 clears the requirement. If your requirement were 3.5, the same result would fall short. These two thresholds are example business inputs, separate from the demo’s configured recommendation.
4. Check how the comparison accounts for changing demand
Read Analysis Methodology below the charts. For target ROAS changes, Sellforte uses available impressions, or available clicks when impressions are unavailable, to shape counterfactual spending. Other changes can use the baseline-plus-promotions index; the methodology describes the fallback when no demand pattern is available.
Counterfactual incremental sales use that spending pattern and the campaign’s pre-change incremental return. Inspect the daily charts to see whether the observed spending and sales response persists through the evaluation window. A seasonal rise in demand can lift the counterfactual too, so a simple comparison with the previous period can give a different impression of the change.
5. Decide whether to keep the new setting
The demo recommends Adopt the change. For a business with the illustrative 2.5 return requirement, keeping the move to 4.90 is consistent with the measured 3.00 miROAS. It bought additional sales at a return above that requirement.
If the result is close to your threshold or the observation window is still short, continue observing before making another large adjustment. For a spending reduction, assess the return on the spend removed: cutting spend that was below your required return can be worthwhile even when sales decrease.
A successful move to 4.90 does not establish the return at every lower target. Review the current campaign recommendation before the next change and evaluate that adjustment in its own post-change window.
Further Reading and Resources
Understand the measurement
Choose the next adjustment
About the author

Lauri Potka is the Chief Operating Officer at Sellforte, with over 15 years of experience in Marketing Mix Modeling, marketing measurement and media spend optimization. Before joining Sellforte, he worked as a management consultant at the Boston Consulting Group, advising some of the world’s largest advertisers on marketing optimization. Follow Lauri on LinkedIn.
How to Understand Why a Channel’s Performance Changed
How to Compare Media Performance Across Regions