MMM Use Case

A deeper discount can sell more and still contribute less margin. Before repeating a promotion, compare the incremental margin generated at each discount depth with the value of discounts granted.
This guide uses the public Sellforte demo to compare 15%, 30% and deeper discounts. The example shows why the promotion with the highest sales return is not always the strongest choice for margin.
Before you start: Open Promotions with promotion investment and modeled sales and margin available. Choose a market and a completed period.
What you will produce: A shortlist of discount depths to retain, reduce or test, based on incremental margin and the return on discounts.
1. Group promotion results by discount depth
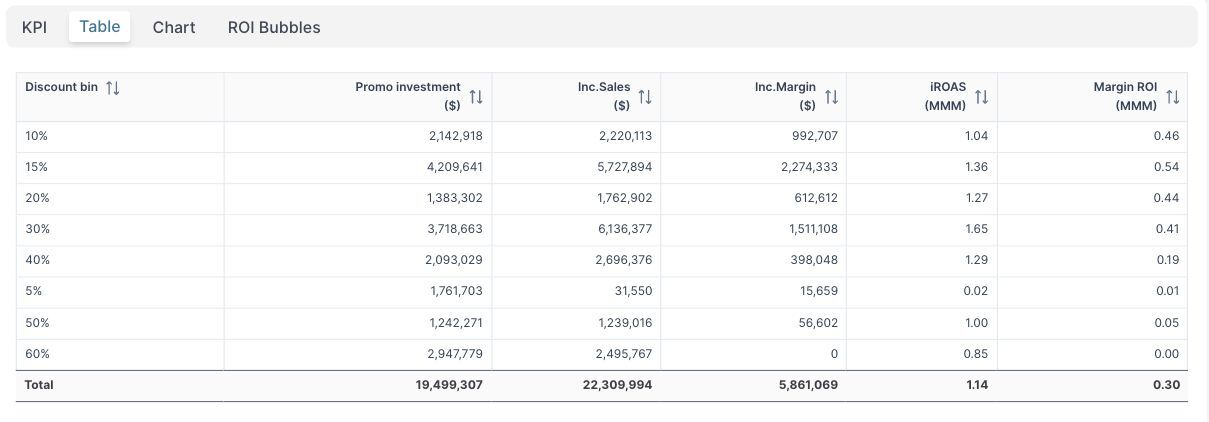
Open Promotions and set Primary group by to Discount bin. Select the Table view and turn on Total over time so each row covers the full period.
For this example, select US and August–October 2026. In the calendar selector, Last 3 months with Exclude incomplete periods enabled gives these three completed months. Keep all promotion types, customer segments and sales channels selected, with Product category set to Overall.
The table separates promotion investment, incremental sales, incremental margin, sales iROAS and Margin ROI. Promotion investment represents the granted discounts used in this analysis. Sellforte’s Promotions Dashboard guide explains how promotion impact is measured within the MMM.
2. Compare sales and margin together
| Discount depth | Promo investment | Incremental sales | Incremental margin | Margin ROI |
|---|---|---|---|---|
| 15% | $4,209,641 | $5,727,894 | $2,274,333 | 0.54 |
| 30% | $3,718,663 | $6,136,377 | $1,511,108 | 0.41 |
| 40% | $2,093,029 | $2,696,376 | $398,048 | 0.19 |
| 50% | $1,242,271 | $1,239,016 | $56,602 | 0.05 |
| 60% | $2,947,779 | $2,495,767 | $0 | 0.00 |
The 30% discount bin generated the most incremental sales: $6.14M, with sales iROAS of 1.65. The 15% bin generated $5.73M at 1.36 sales iROAS, but produced $2.27M in incremental margin compared with $1.51M for the 30% bin.
Across these historical groups, the 30% bin delivered about 7% more incremental sales and 34% less incremental margin than the 15% bin. The groups contain different promotions and investment levels; this is a comparison of their observed modeled results, not a forecast of switching the same promotion from 30% to 15%.
3. Rank discount efficiency as well as total contribution
Calculate Margin ROI by dividing incremental margin by promotion investment. For the 15% bin, $2,274,333 ÷ $4,209,641 gives approximately 0.54: $0.54 of modeled incremental margin per dollar of granted discounts. The total across discount bins is 0.30.
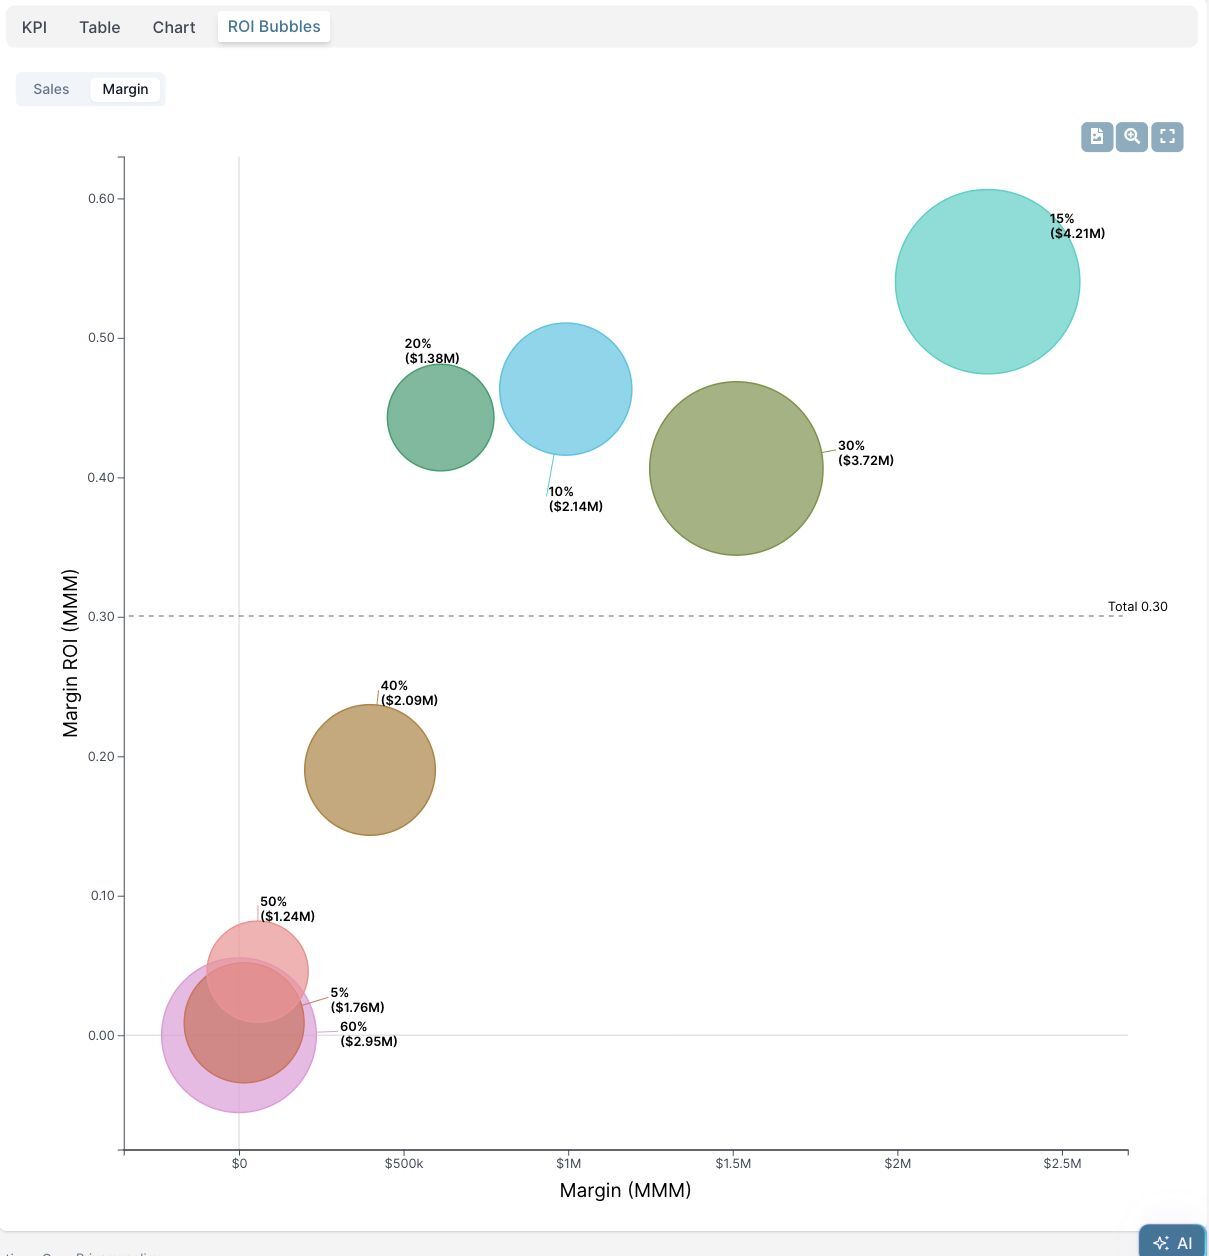
The 15% bin leads both incremental margin and Margin ROI in this example. Deeper discounts look progressively weaker on margin: 40% returns 0.19, 50% returns 0.05, and 60% generates no incremental margin in the displayed results.
Use ROI Bubbles → Margin to see this relationship visually. The vertical axis shows Margin ROI, while the bubble labels identify discount depth and promotion investment.
4. Choose what to repeat or redesign
Use 15% as the first candidate to investigate for the next promotion. Break the comparison down by promotion type and customer segment before applying that depth more widely. Where category detail is available, compare like-for-like products with similar margins and promotional timing.
Review 40%–60% offers for a shallower discount, narrower eligibility or a different mechanic. A clearance campaign may still have a stock-reduction purpose, but the sales uplift alone does not establish that it meets a margin objective.
For a promotion aimed at profitable growth, agree a minimum incremental-margin contribution and a Margin ROI requirement before launch. Test the proposed depth against the current offer, then compare the results on those same measures. Keep the promotion assumptions consistent when you build the accompanying media plan.
Further Reading and Resources
About the author

Lauri Potka is the Chief Operating Officer at Sellforte, with over 15 years of experience in Marketing Mix Modeling, marketing measurement and media spend optimization. Before joining Sellforte, he worked as a management consultant at the Boston Consulting Group, advising some of the world’s largest advertisers on marketing optimization. Follow Lauri on LinkedIn.
How to Compare Channels by Incremental Margin
How to Spot Saturation and Find Room to Scale