Performance Insights is the historical analysis view of Sellforte Performance. It exists for one reason: in most marketing teams, the numbers that explain what happened in a campaign live in three or four different places. Incrementality is in the MMM tool, platform-reported metrics are in Meta and Google Ads, GA4 attribution is somewhere else, and multi-touch attribution is in yet another system. Putting them next to each other usually means a spreadsheet.
Performance Insights replaces that spreadsheet with a single, consistent view.

What you can see in one place
For every campaign and ad set, Performance Insights shows incremental sales and conversions from the MMM, the metrics and attribution reported by the ad platform itself, and GA4 and MTA attribution for comparison. Because all of this sits at the same campaign or ad set granularity, you can read across a single row and see how each measurement approach describes the same activity.
This is where the value sits. Platform-reported ROAS tells you what the platform thinks happened. GA4 and MTA tell you what each model attributes. MMM-based incremental sales tell you what is actually likely to be causal. Seeing the three side by side surfaces the gaps between what was claimed and what was driven.
Customising the view
Performance Insights is designed to be flexible by default. You can pick which columns you want visible, save column sets for specific use cases, and switch between them as you move from one platform or market to another.
A few common patterns. A Paid Search analyst saves one column set focused on Google Ads metrics and incremental ROAS. A Paid Social lead saves a different one comparing Meta's 7-day click and 1-day view attribution against MMM incrementality. A regional lead saves one filtered to a single market with platform spend, incremental sales, and GA4 sessions visible.
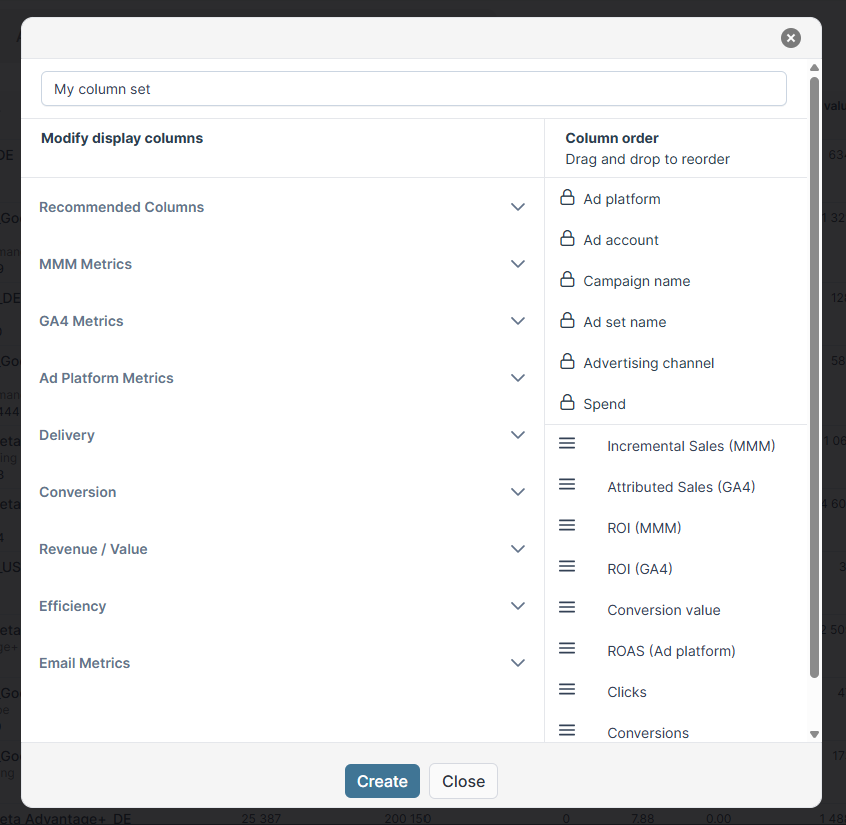
You can hide columns you do not need, reorder the ones you do, and reuse saved views across the team so everyone is looking at the same numbers when discussing the same question.
Built for complex setups
Performance Insights is designed for organisations operating across multiple markets, brands, and channels. You can filter performance data by country, brand, product category, or campaign structure while keeping the underlying metrics consistent and comparable.
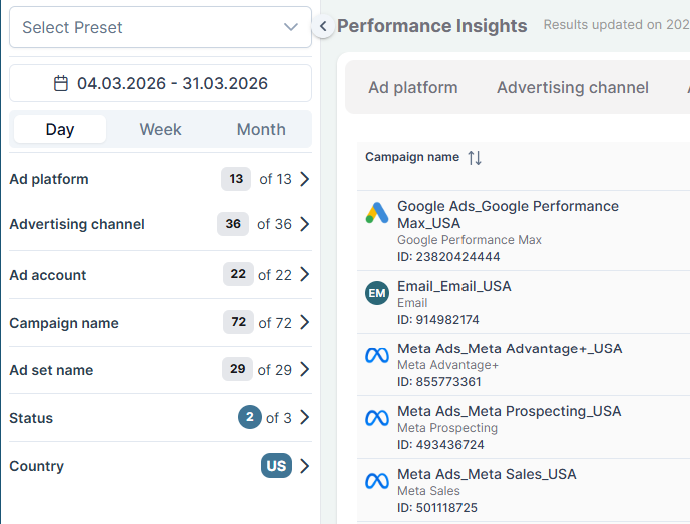
If you maintain separate reporting for each market today, the goal is to let you stop doing that. The metrics behave the same way regardless of how you slice them, so a question about a single country's Paid Social performance and a question about global Paid Search performance both get answered from the same view.
How Performance Insights fits into your workflow
Performance Insights is the analysis layer of Performance. Recommendations tells you what to change next, Change Intelligence tells you what your recent changes actually did, and Insights is where you investigate the broader picture: which campaigns are quietly underperforming on incrementality despite strong platform numbers, which markets have drifted from their target ROAS, which channels look stronger or weaker than the platform suggests.
It is also the foundation that makes the rest of Performance work. Reliable, consistent historical data is what the recommendation engine and Change Intelligence both depend on. Without it, automation and AI-driven optimisation are difficult to trust at scale.
Data requirements
Performance Insights uses the same data that powers your MMM. Platform connectors bring in spend and platform-reported metrics, the GA4 connector brings in attribution data, and the MMM provides incremental sales and conversions at the modelled level. No additional setup is required beyond connecting the data sources you want represented in the view.