MMM Use Case

ROAS depends partly on which interactions receive credit. A conversion after an ad view can appear in a view-through window even when the customer never clicks. Comparing attribution windows helps explain why a campaign looks different across reports.
Use Sellforte Performance Insights to put those windows beside MMM iROAS for the same campaigns. This public-demo example compares seven-day click, one-day view and the platform-reported ROAS for Meta Advantage+.
Before you start: Select the same campaigns, dates, market and conversion-value definition for each comparison.
What you will produce: A clear view of how ROAS changes with attribution scope, plus an incrementality factor tied to the reporting metric you use.
1. Keep the campaign scope fixed
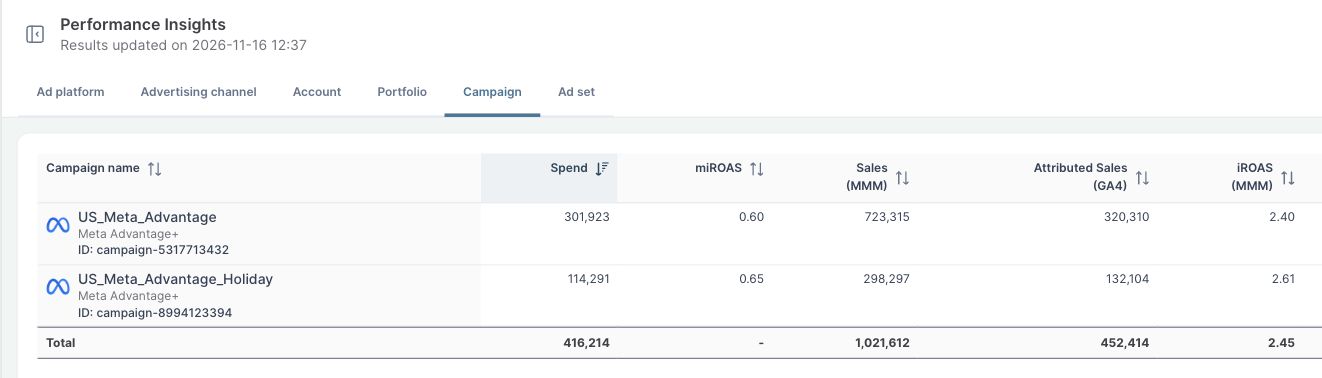
Open Performance → Insights, select the Campaign tab and filter Advertising channel to Meta Advantage+. This example uses US and October 19–November 15, 2026, across all 12 DMAs.
Use a completed reporting period and allow for conversion-reporting delays. A recent date range can understate a seven-day click result because some eligible conversions have not yet occurred or arrived in the data.
2. Add explicit attribution-window columns
Open the column-set selector and choose New Column Set. Retain Spend, Sales (MMM) and iROAS (MMM). Under Revenue / Value, add:
- Conv. val (7DC) per Cost: conversion value under the seven-day click window divided by spend.
- Conv. val (1DV) per Cost: conversion value under the one-day view window divided by spend.
- ROAS (Ad platform): the platform-reported metric supplied for the campaign.
Save the set with a short name such as MMM attribution windows. Performance Insights supports reusable column sets, so the paid-social team can use the same definitions in recurring analysis.

3. Read the size of the reporting difference
| Campaign | 7-day click ROAS | 1-day view ROAS | Platform ROAS | MMM iROAS |
|---|---|---|---|---|
| US_Meta_Advantage | 5.73 | 7.16 | 8.42 | 2.40 |
| US_Meta_Advantage_Holiday | 6.24 | 7.80 | 9.17 | 2.61 |
For US_Meta_Advantage, the one-day view figure is 7.16 compared with 5.73 for seven-day click. The difference is 1.43 ROAS points. This shows how differently the two attribution windows describe the same campaign; it does not mean that adding view-through credit to the click window creates an extra 1.43 in ROAS.
To measure the increase from adding view-through attribution, compare a deduplicated combined click-plus-view metric with its matching click-only metric:
Added reported ROAS = combined-window ROAS − click-only ROAS.
Share of combined reported value added = added reported ROAS ÷ combined-window ROAS.
The demo exposes a Conv. val (1DV 7DC) per Cost column, but it returned 0.00 for these campaigns in this snapshot. That is not a usable combined result for this calculation. Use a populated, verified combined metric in your own account. Do not add the separate 7DC and 1DV columns, or assume the generic platform ROAS column has a particular attribution setting.
4. Use the comparison in reporting and optimization
Keep the chosen attribution window explicit in performance targets. A target of 6 means something different against 7-day click ROAS of 5.73 than against platform ROAS of 8.42. Changing the reporting window does not itself change the campaign’s incremental sales.
One practical next step is to calculate an incrementality factor for the metric the team actually uses. For US_Meta_Advantage, 2.40 MMM iROAS ÷ 8.42 platform ROAS is approximately 28.5%. Against seven-day click ROAS, 2.40 ÷ 5.73 gives approximately 41.9%.
These are two mappings from different reported metrics to the same MMM result. Attach the factor to its campaign, period and attribution definition, and recalculate it when those change. It is a modeled adjustment to reported value, not a classification of individual conversions.
Use the factor to interpret platform reports or translate an incremental-return requirement into a corresponding reporting benchmark. For a budget or bid change, review miROAS and the expected response at the proposed spend level as well.
Further Reading and Resources
Understand the results
Apply the analysis
About the author

Lauri Potka is the Chief Operating Officer at Sellforte, with over 15 years of experience in Marketing Mix Modeling, marketing measurement and media spend optimization. Before joining Sellforte, he worked as a management consultant at the Boston Consulting Group, advising some of the world’s largest advertisers on marketing optimization. Follow Lauri on LinkedIn.
How to Compare Media Performance Across Regions
Which Campaigns Are Pulling Down Your Channel’s Return?