Incrementality Testing Use Case

To understand an inconclusive incrementality test in Sellforte, open Experiments, find the analyzed study, and read its uncertainty alongside its headline return. Then check the evidence appropriate to that test type: the source study for Meta Conversion Lift, or the counterfactual and treatment charts for GeoLift and A/B tests.
This guide uses the public Sellforte demo to answer: “Our test shows a positive iROAS, but can we use it to make a budget decision?” All screenshots and figures use simulated data.
Before you start: You need access to the analyzed result and the experiment’s design or source study. Define the decision and return threshold the test should inform.
What you will produce: A documented interpretation of what the test supports, what remains uncertain and which follow-up would help.
1. Find results that need a closer look
Open Experiments and keep the Experiment view selected. In Status, choose Deselect all, select Analyzed, then click outside the filter to close it.
Click the Confidence column heading to sort the results. Check the order and click again if necessary so lower values appear first. In the demo, the completed-test view contains 19 of 20 analyses.
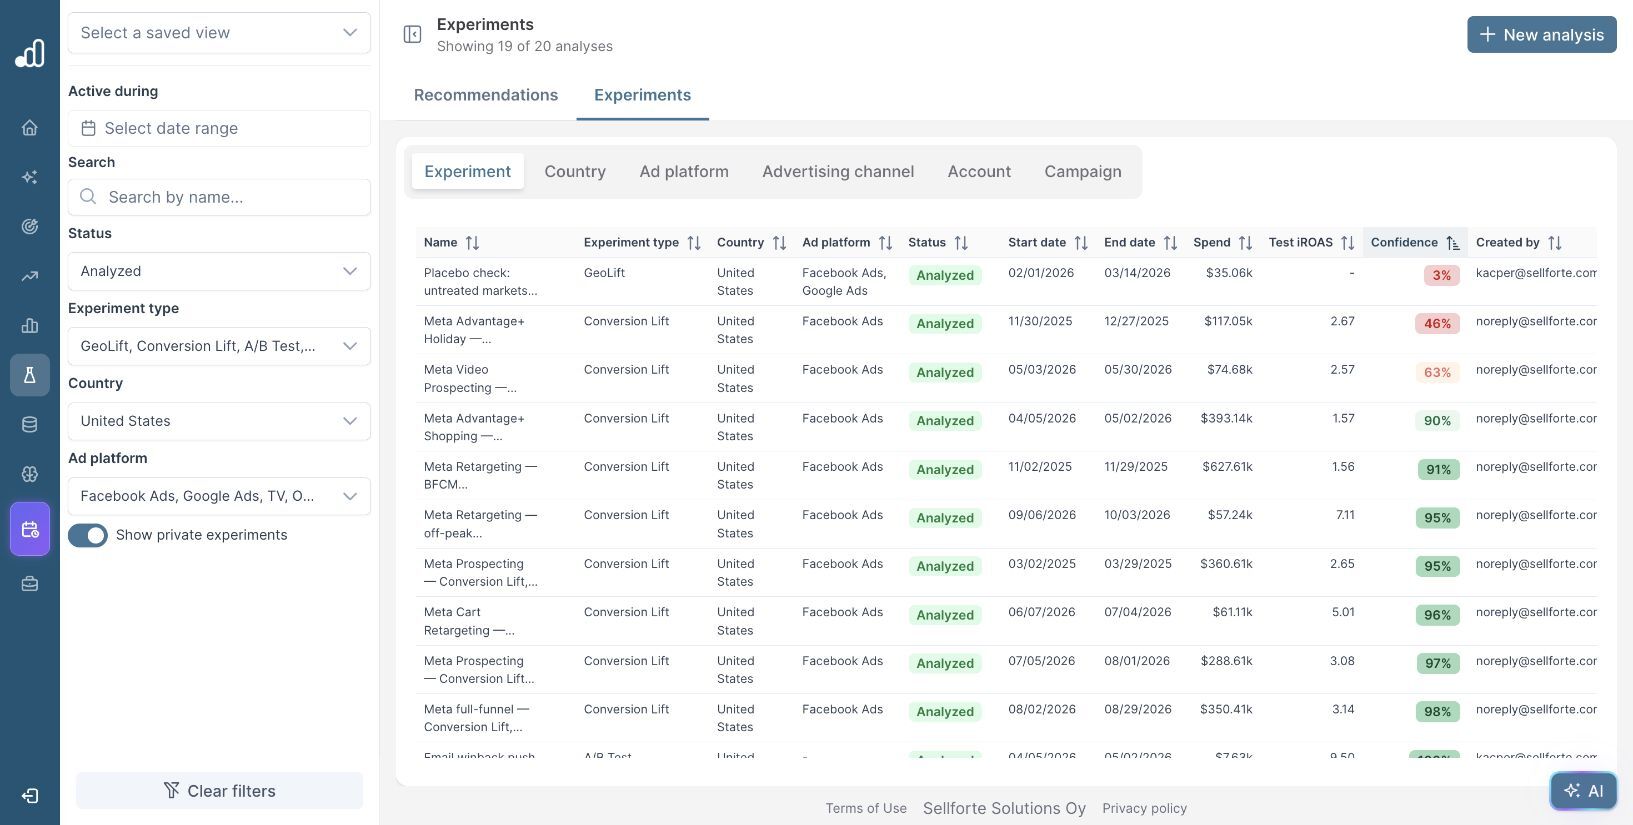
Use this ordering to decide what to inspect, rather than to assign an automatic pass or fail. A low-confidence campaign study, a deliberately untreated placebo check, and an analysis that failed to run are different situations. Analyzed is a processing status; it does not certify that the evidence is strong enough for your decision.
Open Meta Advantage+ Holiday — Conversion Lift, Dec 2025 — Purchase - Web. It ran in the United States from November 30 to December 27, 2025.
2. Read the interval before acting on the point estimate
The holiday study’s headline return is positive. Its uncertainty makes the interpretation more limited.
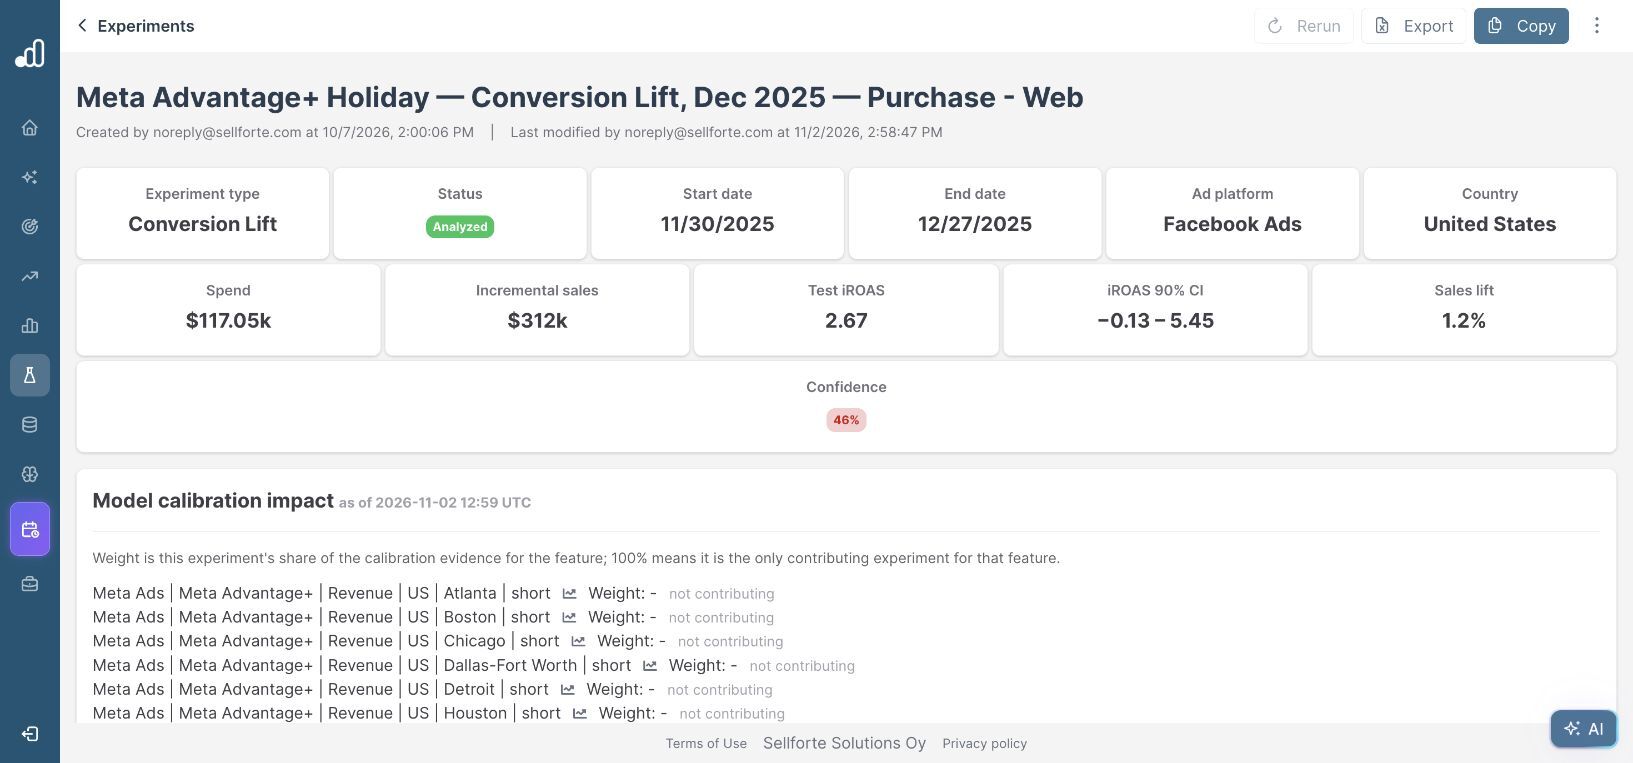
| Result card | Demo value | What to take from it |
|---|---|---|
| Spend | $117.05k | The investment associated with this study. |
| Incremental sales | $312k | A point estimate that needs its uncertainty and source context. |
| Test iROAS | 2.67 | The central estimate alone cannot settle the decision. |
| iROAS 90% CI | −0.13 to 5.45 | A broad range spanning zero and substantially positive returns. |
| Confidence | 46% | A further reason to inspect the underlying study before drawing a firm conclusion. |
The displayed interval includes zero. This study therefore does not give a precise positive return estimate to use as the sole basis for scaling the campaign. It also does not establish that the campaign had no effect.
Bring the business decision into the review. If your required revenue return were 3.0 iROAS, for example, this interval would contain outcomes both below and above that hurdle. That hypothetical threshold is separate from the study’s confidence metric. A test can provide evidence of positive incrementality and still be too uncertain to establish profitability.
For Conversion Lift, Meta supplies the reported confidence while Sellforte derives the displayed iROAS range from the export. Record them as separate fields; do not calculate one directly from the other.
3. Check the evidence for the test method
For this Meta Conversion Lift study, return to the original study and export. Verify the conversion event, treatment and holdout populations, study dates, delivery, and reported uncertainty. Confirm that the imported record corresponds to that study and that it is complete.
GeoLift’s R-squared and pre-treatment observation count are not required diagnostics for a Meta user-level holdout study. Do not interpret an absent synthetic-control field as proof that a Meta experiment failed. Check any claim in AI Summary against the source evidence before carrying it into your readout.
If you are reviewing a GeoLift or A/B Test result instead, scroll to the diagnostic charts and work through these questions:
- Did the counterfactual track the KPI before treatment? Inspect Target KPI vs Scaled Counterfactual for persistent gaps or a change in trend. Read R Squared as supporting context, not a complete quality verdict.
- Did the intended spend change happen? Where media data is available, inspect Target Media Investment vs Scaled Counterfactual. Check timing, magnitude and any interruptions against the execution record.
- When did the estimated effect appear? Use Cumulative Treatment Effect on KPI to inspect whether the pattern aligns with treatment and the agreed cooldown window.
- Were the controls still valid? Check group selections, spillover, promotions, data gaps and other events that could affect the comparison.
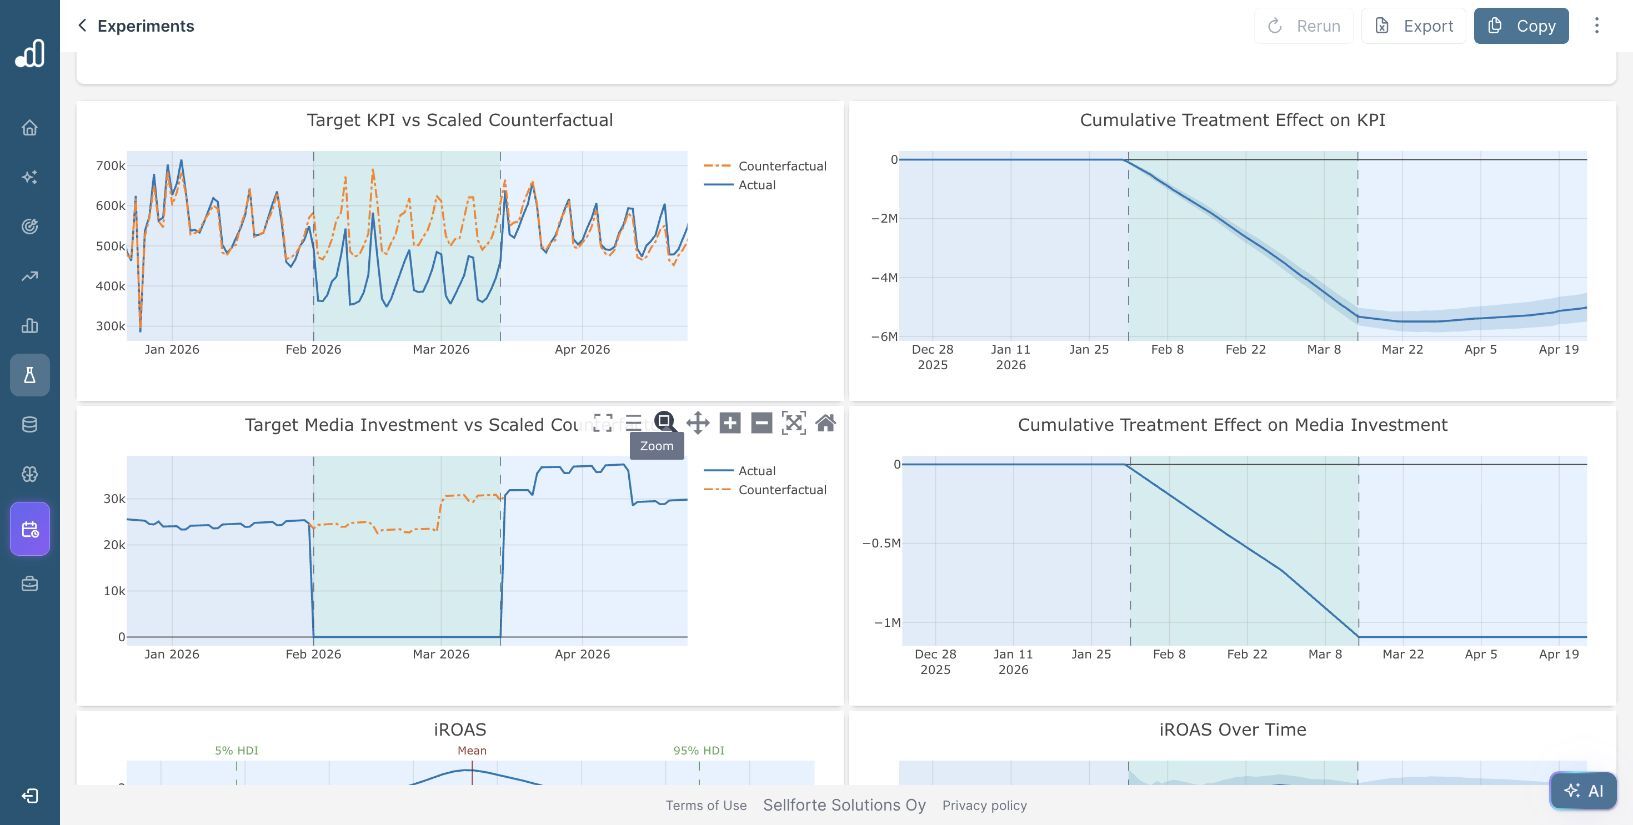
The screenshot above is a separate completed geo test, included to show where these checks live. Its clear go-dark spend reduction and sales response are not diagnostics for the holiday Meta study. Follow the same chart review on the geo or A/B result you are investigating.
4. Separate an uncertain result from a placebo check
The first row in the sorted demo list is Placebo check: untreated markets, Feb–Mar 2026, with 3% confidence. Its purpose differs from a campaign test: it examines markets where no treatment was intended.
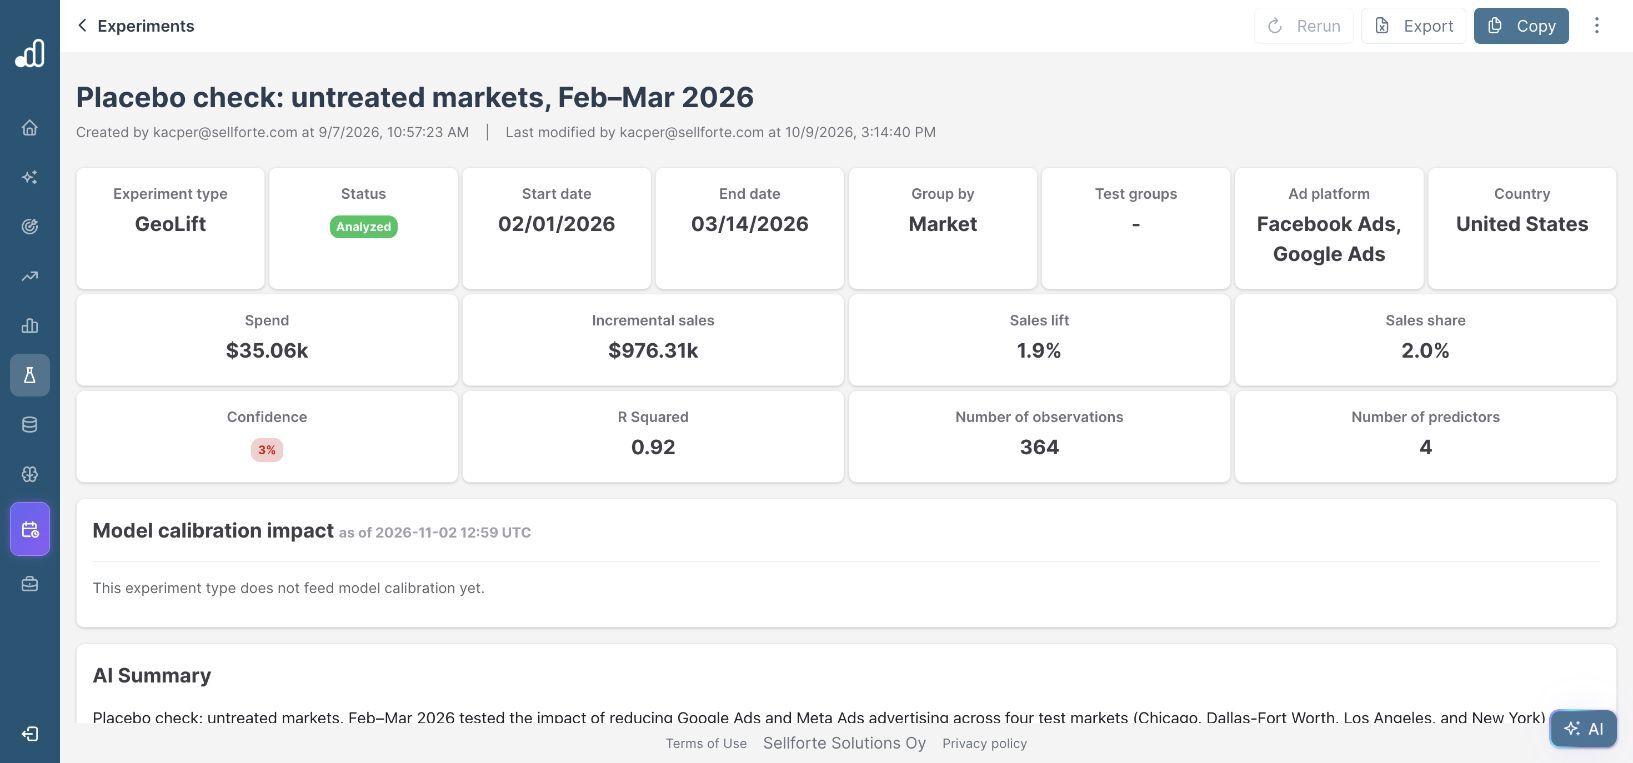
A placebo check asks whether an analysis detects an effect where one should be absent. A low confidence value alone neither proves that the check passed nor means that advertising failed. Review the signed effect, its uncertainty, the chosen markets and the placebo design. In this demo, the detailed group tables are empty, so the record cannot independently verify the full setup.
Keep placebo checks, alternative analyses and the primary campaign result clearly identified in your notes. They answer different questions and should not be counted as independent campaign tests.
5. Record what is known and choose the next action
Under Comments, record the observed result, the unresolved question and the follow-up needed. Separate a suspected cause from one you have verified. A wide interval alone does not establish that the test was too short, the budget was too small, or the controls were contaminated.
The simulated holiday Conversion Lift study reports 2.67 test iROAS, but its displayed 90% interval is −0.13 to 5.45 and confidence is 46%. This is too uncertain to use alone for a scaling decision. We will verify the source Meta study and import, document any execution issues, and decide whether a redesigned test would resolve the remaining budget question.
Correct verified data or setup errors before re-analysis, and preserve the reason for the correction. If the study was valid but uninformative, plan a follow-up with a clear decision threshold and sufficient ability to detect the effect that matters. Avoid repeatedly changing dates or controls until a favorable result appears.
Use test recommendations to put the unresolved question back into your testing priorities, and compare it with relevant previous studies before deciding how much weight it deserves.
Further Reading and Resources
About the author

Lauri Potka is the Chief Operating Officer at Sellforte, with over 15 years of experience in Marketing Mix Modeling, marketing measurement and media spend optimization. Before joining Sellforte, he worked as a management consultant at the Boston Consulting Group, advising some of the world’s largest advertisers on marketing optimization. Follow Lauri on LinkedIn.
How to Import and Analyze a Meta Conversion Lift Study
How to Analyze Your Latest Geo Test