


To analyze a completed geo test in Sellforte, open Experiments, filter for analyzed GeoLift tests, and open the relevant result. You can then check the sales impact, confirm that spend changed as intended, and assess how precise the estimate is.
This guide follows that workflow in the public Sellforte demo. The example is “Meta + Google go-dark — 4 markets, Feb–Mar 2026”. All screenshots and figures use simulated demo data.
Before you start: You need access to Experiments and a GeoLift analysis with the status Analyzed.
What you will produce: A short readout covering the tested activity, incremental effect, uncertainty, and follow-up action.
1. Find your latest analyzed geo test
Choose Experiments in the left navigation, then stay on the Experiments tab. In the filter panel:
- Set Experiment type to GeoLift. Use Deselect all first if several types are selected.
- Set Status to Analyzed.
- Narrow the list by Country, Ad platform, or Search if needed.
- Use the End date column to find the most recently completed test. Click its heading to change the sort direction until the newest dates appear first.
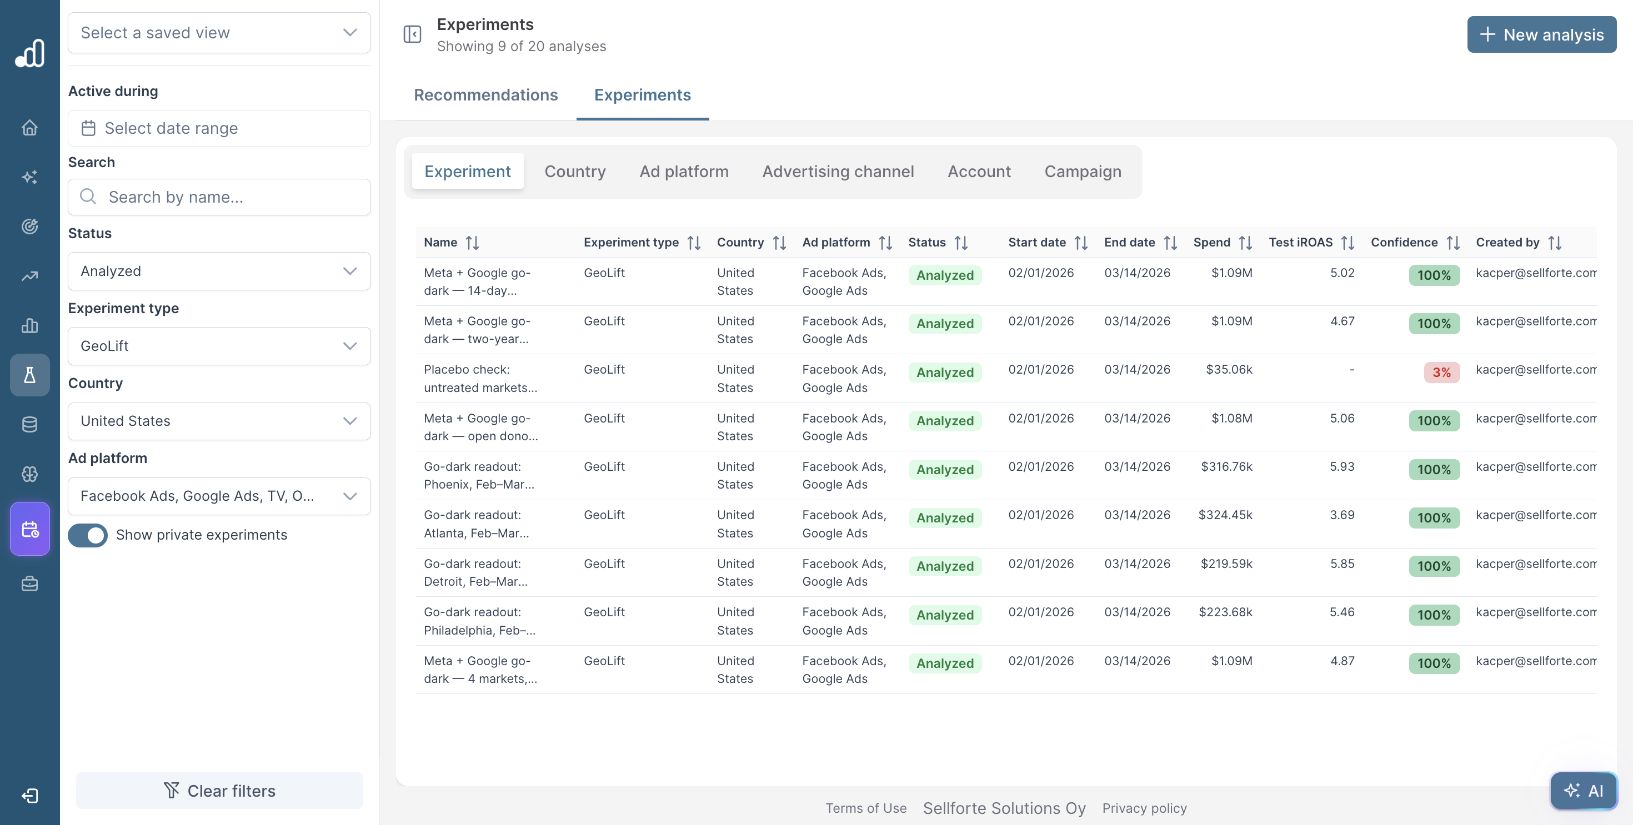
A recent modification date can belong to an older test. Also check the name: a placebo analysis, a market-specific readout, and a robustness check can share the same dates. Open the analysis that matches the question you need to answer.
For this walkthrough, search for 4 markets and select Meta + Google go-dark — 4 markets, Feb–Mar 2026.
2. Confirm what was tested
At the top of the result, check the experiment type, status, dates, country, and ad platform. The demo analysis covers February 1–March 14, 2026, in the United States, with Facebook Ads and Google Ads selected.
The name identifies this as a go-dark test: advertising was paused in the test markets. That matters when interpreting the charts. A sales decline during a pause is evidence that the removed advertising had been generating sales.
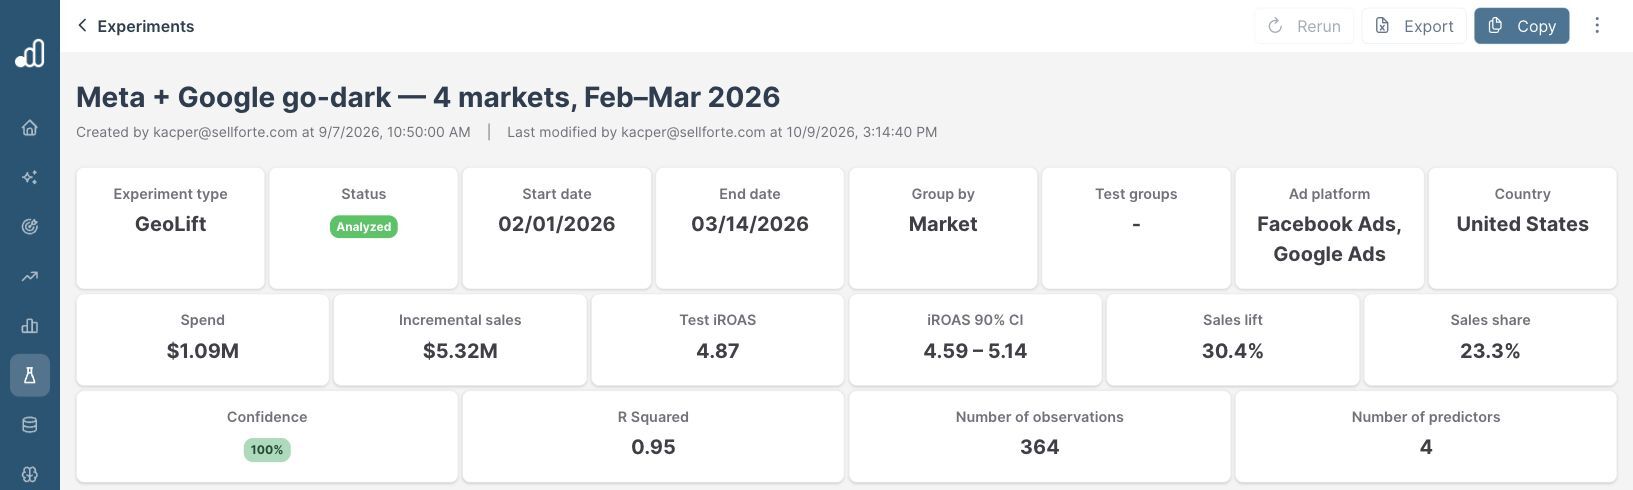
The test-group card is blank in this demo record. In your own analysis, confirm the treated regions and KPI definition against the experiment setup before approving the readout. The name alone is not enough to establish the full scope.
3. Read the headline result
Read Spend, Incremental sales, and Test iROAS together. For a geo test, the spend figure relates to the change against the counterfactual: the model’s estimate of what would have happened without the intervention.
| Result card | Demo value | Interpretation |
|---|---|---|
| Spend | $1.09M | The magnitude of the spend reduction relative to the counterfactual. |
| Incremental sales | $5.32M | The magnitude of the estimated sales lost during the pause. |
| Test iROAS | 4.87 | Approximately $4.87 in sales lost per $1 of advertising spend removed. |
| iROAS 90% CI | 4.59–5.14 | The displayed uncertainty interval around that return. |
The cards display positive amounts, while the cumulative charts below show the negative changes in sales and spend. Check both views before writing your conclusion. This result does not mean that pausing advertising generated $5.32M in extra sales.
4. Check that the charts support the result
Scroll to the charts. Start with Target Media Investment vs Scaled Counterfactual. In the example, actual spend falls close to zero during the highlighted treatment period, while counterfactual spend continues. This confirms that the intended pause is visible in the data.
Next, read Target KPI vs Scaled Counterfactual. Actual sales fall below the counterfactual during the same period. The Cumulative Treatment Effect on KPI chart shows the estimated sales loss building through the test window.
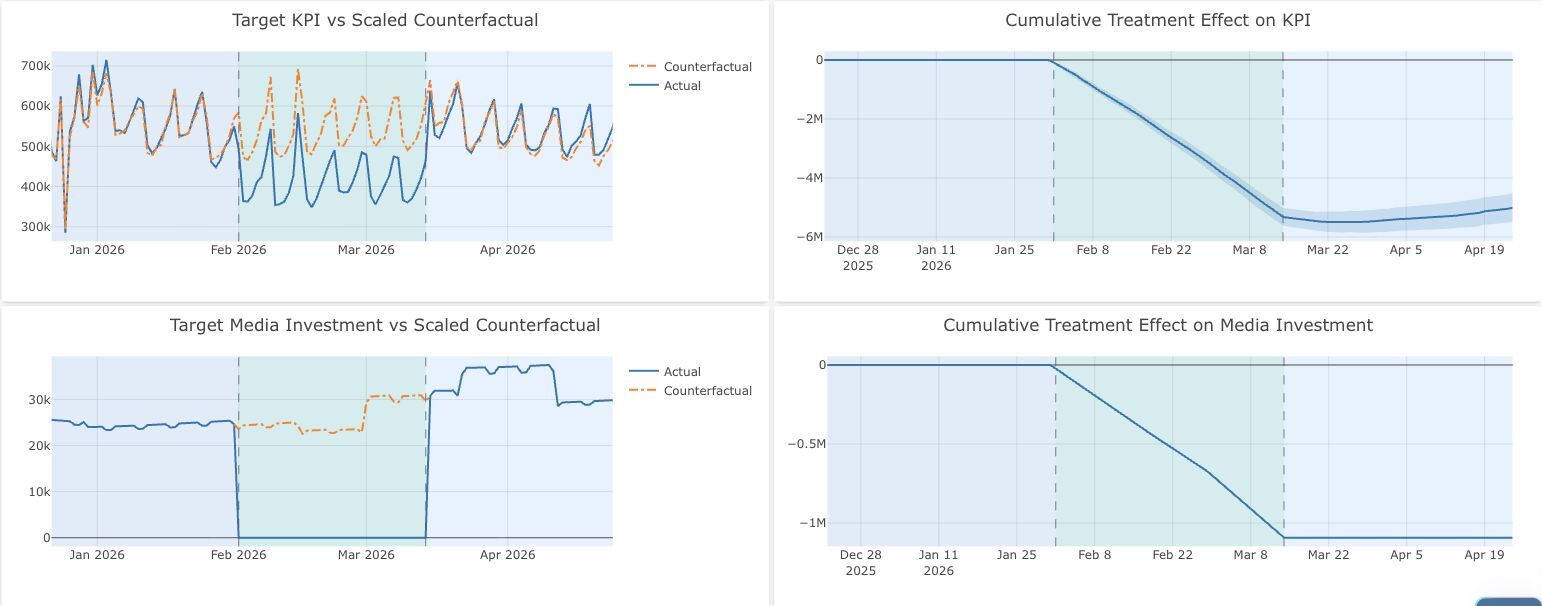
Before the treatment starts, check whether actual sales and the counterfactual track each other reasonably well. The R Squared card is 0.95 in this example. It summarizes pre-treatment fit; it does not establish that every assumption behind the test is valid.
Further down, review Test groups and Control groups where populated. If the regions or control weights are missing, ask the analysis owner to confirm the setup. If spend did not change as planned, or the pre-test fit is poor, resolve that issue before relying on the headline return.
5. Assess the uncertainty
Scroll to the iROAS distribution and compare it with the iROAS 90% CI card. The demo estimate is concentrated around 4.87, with a displayed interval of 4.59–5.14. Read that range alongside the central estimate when judging the result.

A displayed Confidence of 100% should not be read as a guarantee about the real world. It remains a model-based result, subject to the data and test design. For a budget decision, compare the return range with your business’s profitability requirement and keep the conclusion within the tested scope.
If you need more detail on any card or chart, use the experiment results dashboard reference.
6. Save a readout your team can use
Read the AI Summary as a starting point, then check its figures, dates, regions, and interpretation against the result cards and charts. In a go-dark test, make sure the wording clearly describes sales lost when spend was removed.
For this example, a concise readout would be:
The Meta and Google go-dark analysis for February 1–March 14 estimates that removing about $1.09M in spend reduced sales by about $5.32M. Test iROAS is 4.87, with a 90% interval of 4.59–5.14. The charts show both the spend pause and the sales decline. Before using this result for a budget decision, confirm the treated regions and KPI scope, then compare the return with our profitability requirement.
Scroll to Comments, enter the checked conclusion and next action, and select Add comment. Include who will follow up and what still needs to be verified. Share the experiment’s page link with colleagues who have access.
If you also use MMM, inspect Model calibration impact on the result page. This demo geo test explicitly says it does not feed model calibration yet. Check the status shown for your own test before assuming that the result has changed the model.
Open the Sellforte demo to follow the workflow, or explore Sellforte Geo Tests for the data and analysis options.
Further Reading and Resources
Work with geo-test results
Analyze tests with Sellforte MCP
About the author

Lauri Potka is the Chief Operating Officer at Sellforte, with over 15 years of experience in Marketing Mix Modeling, marketing measurement and media spend optimization. Before joining Sellforte, he worked as a management consultant at the Boston Consulting Group, advising some of the world’s largest advertisers on marketing optimization. Follow Lauri on LinkedIn.


