Incrementality Testing Use Case

To compare a new incrementality test with previous results in Sellforte, find the relevant studies in Experiments, open each result, and compare its scope, timing, spend and uncertainty. Build the comparison around the decision you need to make, rather than ranking studies by iROAS alone.
This guide asks: “Does our latest Meta Prospecting study change what we learned from the previous one?” It uses two completed studies from the public Sellforte demo. All figures and screenshots use simulated data.
Before you start: You need the new analysis, at least one relevant earlier study, and a clear decision the comparison should inform.
What you will produce: A comparison table and a short conclusion that distinguishes measured differences from possible explanations.
1. Find the new study and its closest earlier match
Open Experiments and keep the Experiment view selected. Clear an old name search or restrictive date range if necessary. Enter Meta Prospecting in Search.
The demo returns 2 of 20 analyses: the July 2026 repeat study and the March 2025 study. Both are analyzed Conversion Lift studies for Facebook Ads in the United States, and both names specify Purchase - Web.
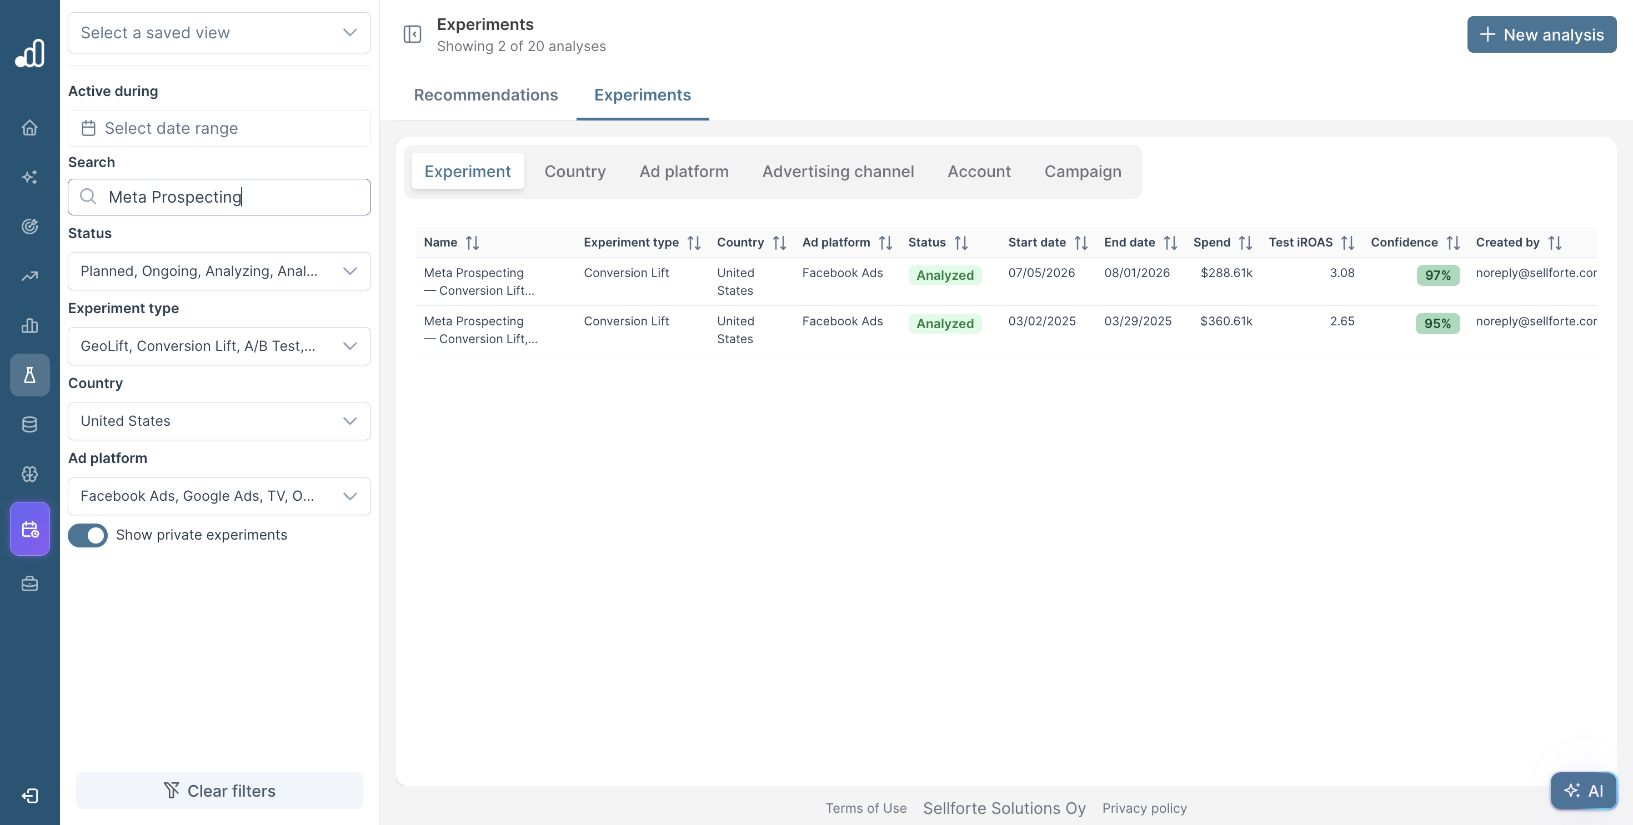
In a larger library, combine the search with Status: Analyzed, the relevant Country, Ad platform and Experiment type. Sort by End date and check that the most recent treatment period appears first. The record’s creation or modification date is not the date the test ran.
Name search is useful for locating a candidate, but it does not establish comparability. A study called “Video Prospecting” may cover different activity from one called “Prospecting”. If you need help building the shortlist, use the guide to finding previous tests by channel or market.
2. Open both results and confirm what was measured
Open the July 2026 Meta Prospecting repeat study and the March 2025 Meta Prospecting study. Keeping the pages in separate browser tabs makes it easier to check the details.
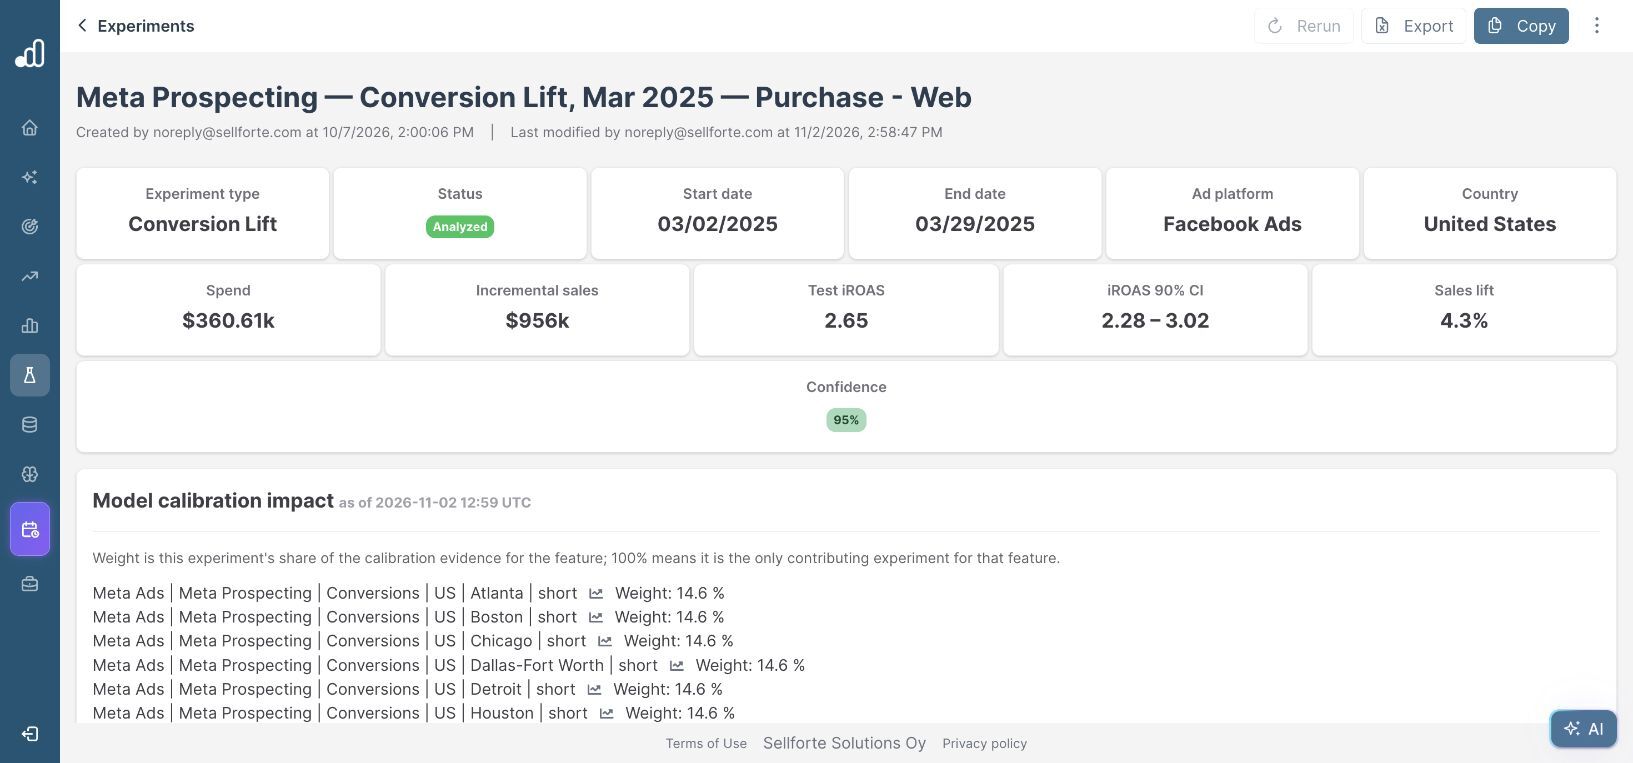
Read the result header and original study details for each. Confirm:
- The same business outcome and measurement definition, including whether purchases cover web, app or both.
- The countries, audiences, campaigns and exclusions included in the test.
- The method and intervention, including what the holdout group did not receive.
- The treatment period, duration, spend level, promotions and seasonal context.
- The currency and whether return is measured on revenue or another KPI.
For this pair, the headers establish the same platform, country and experiment type. The names suggest the same purchase scope. You still need the source studies to confirm audience and campaign comparability. Matching labels alone cannot prove that the only difference was performance.
3. Put the verified metrics in a comparison table
Copy the current result-card values into your working notes. Keep the interval beside the point estimate so uncertainty remains visible throughout the comparison.
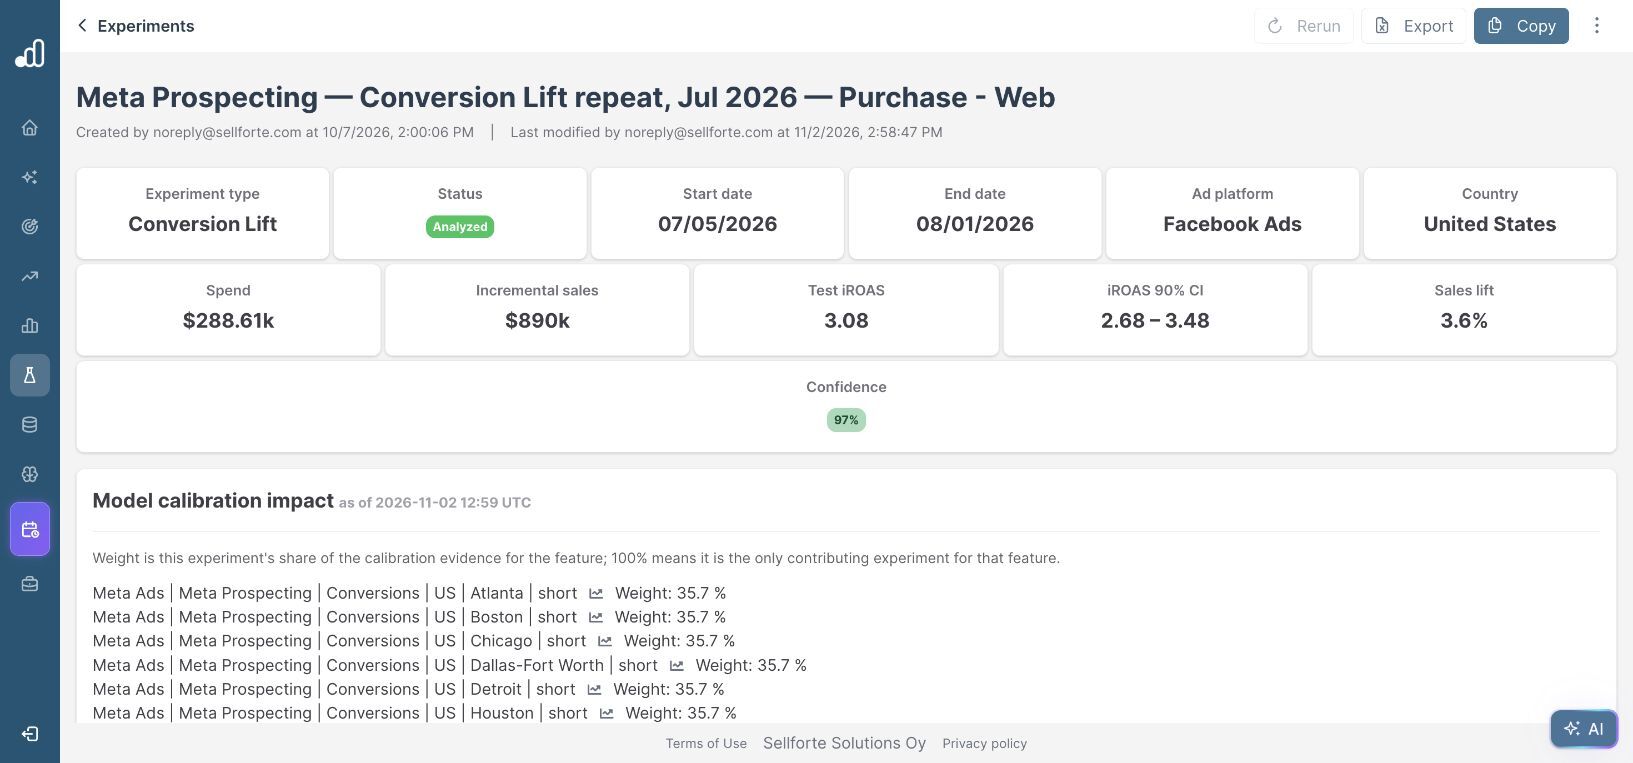
| Field | Earlier study | Repeat study |
|---|---|---|
| Study period | March 2–29, 2025 | July 5–August 1, 2026 |
| Experiment type | Conversion Lift | Conversion Lift |
| Market and platform | United States; Facebook Ads | United States; Facebook Ads |
| Spend | $360.61k | $288.61k |
| Incremental sales | $956k | $890k |
| Test iROAS | 2.65 | 3.08 |
| iROAS 90% CI | 2.28 to 3.02 | 2.68 to 3.48 |
| Sales lift | 4.3% | 3.6% |
| Confidence | 95% | 97% |
This table is a readout assembled from the two result pages. The walkthrough uses the library and individual analyses; it does not require a separate comparison screen.
Check any AI Summary against the current cards and source study before reusing its wording. If the figures disagree, resolve the discrepancy rather than combining values from different versions of the result.
4. Separate the observed difference from its explanation
The newer study’s point estimate is 0.43 iROAS higher: 3.08 versus 2.65. It also has lower spend and lower estimated incremental sales. These observations describe different aspects of the result. A higher return per dollar does not necessarily mean more total incremental revenue.
The displayed intervals overlap, from 2.68 to 3.02. Do not call the difference a proven improvement from these two point estimates. Interval overlap is not itself a formal test of the difference either. A stronger claim would require comparable study designs and an analysis of the uncertainty in the difference.
Check possible explanations against evidence: different audience composition, campaigns, creative, auction conditions, season, promotions or investment level. The studies are more than a year apart, so there is substantial room for context to have changed. Record an explanation as a hypothesis until the underlying records support it.
For a new budget decision, also distinguish the tested return from the return on the next dollar of spend. A study’s average iROAS does not establish marginal incremental ROAS at a larger budget.
5. Keep repeated analyses separate from repeated tests
When comparing geo results, check whether two rows describe separate experiments or alternative analyses of the same intervention. In the demo, the four-market go-dark result, the 14-day cooldown readout and the two-year pretreatment robustness check share the same February–March 2026 treatment period.
Those analyses help examine sensitivity to assumptions. They are not three independent replications. Keep the primary result and its robustness checks together, and describe which setting changes between them.
Also check the media scope. A combined Meta-and-Google geo test estimates the return of that combined intervention. Its iROAS should not be presented as a direct channel-level comparison with a Meta-only Conversion Lift study.
6. Save the comparison and its next action
Write a short conclusion that preserves both the evidence and the limits of the comparison. For the two demo studies:
The July 2026 US Meta Prospecting study reports 3.08 test iROAS, compared with 2.65 in March 2025. The displayed 90% intervals are 2.68–3.48 and 2.28–3.02. Both studies provide positive return estimates, but this comparison alone does not establish that performance improved. We will verify audience and campaign comparability and use the newer study alongside the earlier evidence when reviewing the next budget.
In your workspace, save the readout under Comments on the newer analysis. Include the earlier experiment’s URL and the question you still need to resolve. This makes the comparison available when someone revisits the result later.
If uncertainty prevents a decision, follow how to understand an inconclusive incrementality test. If the evidence is no longer representative of the activity you plan to run, use test recommendations to prioritize a new study.
Further Reading and Resources
Find and read the source studies
Interpret differences and uncertainty
About the author

Lauri Potka is the Chief Operating Officer at Sellforte, with over 15 years of experience in Marketing Mix Modeling, marketing measurement and media spend optimization. Before joining Sellforte, he worked as a management consultant at the Boston Consulting Group, advising some of the world’s largest advertisers on marketing optimization. Follow Lauri on LinkedIn.
How to Import and Analyze a Meta Conversion Lift Study
How to Decide What to Test Next