

Incremental Attribution is the practice of correcting attribution data using evidence about marketing's incremental impact. It adjusts the revenue, conversions, or return on ad spend credited to marketing so that everyday performance reports better reflect the additional business marketing is estimated to have generated.
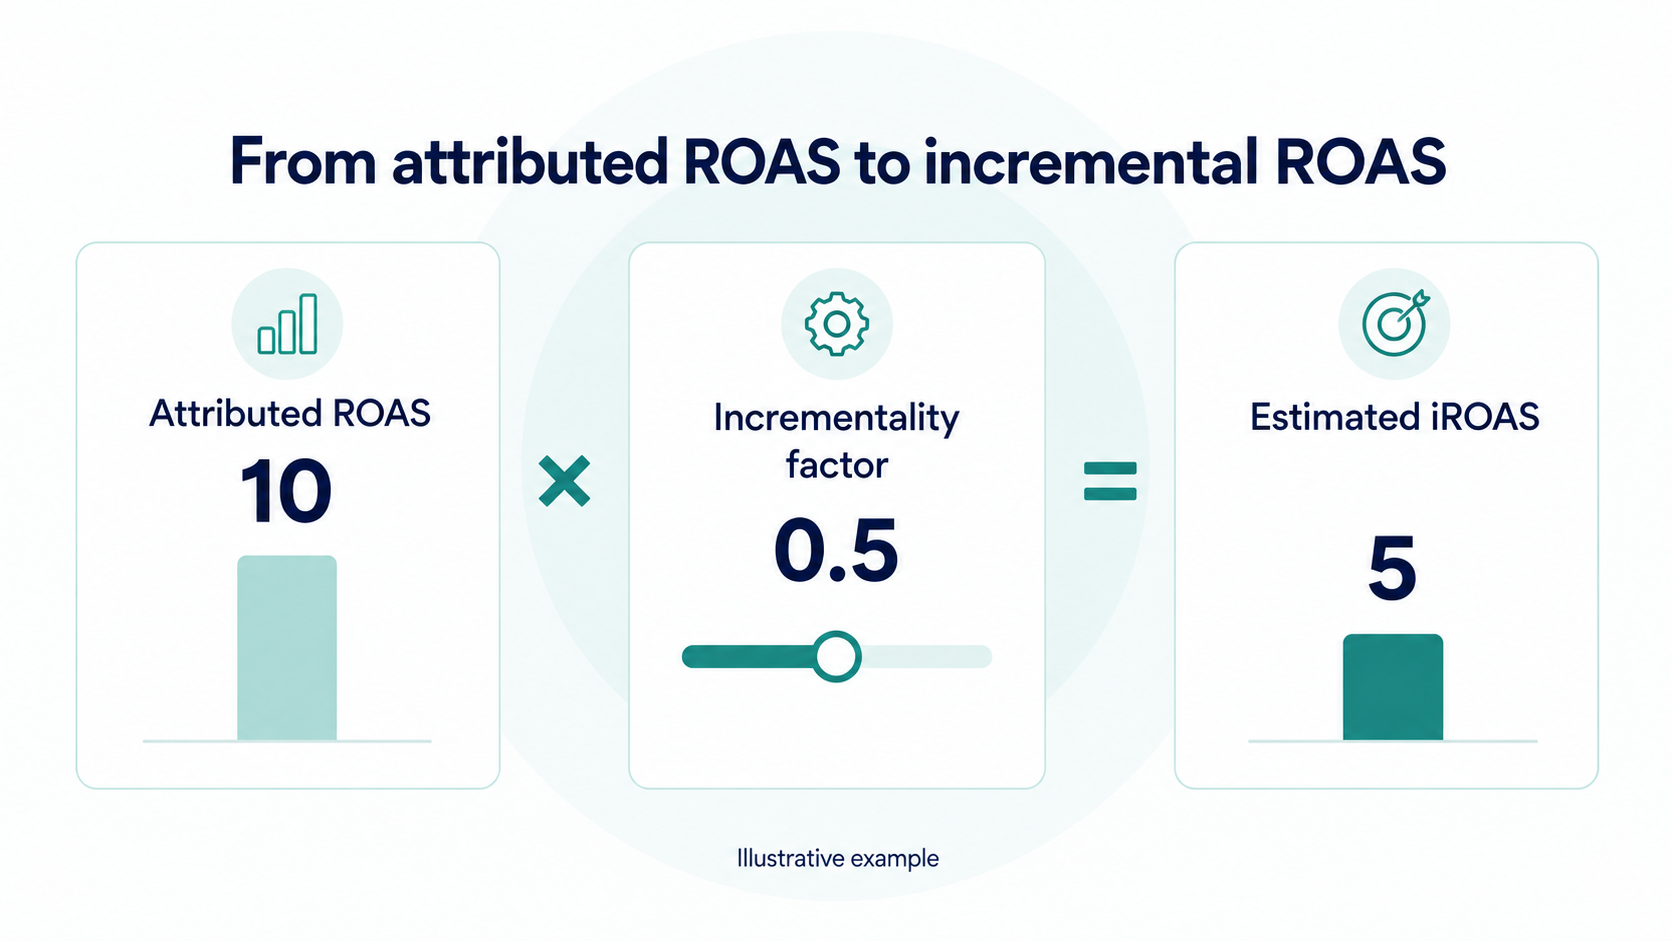
Imagine your attribution report shows a return on ad spend of 10. An incrementality experiment estimates that the same campaigns generated an incremental ROAS of 5. The experiment changes how you should interpret performance, but tomorrow morning your team still needs to manage campaigns using the reports in front of them.
Incremental Attribution connects the experiment to that daily work. It can use evidence from incrementality tests or Marketing Mix Modeling (MMM) to correct results from GA4, ad platforms, or a multi-touch attribution model.
This guide explains the concept, the calculations, and how to put the approach into practice. It also covers the limits of correction, because a useful reporting system needs to make clear which results were measured directly and which depend on shared assumptions.
What is Incremental Attribution?
Incremental Attribution combines detailed attribution reporting with evidence about causality. Attribution supplies the observable campaign and customer-journey information. Incrementality evidence helps determine how much business impact that activity deserves credit for.
The output is an estimate of incremental performance at a useful reporting level, such as a campaign group, campaign, or ad set. The level at which evidence was measured may be broader than the level displayed in the report.
A common implementation applies a correction factor to attributed revenue or ROAS. For example, if a credible experiment estimates half the revenue attributed to a campaign group, a factor of 0.5 brings that group's attributed result into line with the experimental estimate.
Other implementations incorporate incrementality evidence into the attribution model's weights. Those require additional choices about model training and credit allocation. This guide focuses on correcting attribution outputs, which makes the calculation and its assumptions easier to inspect.
You may also see this described as incrementality-calibrated attribution or incrementality-corrected attribution. When evaluating a solution, check how it obtains causal evidence and how that evidence changes the reported results.
Not to be confused with Meta's Incremental Attribution setting
Meta also offers an Incremental Attribution setting that uses its models to optimize for and report on conversions it estimates would not have occurred without its ads.
In this guide, Incremental Attribution refers to the broader practice of using incrementality evidence from experiments or MMM to correct attribution data across sources such as GA4, ad platforms, and MTA. Enabling Meta's setting does not, by itself, perform that cross-platform calibration.
Why attribution needs incrementality correction
Attribution records relationships between marketing interactions and purchases. A customer may click a retargeting ad and then buy. The attribution system can accurately record both events without establishing whether the advertising caused the purchase.
For an existing customer who already intended to return, the credited revenue may exceed the additional revenue generated by the ad. For another customer, an awareness campaign may create interest that later turns into a purchase through a different channel. Attribution may assign that earlier campaign little credit.
These differences matter when teams compare campaigns. A high attributed ROAS can reflect strong purchase intent in the audience. A low attributed ROAS can reflect limited visibility into a campaign's contribution. Both require evidence before drawing conclusions about incrementality.
Deduplication and incrementality answer different questions
Several platforms can claim the same purchase because each observes a qualifying interaction. A cross-channel attribution model can reconcile those claims and distribute the credit for one order across the observed touchpoints.
Reconciliation alone does not establish how much of the order was caused by marketing. A model can allocate every sale exactly once and still over-credit advertising that mainly reaches customers who were already likely to buy.
Incrementality correction addresses that causal question. Our explanation of why platform ROAS and incremental ROAS differ explores the implications for interpreting performance.
Attribution, experiments, MMM, and Incremental Attribution
Each method contributes different information. Understanding their roles helps a team decide what to measure directly, what to model, and which results can support daily execution.
| Method | Main question | Role and limitation |
|---|---|---|
| Attribution | Which observed marketing interactions receive credit? | Provides detailed reporting. Observed journeys alone do not establish the sales that would have happened without advertising. |
| Incrementality testing | What changed because of a defined marketing intervention? | Provides direct causal evidence when the test is well designed. Findings apply to the tested conditions and include uncertainty. |
| Marketing Mix Modeling | How do marketing and other factors contribute to business outcomes? | Provides broader estimates and can model spending response. Results depend on data, assumptions, and calibration evidence. |
| Incremental Attribution | How should attribution results be adjusted to reflect incremental impact? | Connects causal evidence to detailed reporting. Its accuracy depends on the evidence and how effects are allocated. |
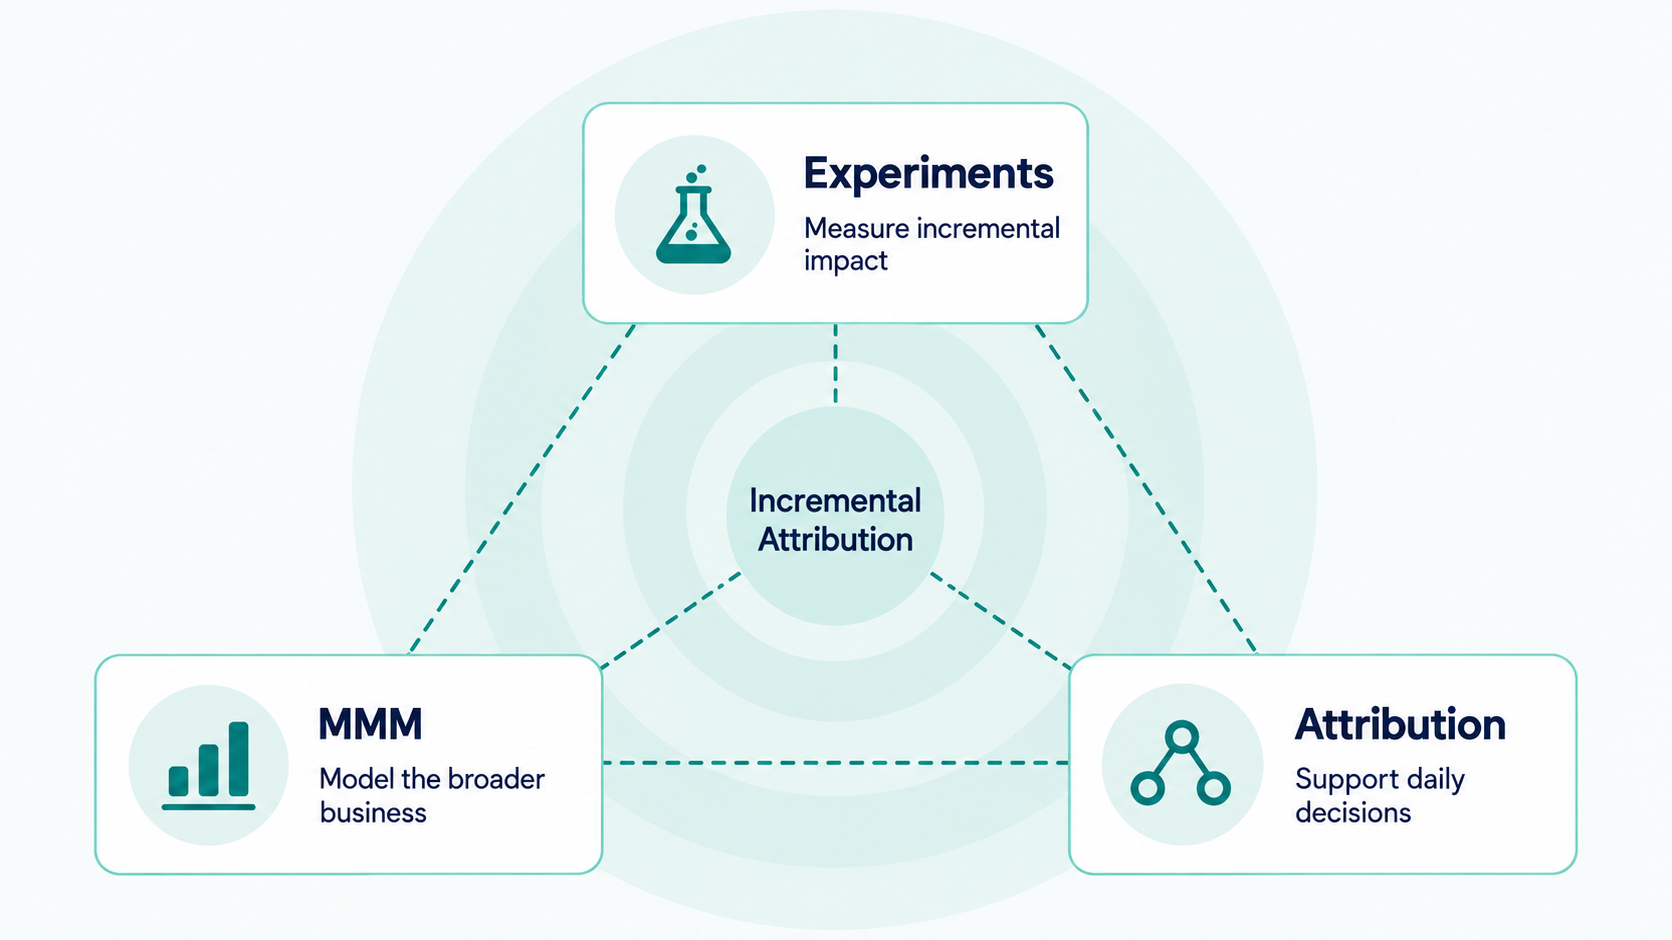
At Sellforte, we describe the connection between experiments, MMM, and attribution as the measurement triangle. A common workflow starts with experiments, uses them to calibrate MMM, and then applies the model's incremental estimates to attribution reporting.
A team can also start more narrowly, using a suitable experiment to correct attribution for the tested activity. A full MMM program becomes useful as the questions expand to more channels, other sales drivers, and how returns change with spending.
MMM calibration and attribution correction are separate steps. MMM calibration changes the model's estimates. Attribution correction changes the interpretation of attribution results. Where both steps are present, use the fitted model's output for the downstream correction. See the guide to MMM calibration for the upstream process.
How incrementality correction works
The simplest correction uses an incrementality factor, also called a calibration multiplier:
Incrementality factor = estimated incremental revenue ÷ attributed revenue
Apply that factor to the relevant attribution output:
Estimated incremental revenue = attributed revenue × incrementality factor
When the spend basis matches, the equivalent calculation uses ROAS:
Incrementality factor = estimated incremental ROAS ÷ attributed ROAS
Estimated incremental ROAS = attributed ROAS × incrementality factor
A positive factor below one reduces attribution credit. A factor above one increases it, which can be appropriate when attribution misses part of the measured impact. A factor of one means the estimates agree for that scope.
The multiplier is a ratio between measurement outputs. It is not the probability that a particular customer was influenced, and it is not inherently capped at 100%.
Each factor is tied to its attribution source and settings. A factor calculated against GA4 cannot automatically be used to correct Meta's reporting or a different MTA model. Changing the attribution window can also change the denominator and require a new factor.
The same principle can apply to conversion counts, but the outcome must remain consistent. A purchase-count factor and a revenue factor need not be equal when order values differ. Label the corrected metric accordingly.
Worked examples: correcting and comparing ROAS
Example 1: translating a test into a correction factor
Suppose a campaign group spends $10,000 and receives $100,000 in attributed revenue. A credible experiment estimates $50,000 in incremental revenue for the same activity and measurement scope. These figures are illustrative.
- Attributed ROAS: $100,000 ÷ $10,000 = 10.
- Experimental incremental ROAS: $50,000 ÷ $10,000 = 5.
- Incrementality factor: $50,000 ÷ $100,000 = 0.5.
- Corrected ROAS: 10 × 0.5 = 5.
The corrected result reproduces the evidence used to calculate it. That reconciliation verifies the arithmetic; it is not an independent test of accuracy.
Using the factor on next month's attribution data assumes that the relationship between attribution and incrementality remains applicable. New audiences, a different campaign mix, or changed tracking can weaken that assumption.
Example 2: a different view of campaign performance
Consider two campaign groups with separately supported factors. The values below are hypothetical and are not channel benchmarks.
| Campaign group | Attributed ROAS | Incrementality factor | Estimated incremental ROAS |
|---|---|---|---|
| Group A | 10 | 0.3 | 3.0 |
| Group B | 6 | 0.8 | 4.8 |
Group A looks stronger in the attribution report. After correction, Group B has the higher estimated incremental return at the measured spending levels. That changes the performance assessment, although deciding where to add budget still requires information about marginal returns.
Within a group, applying the same positive factor to every campaign preserves their existing ROAS ranking. The shared factor adjusts the group's overall level of credit without resolving errors in the attribution model's relative allocation.
For the detailed mathematics of allocating a group result to ad sets and reconciling totals, see Calibrating MTA with Incrementality.
Where the incrementality evidence comes from
Direct experiment evidence
Conversion-lift studies, geo-lift tests, and suitable customer holdouts can estimate the effect of defined marketing activity. The appropriate method depends on the intervention, available controls, sales coverage, and whether the test can measure an effect precisely enough for the decision.
Read the test design before using the headline ROAS. A test that switches advertising off measures a different intervention from one that increases an existing budget. The return on additional spend should not automatically become a multiplier for all historical spend.
Match the tested activity to the attribution data. Preserve campaign IDs, markets, dates, conversion definitions, and the relevant post-test observation period. Our incrementality testing guide explains the methods, while the guide to assessing test credibility covers design and interpretation.
MMM-derived evidence
An MMM can estimate incremental revenue across a broader set of activities and periods. Dividing the appropriate modeled contribution by attributed revenue produces a factor for the matching group.
Experiments can inform the model, but a fitted MMM result is still a modeled estimate. It may differ from an individual test because it combines additional evidence or covers different conditions. Investigate material disagreements rather than forcing the two numbers to match without understanding the cause.
A growing body of experiments
As evidence accumulates, avoid treating every result as equally relevant or independent. Tests may concern different campaign objectives, share underlying observations, or reflect different spending conditions. Several exports of one experiment are still one experiment.
Combining results requires a documented method that considers uncertainty and relevance. A simple average of the latest multipliers can hide those differences. An experiment library and calibration interface can make the evidence and the choices behind each estimate easier to review.
Choosing the right level of detail
Start with the decisions the team needs to make, then check whether the evidence can support that level of detail. Useful distinctions may include market, campaign objective, prospecting versus retargeting, or branded versus non-branded search.
A single paid-social factor can combine activities with very different attribution visibility. Traffic campaigns generate clicks that a click-based system can observe. Awareness and engagement campaigns may affect purchases without the same trail of clicks. One multiplier can be a poor fit for both.
Separate groups where the data and evidence support doing so. The discussion of campaign objectives in calibration explains why these distinctions matter when constructing the upstream model.
More rows do not create more causal evidence. If a test estimates the combined effect of ten campaigns, assigning that effect to each campaign requires additional evidence or an allocation assumption. Show when a campaign inherits a broader group's factor.
There is also a practical lower limit. Very small attributed amounts create unstable ratios, and zero attributed revenue cannot be corrected with multiplication. For activity that is largely invisible to the existing system, use another suitable signal or a different estimation approach. Any replacement attribution signal still needs its own calibration.
How to implement Incremental Attribution
1. Define the decision and outcome
Choose the first report and business decision the corrected metric will support. A weekly campaign review might use incremental net revenue per dollar spent. An acquisition review might focus on incremental new customers.
Agree on sales coverage and value horizon. Web revenue, web-plus-app revenue, store sales, and predicted customer lifetime value are different outcomes. If the correction intentionally expands an online attribution signal to total sales impact, label that wider scope explicitly.
2. Reconcile the original attribution data
Check that spend and attributed outcomes match the source reports for the selected filters and dates. Use stable campaign and ad set IDs to connect datasets. Missing rows or duplicated joins can look like an incrementality disagreement.
Record the attribution model, window, and any existing redistribution rules. The correction must refer to the version of the data that people actually use.
3. Map evidence to campaign groups
Identify which experiments or MMM estimates support each group. Preserve their scope, outcome definition, and uncertainty. Mark borrowed evidence and shared factors so a user can distinguish them from a direct measurement of that campaign.
A group without suitable evidence should remain visibly uncalibrated or receive a clearly labeled provisional estimate with a documented rationale. Silently filling missing factors with one creates the appearance of validation.
4. Apply and document the correction
Calculate corrected revenue first, then divide by spend to obtain iROAS. Keep the original results available alongside the corrected results. A practical report includes spend, attributed revenue, the factor, estimated incremental revenue, and estimated iROAS.
For each factor, retain the evidence source, covered campaigns, effective period, and last review date. These are useful operating practices even when the first version lives in a spreadsheet.
5. Check the final reporting view
Confirm that the intended groups receive the intended factors and that later reporting steps do not change the corrected quantities. To aggregate a coherent set of campaign estimates, sum incremental revenue and divide by total spend. Do not average ROAS values without accounting for spend.
Review overlap before adding independently estimated channel effects. Separate experiments may measure effects that are conditional on other advertising being present; they do not automatically provide an additive decomposition of all sales.
6. Put the result into a recurring decision
Assign responsibility for reviewing evidence and maintaining the mapping. Bring corrected performance into an existing campaign meeting, record the action taken, and monitor what happened afterward. The operational value comes from changing the information used for decisions.
Using it for campaign targets and budgets
Translate an incremental target into platform reporting
A platform may optimize against its own attributed conversion value. If the applicable factor is positive, an incremental ROAS target can be translated into that reporting system:
Platform ROAS target = incremental ROAS target ÷ platform-specific incrementality factor
With a desired incremental ROAS of 5 and a factor of 0.5, the corresponding platform target is 10. This assumes the factor remains applicable. It does not guarantee that the platform will achieve the target or that returns remain stable at a different spending level.
The guide to setting ROAS targets using incrementality develops this calculation.
Use marginal returns when changing investment
Average iROAS describes the return across the measured spend. Marginal incremental ROAS describes the expected return on the next unit of spend. A campaign with a strong historical average may already be close to saturation.
Incrementality correction alone does not estimate a response curve. For decisions about adding or removing budget, combine calibrated performance with evidence about marginal incremental ROAS, along with business constraints and the outcome you want to optimize.
Revenue return also differs from profit return. Product margins, returns, and variable costs can change the investment decision even when two campaigns have the same incremental revenue ROAS.
What does an Incremental Attribution solution look like in practice?
In everyday use, the team needs to move from understanding campaign performance to deciding what to change. The two Sellforte views below show how that workflow can work: compare measurement outputs for the same campaign, then review a proposed action using marginal incremental ROAS.
Measurement: compare reported and incremental returns in one view
Performance Insights brings modeled incremental results, ad-platform metrics, and GA4 or MTA attribution into a campaign and ad set view. Teams can filter the activity and read across a row to investigate how each measurement approach describes it.
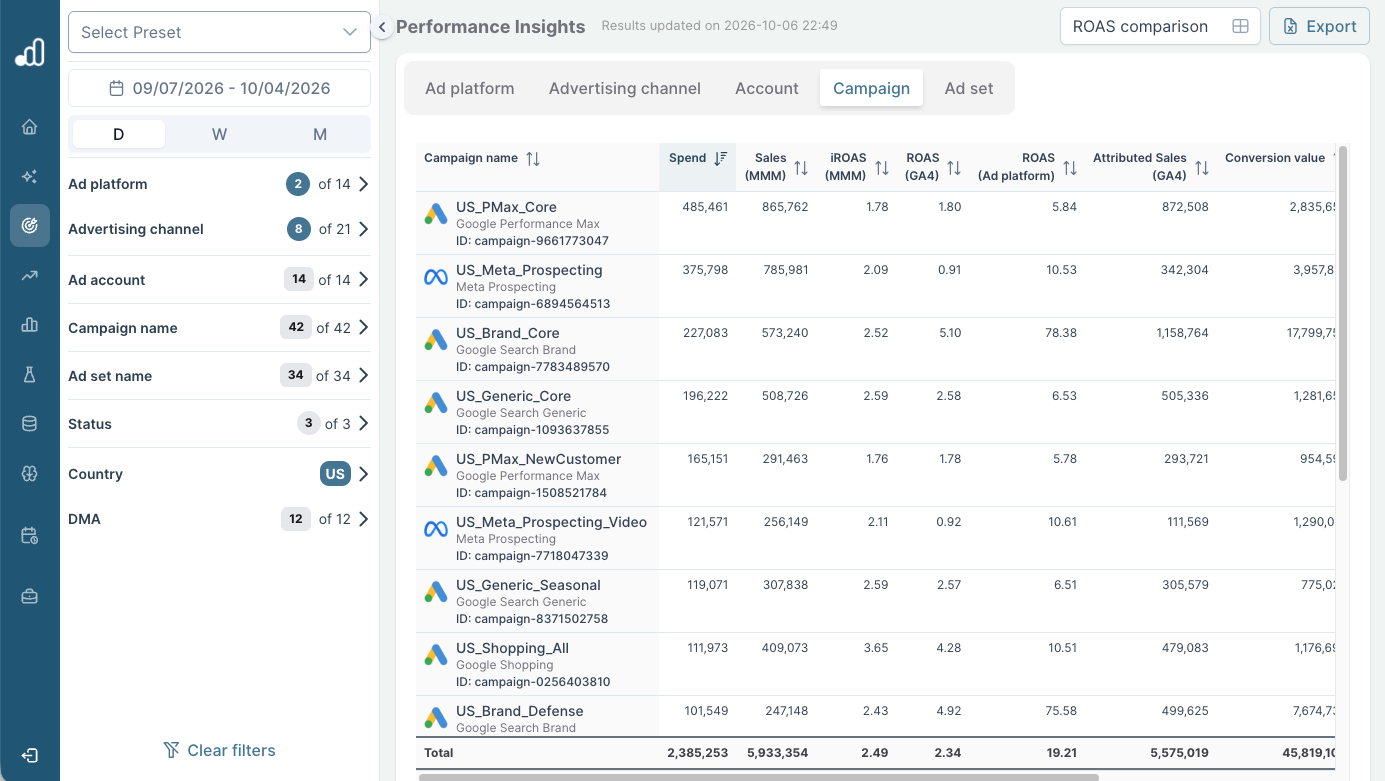
In the example above, US_Brand_Core shows a platform ROAS of 78.38, a GA4 ROAS of 5.10, and a modeled iROAS of 2.52. The interface labels the latter two columns ROAS (GA4) and iROAS (MMM). Here, the modeled return corresponds to modeled incremental sales divided by spend; it should not be read as a profit-margin calculation.
The gap changes the interpretation of performance. A large platform number alone provides little guidance about how much additional business the campaign created. Seeing the measures together gives the team a starting point for checking attribution bias, sales coverage, and the evidence behind the incremental estimate.
This view supports measurement and diagnosis. Keep the selected period, campaign scope, and revenue definitions clear when comparing columns. The values shown belong to this example view and are not benchmarks for those channels.
Optimization: use miROAS to assess the next spending decision
Performance Recommendations connects marginal incremental ROAS with proposed bid or budget changes. The cards show a recommended action and its projected impact, which the team can inspect before applying a change.

For example, US_PMax_Core shows miROAS of 0.81 and a proposed increase in target ROAS from 3.80 to 4.63. A higher target can constrain spending and improve efficiency. US_Shopping_All shows miROAS of 3.12 and a proposed reduction in target ROAS from 5.69 to 4.58, allowing the campaign more room to spend.
These are different questions from the historical ROAS comparison. A miROAS of 3.12 estimates the incremental sales from the next dollar spent under the modeled conditions. Whether that is attractive depends on margins, the business objective, and the alternatives for that dollar.
Some cards show a negative projected sales impact alongside an efficiency recommendation. Spending less can reduce sales while improving the economics of the remaining investment. Review the expected spend change and business impact together before acting.
The working sequence is to investigate performance, inspect the proposed adjustment, and then monitor the outcome after a change. Keep projected impact separate from measured results. The screenshots show different views and update times, so their values should not be treated as a matched before-and-after test.
Validation, uncertainty, and refreshing the evidence
A correction should be traceable to its source and tested against evidence beyond the data used to construct it. Matching the experiment used to derive a factor confirms the calculation, while a new suitable experiment provides a stronger check on whether the relationship still holds.
Keep uncertainty visible. For example, if the opening illustration's experimental iROAS estimate ranged from 4 to 6 while attributed ROAS was fixed at 10, the implied factor range would be 0.4 to 0.6. This arithmetic carries through the experimental range; it does not account for additional uncertainty when transferring the factor to other campaigns or future periods.
An inconclusive test does not establish zero impact. A factor at or below zero needs interpretation of the underlying estimate and its uncertainty, and cannot support the positive-factor target-ROAS calculation above. Avoid selecting only favorable experiments.
Review factors when new experiments arrive, campaign objectives or audience composition change, spending moves materially, tracking changes, or attribution settings are updated. A daily report can use a factor derived from older evidence; frequent reporting does not mean causal evidence has been refreshed daily.
Use a regular review schedule alongside those triggers. Compare old and new factors, identify what changed, and distinguish a measurement revision from a change in campaign performance before drawing a trend conclusion.
Common mistakes to avoid
| Mistake | Why it matters | Better approach |
|---|---|---|
| Using one universal platform factor | Objectives, audiences, markets, and attribution sources can behave differently. | Use supported groups and document where a broader factor is inherited. |
| Applying an MTA factor to platform revenue | The denominator has changed. | Derive the factor against the exact reporting source being corrected. |
| Reading a channel test as proof for every ad set | Detailed allocation still depends on assumptions. | Separate directly measured results from estimates allocated within a group. |
| Multiplying a missing attribution signal | Zero remains zero; small denominators can produce extreme factors. | Investigate measurement coverage and choose a usable signal or estimation method. |
| Forcing corrected paid-media revenue to equal all sales | Some sales would occur without the measured advertising. | Preserve the incremental quantities and keep baseline sales conceptually separate. |
| Combining current revenue with future customer value | The numbers represent different value horizons. | Define and label each outcome, avoiding duplicate counting of future purchases. |
| Scaling budgets solely from average iROAS | Average returns do not show what the next dollar will generate. | Use marginal return estimates and spending-response evidence. |
Frequently asked questions
Is Incremental Attribution the same as multi-touch attribution?
No. MTA distributes credit across observed touchpoints. Incremental Attribution uses incrementality evidence to adjust the credit assigned by an attribution system. MTA can be the underlying system, but so can GA4 or platform reporting.
Do I need MMM before I can start?
You can start with a credible experiment and comparable attribution data for the tested activity. MMM becomes useful when you need broader ongoing estimates, multiple sales drivers, and a model of how returns change with spending.
Does an incrementality factor above one make sense?
It can. A factor above one means the incremental estimate exceeds the attributed result for the defined scope. Check for undercounted effects, intentionally broader sales coverage, or a mismatch between the two inputs before accepting it.
Can I use the same factor for every country?
Only if you can justify transferring the relationship. Customer mix, campaign strategy, and tracking coverage may differ. Label evidence borrowed from another country and seek local validation where the decision warrants it.
Can it measure awareness and upper-funnel campaigns?
Experiments and MMM can estimate effects that click-based attribution misses. Applying those estimates to granular reporting requires a usable signal and an appropriate allocation method. A multiplier alone cannot recover activity that the attribution system never observes.
Should corrected revenue add up to total business revenue?
Corrected paid-media revenue does not have to equal all business revenue. Sales also reflect existing demand and other drivers. A broader model may reconcile baseline and other components to total sales, but that is a separate accounting structure.
How often should factors be updated?
Update them when relevant new evidence or material changes justify it, with a regular review cadence to catch stale assumptions. The cadence should reflect the business and testing program. There is no universal daily, weekly, or monthly factor refresh rule.
Does correction make every campaign estimate causal?
The causal evidence comes from the experiment or the assumptions and evidence supporting the model. Multiplication does not independently establish a causal effect for each campaign. Report the evidence level and any allocation assumptions alongside the result.
How Sellforte approaches Incremental Attribution
Sellforte connects incrementality testing, MMM, and attribution so that evidence about additional sales can inform ongoing campaign decisions. Sellforte Incremental Attribution provides an ongoing performance view across platforms, campaigns, and ad sets, including comparisons between platform-reported and incremental results.
The approach can use existing attribution data. Sellforte Incremental Pixel provides a native website tracking layer for customer journeys and conversions. That data supports attribution, while experiments and MMM provide the evidence used for incrementality calibration.
For your own setup, start with one campaign group, a clearly defined outcome, and credible incrementality evidence. Reconcile the correction, bring it into the team's campaign review, and use the unresolved questions to plan the next test.
Book a Sellforte demo to discuss how Incremental Attribution could work with your existing measurement and campaign reporting.
Further Reading and Resources
Explore related guides on attribution, incrementality testing, MMM calibration, and campaign optimization, plus practical Sellforte product resources.
Attribution and Incrementality
Experiments and MMM Calibration
ROAS and Campaign Optimization
- ROAS, iROAS, miROAS: Choosing the Right KPI for Optimizing Media Spend
- Marginal Incremental ROAS (miROAS): What is it? And why does it matter to marketers?
- How to Set a Target ROAS That Reflects True Incrementality
- Bid Optimization: How to Calculate the Optimal Bid Values for Your Campaigns Using miROAS
About the author

Lauri Potka is the Chief Operating Officer at Sellforte, with over 15 years of experience in Marketing Mix Modeling, marketing measurement and media spend optimization. Before joining Sellforte, he worked as a management consultant at the Boston Consulting Group, advising some of the world’s largest advertisers on marketing optimization. Follow Lauri on LinkedIn.

Is attribution enough on its own? Why MMM and incrementality testing are required

Isn’t MMM just a quarterly project?