MMM Use Case

To quantify the cost of a fixed media commitment, optimize two plans with the same total budget: one that keeps the commitment fixed and one that allows the budget to move. The difference in forecast sales estimates the opportunity cost of the constraint within the options you have allowed.
This worked example uses simulated US data in the public Sellforte demo. The four-week planning window runs from the week beginning November 15 to the week beginning December 6, 2026. Both scenarios use the same weeks from the previous year as their reference.
Before you start: A total budget, a fixed channel commitment, and realistic spending limits for the remaining channels.
What you will produce: A matched scenario comparison showing the forecast sales value of releasing the commitment.
1. Build the plan with the commitment in place
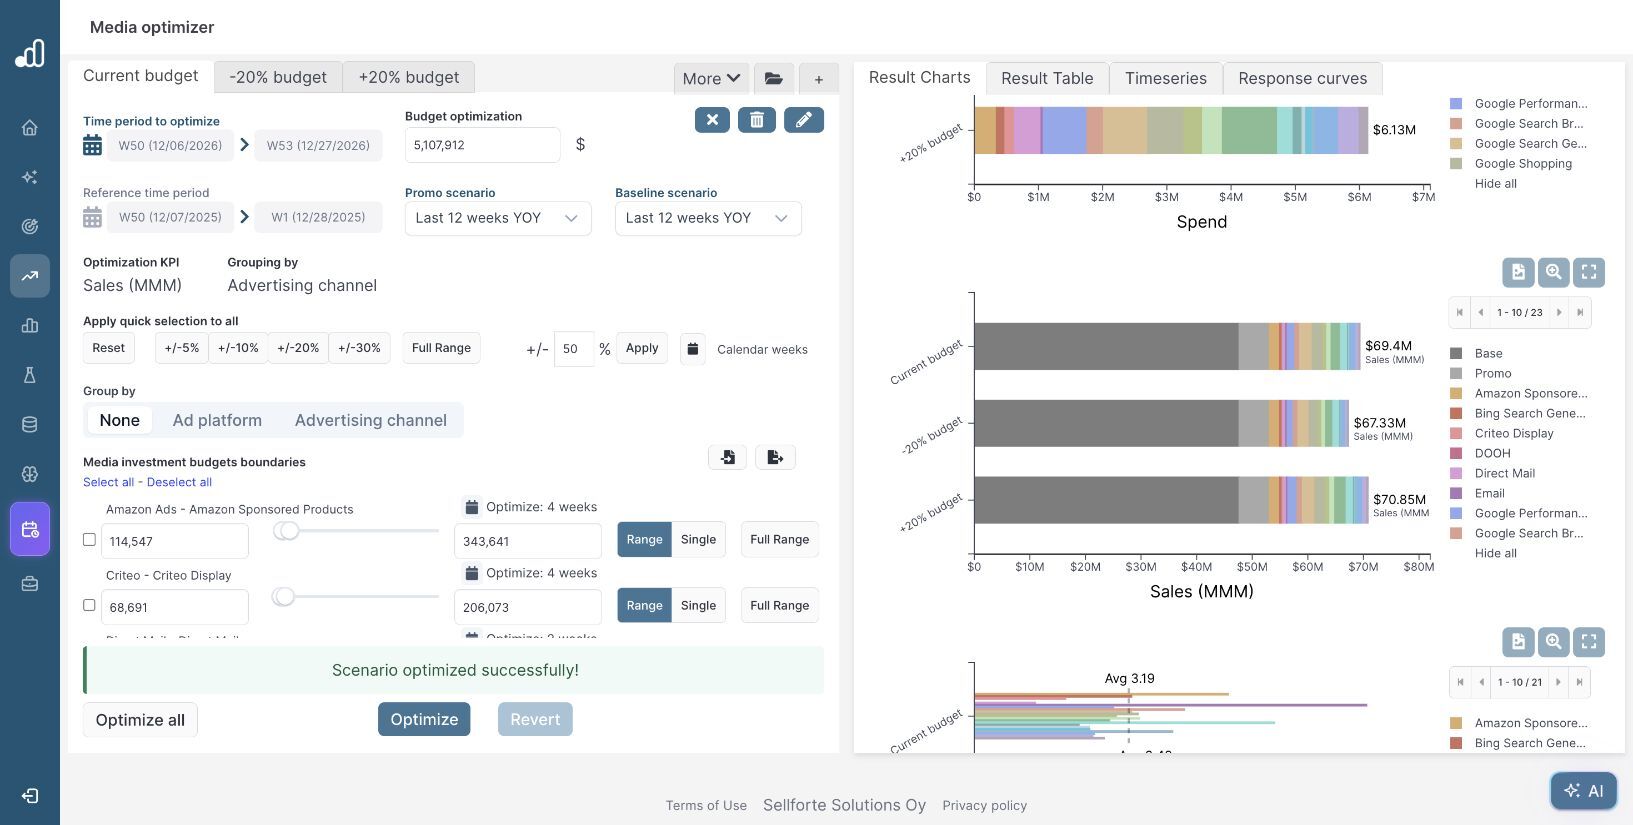
Open Planning → Media optimizer and create a scenario using Sales (MMM) and Budget optimization. Use Sellforte performance forecast, select the market and planning period, and group the budget boundaries by Advertising channel.
The demo plan has a total budget of $10,858,172. Set the paid channels to a range of roughly ±30% around their reference budgets, then set Google Search Brand to Single at $762,547. Keep Email fixed at $85,599 in both plans. The branded-search amount represents an internal commitment for this example; the same method can assess a contracted media placement or a channel minimum.
Keep the channel durations and other constraints unchanged. The example retains one active week for Direct Mail, two for DOOH and four for the other channels. Promo scenario and Baseline scenario both use Last 12 weeks YOY. Select Optimize.
2. Copy the plan and release only the commitment
Select +, choose Copy own scenario, and copy the locked plan. Name the second plan clearly, such as Brand commitment: flexible.
Change Google Search Brand from Single to Range, with a lower bound of $533,782 and an upper bound of $991,311. Leave the total budget, Email amount, all other channel boundaries, time periods and forecast assumptions unchanged. Optimize the copy.
This is a test of the particular commitment you released. If you also relaxed every other channel, the resulting improvement would combine several changes and would no longer isolate this commitment.
3. Compare the whole plan’s forecast
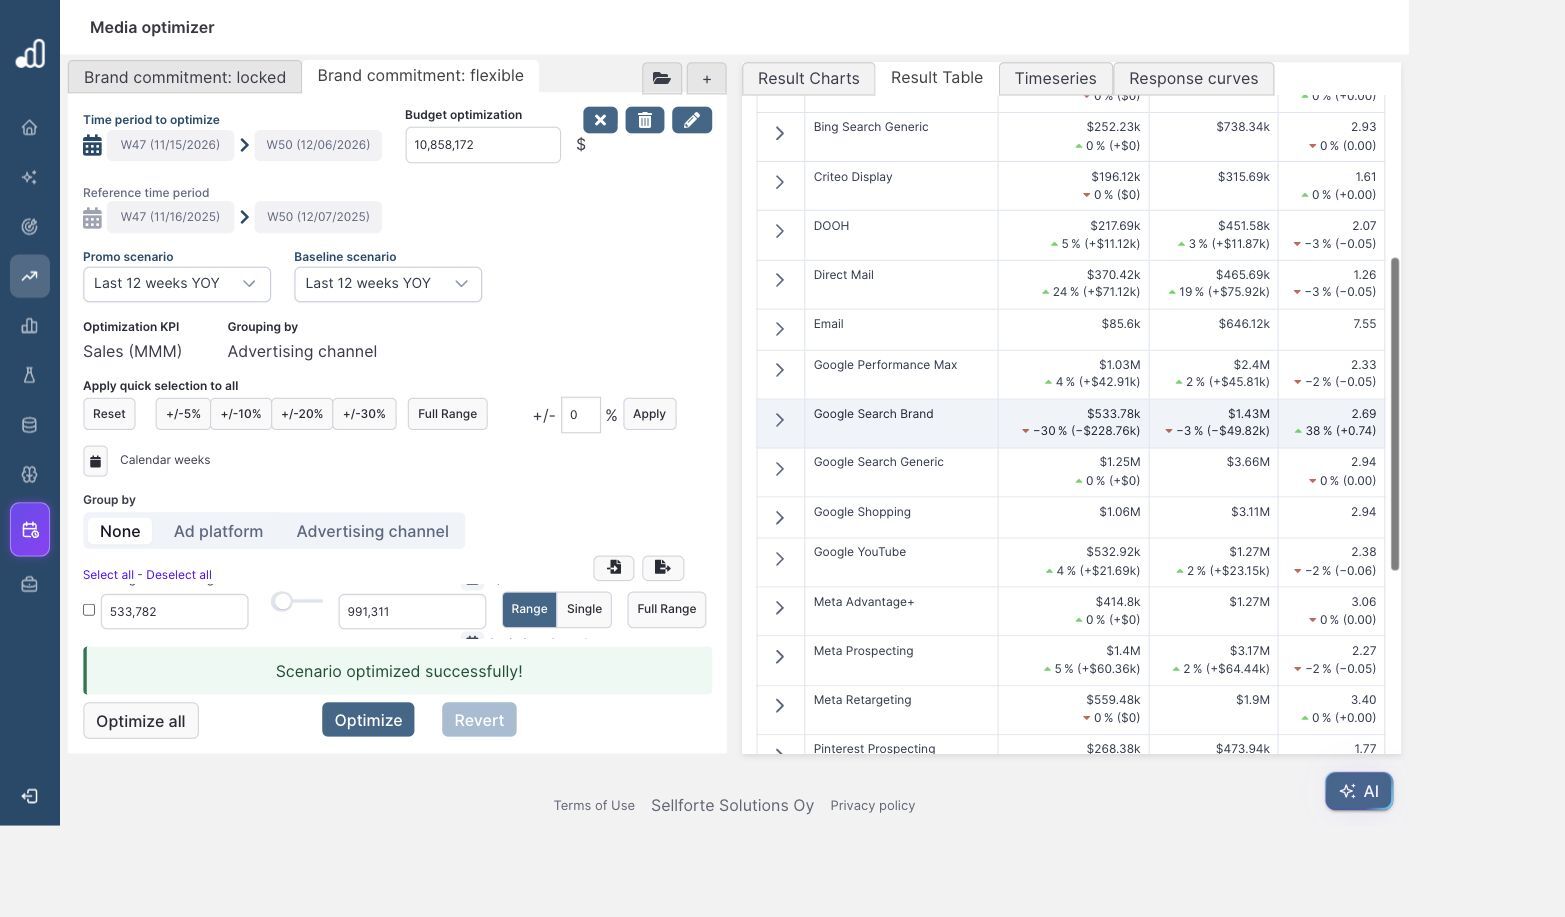
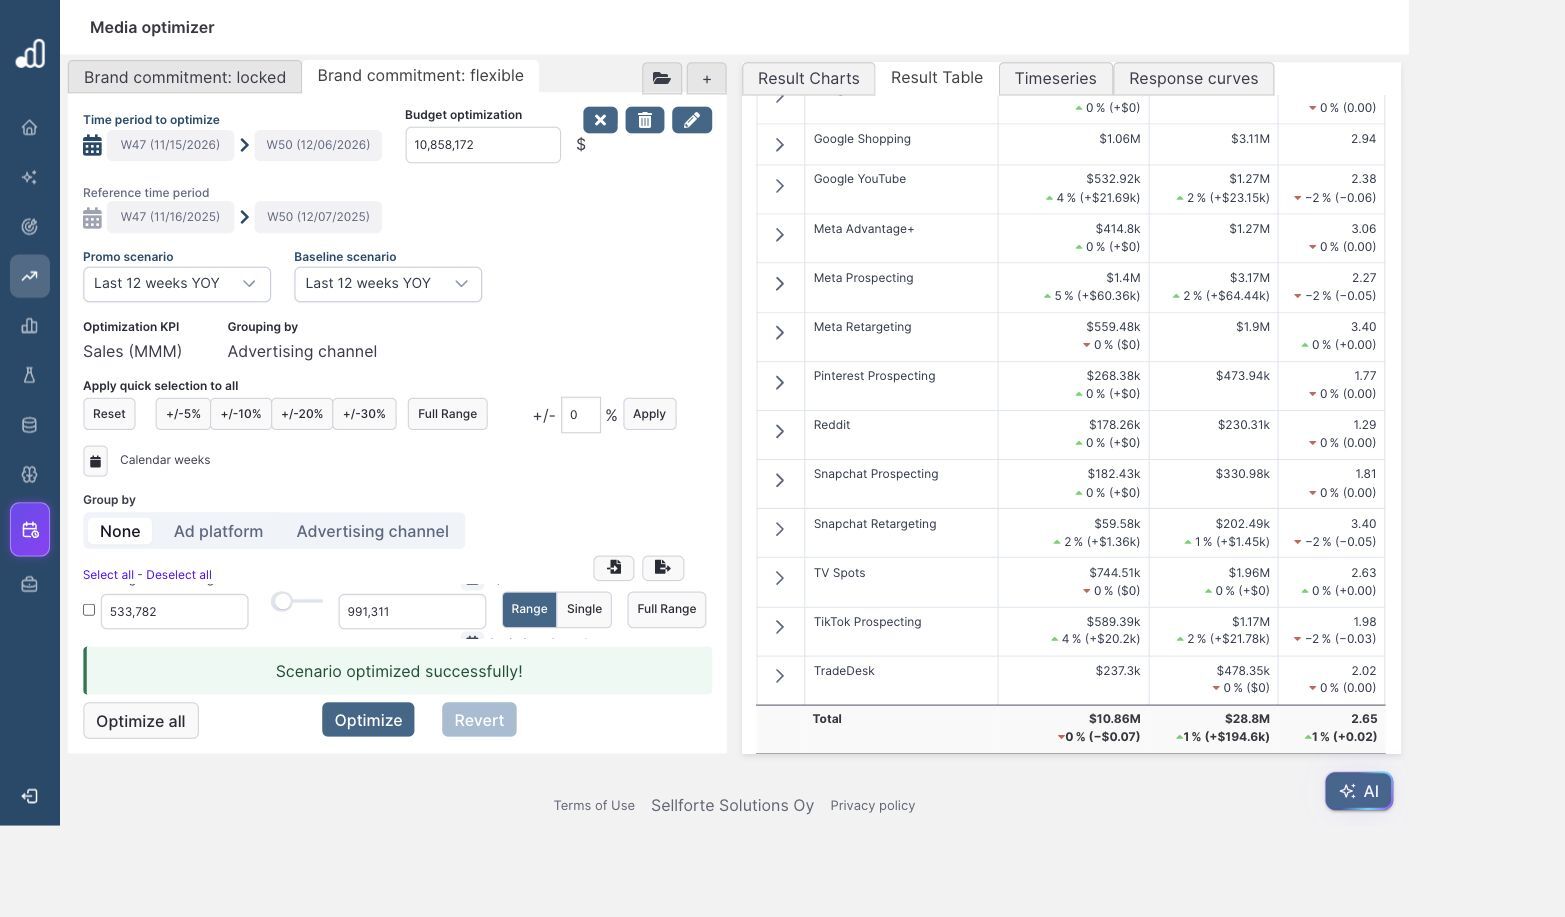
Open Result Table, select the flexible plan under Open scenario, and set Compare to scenario to the locked plan. Keep all media and sales segments selected. Read both the branded-search row and the total.
| Metric | Locked commitment | Flexible commitment |
|---|---|---|
| Total media investment | $10.86M | $10.86M |
| Google Search Brand investment | $762.55k | $533.78k |
| Forecast media sales (MMM) | $28.60M | $28.80M |
| Portfolio iROAS | 2.63 | 2.65 |
The flexible plan moves about $228,765 out of branded search and reallocates it across other channels. Branded search’s own forecast contribution falls, but the total portfolio contribution rises. The table reports the net sales difference as +$194.60k.
Use that displayed difference rather than subtracting the rounded $28.80M and $28.60M totals. The seven-cent difference in displayed investment is numerical optimization precision; both scenarios use the same $10,858,172 budget constraint.
4. Use the result when negotiating the commitment
The forecast puts a value on flexibility: under these assumptions, keeping the branded-search amount fixed costs about $194,600 in modeled sales over the four-week plan. Use that estimate when reviewing internal minimums, negotiating future commitments, or deciding which constraint to revisit first.
If changing a commitment incurs a fee, compare the fee with the expected additional contribution margin after relevant costs. Sales uplift alone is not a profit calculation. The guide to incremental margin shows how a margin-based view can change the assessment.
Before moving money, confirm that the receiving channels can deliver at the proposed levels. Inspect their marginal incremental ROAS and response curves, and keep genuine delivery limits in the optimizer. The benefit measured here applies to the tested range of flexibility, not an unlimited ability to move the entire commitment.
Further Reading and Resources
Set up the comparison
Evaluate the trade-off
About the author

Lauri Potka is the Chief Operating Officer at Sellforte, with over 15 years of experience in Marketing Mix Modeling, marketing measurement and media spend optimization. Before joining Sellforte, he worked as a management consultant at the Boston Consulting Group, advising some of the world’s largest advertisers on marketing optimization. Follow Lauri on LinkedIn.
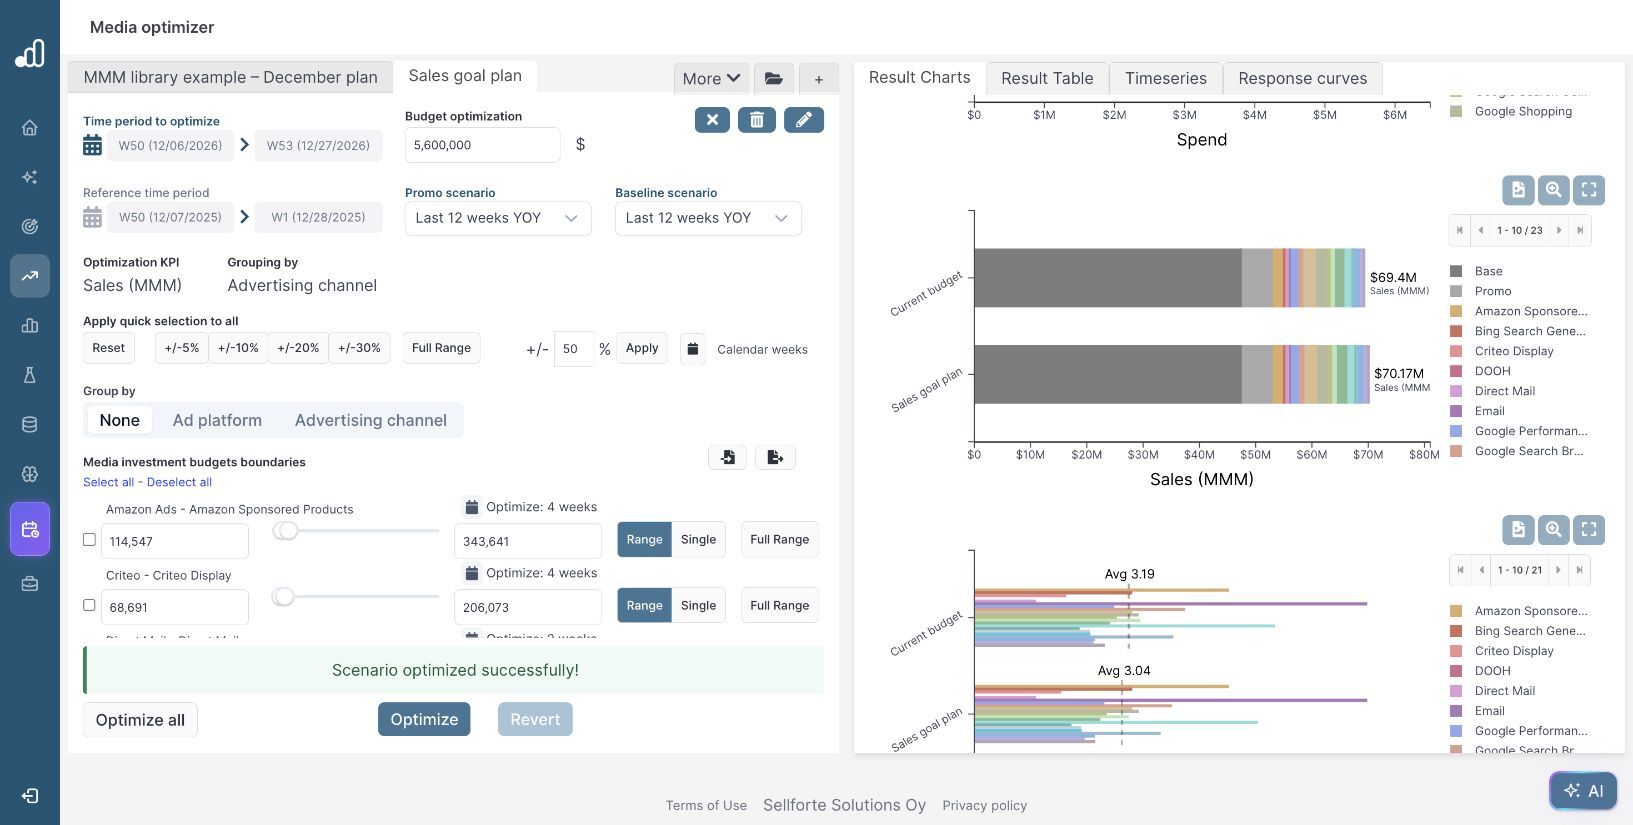
How to Find the Media Budget Needed for a Sales Target
How to Improve Results by Changing Weekly Budget Pacing