

MMM Use Case

To understand sales that arrive after advertising stops, compare the Spend and Sales (MMM) time-series charts for the same channel. Include several weeks after the final spending week. The sales chart shows when the modeled contribution materializes, including the delayed response to earlier advertising.
This example uses simulated data from the public Sellforte demo, with Country set to US and the displayed period W27 August 2 to W40 November 1, 2026.
Before you start: A channel or campaign with a clear pause in activity, plus a reporting window that includes the following weeks.
What you will produce: A view of the sales contribution after spending stops and a correctly timed read of campaign efficiency.
1. Isolate an advertising flight
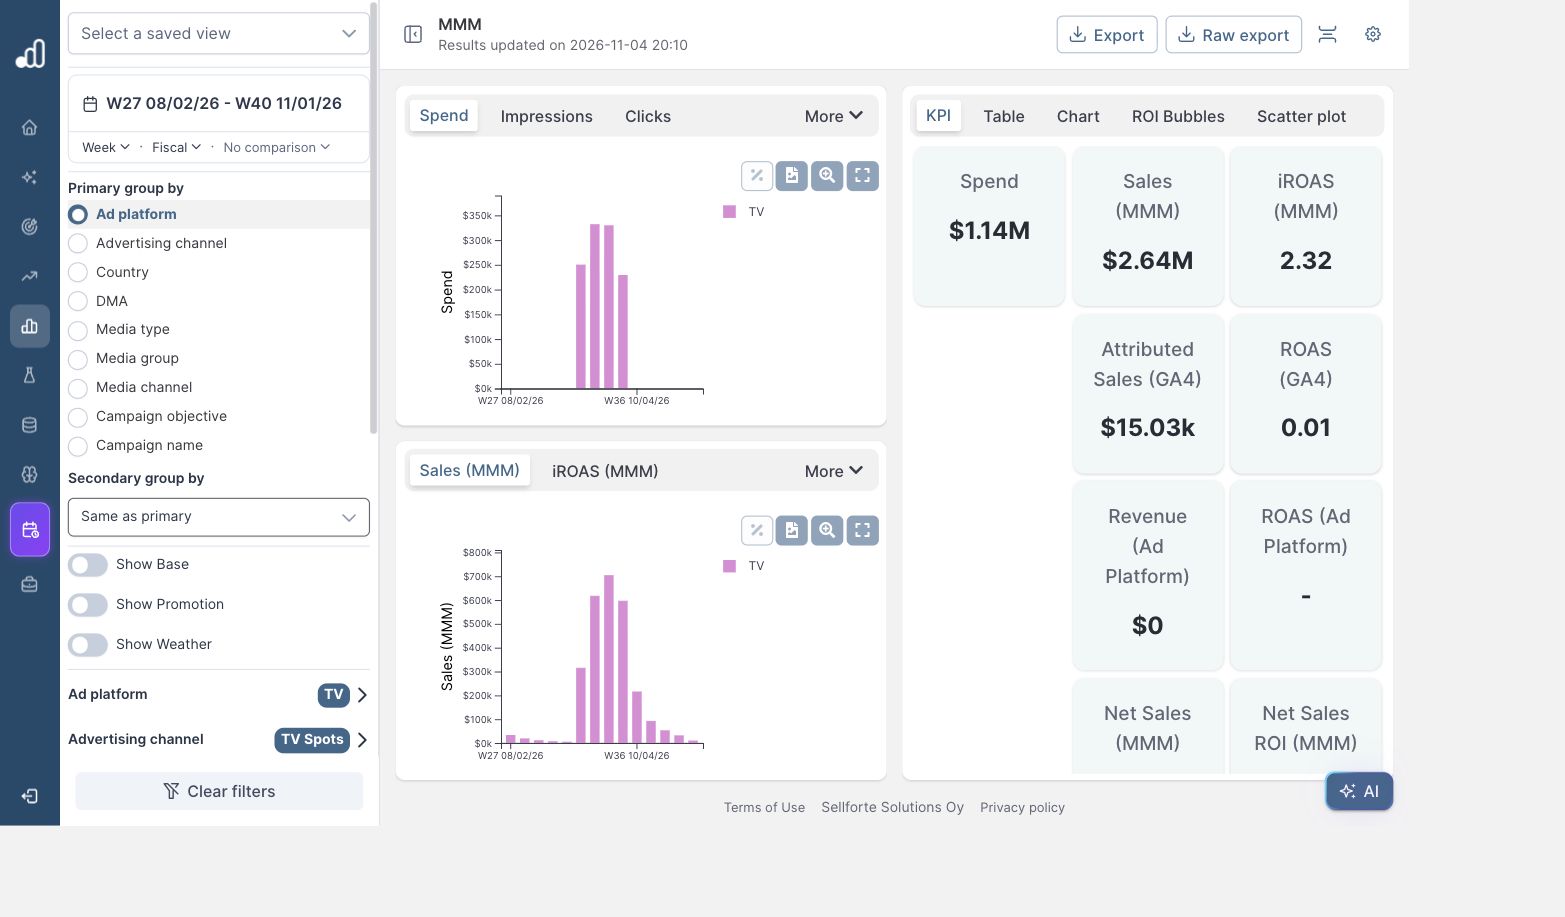
Open Dashboards → MMM. Select Ad platform as the primary grouping and filter Ad platform to TV. The Advertising channel filter becomes TV Spots. Keep the weekly view and all customer and sales-channel selections.
Turn off Show Base, Show Promotion and Show Weather so the sales chart focuses on the selected media contribution. Leave Spend selected in the upper chart and Sales (MMM) in the lower chart.
2. Follow the sales contribution beyond the spending period
TV investment appears in the weeks beginning September 6, 13, 20 and 27. The following October weeks have no TV spend, while the sales chart still shows a contribution.
Expand the Sales (MMM) chart and move over the weekly bars. The demo tooltips show the following amounts:
| Week beginning | TV spend | Sales (MMM), placed on sales dates |
|---|---|---|
| October 4, 2026 | $0 | About $214,060 |
| October 11, 2026 | $0 | About $90,750 |
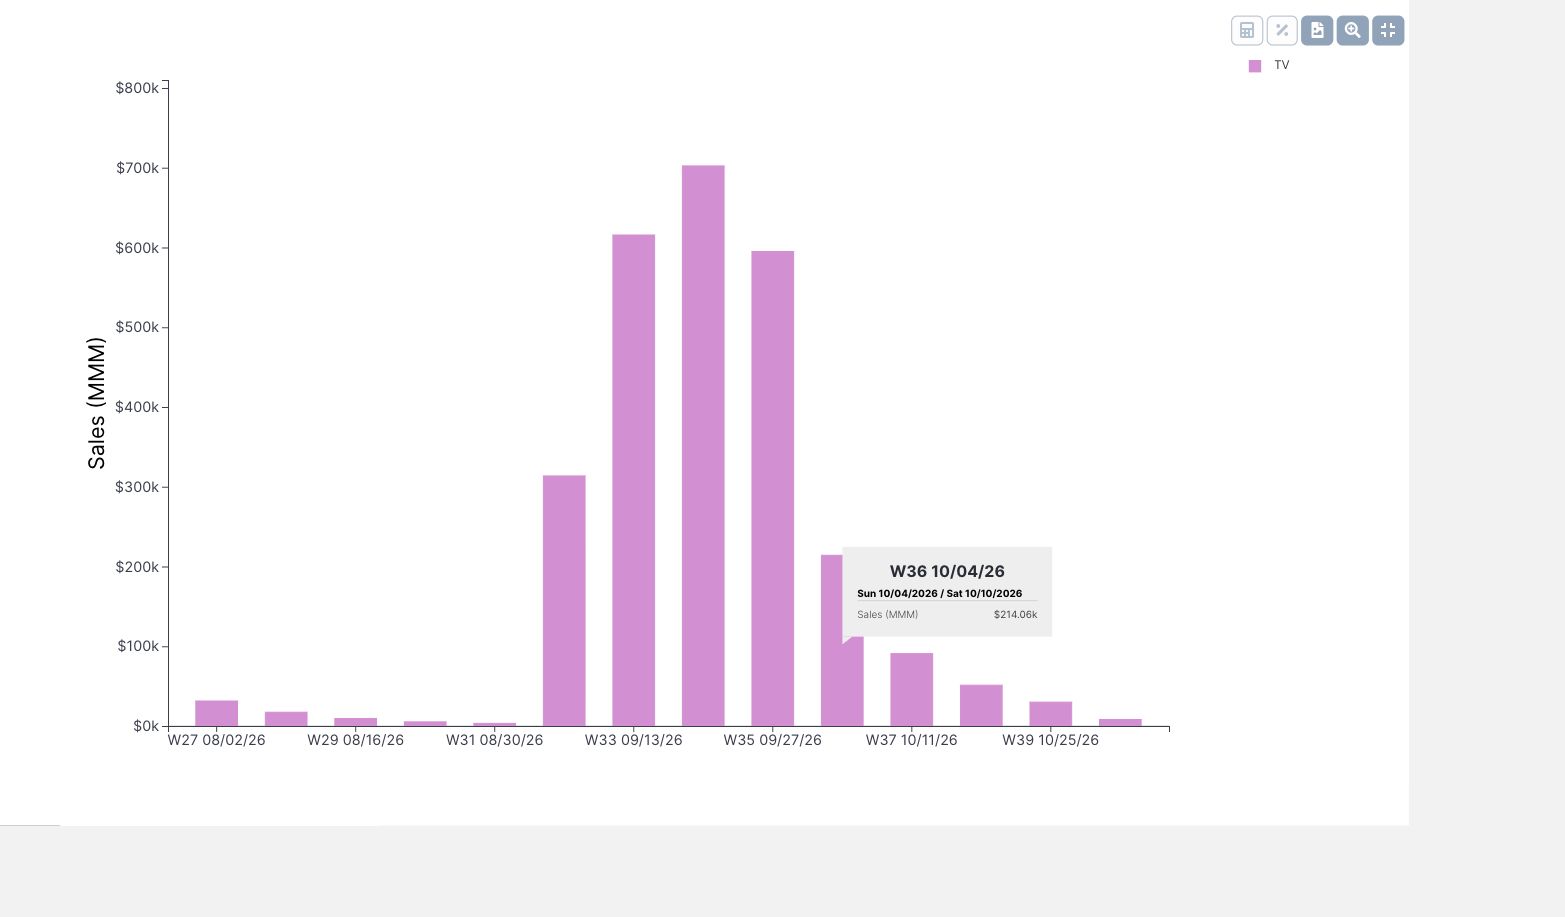
Those two weeks contain about $304,810 of modeled TV sales, based on the rounded tooltips. The following bars taper further. This is the carryover pattern the reader should inspect before closing a campaign review on its last spending day.
The small TV contributions before the September flight also matter: a reporting window can contain effects from advertising that ran before the window began. A channel-level chart can combine carryover from several flights. Use the Campaign name filter when you need to isolate a particular campaign and that breakdown is available.
3. Match the metric to the question
| Question | View to use |
|---|---|
| When did the modeled sales contribution occur? | Sales (MMM) time series, including the weeks after activity ends. |
| How efficient was the advertising bought during this period? | KPI or Table results that tie the sales contribution back to the activity that generated it. |
Sellforte’s dashboard guidance on carryover and backtracing explains this timing difference. The time series places sales on the dates they materialize. The KPI scorecard assigns the resulting contribution back to the marketing activity, aligning it with spend.
For the full selected window, the TV KPI cards show approximately $1.14M spend, $2.64M Sales (MMM) and 2.32 iROAS. Do not add the October sales tail to that KPI total: the two views place the contribution on different timelines. Adding them would count some contribution twice.
4. Use carryover in campaign evaluation and planning
Allow a post-campaign observation period when assessing a flight’s sales impact. The appropriate length depends on the channel’s modeled response; the two weeks shown here are an example, not a universal rule.
When planning the next flight, account for the contribution still arriving from earlier advertising. A sales decline after spend stops may be gradual, and the absence of new spend does not imply the absence of media-driven sales. Use the weekly budget-pacing workflow to compare alternative schedules with the model’s carryover included.
A week with no spend and positive carryover has no meaningful standalone spend-based ROAS. Assess the investment with its associated contribution, and use the calendar chart to understand when that contribution arrives.
Further Reading and Resources
Understand the timing
About the author

Lauri Potka is the Chief Operating Officer at Sellforte, with over 15 years of experience in Marketing Mix Modeling, marketing measurement and media spend optimization. Before joining Sellforte, he worked as a management consultant at the Boston Consulting Group, advising some of the world’s largest advertisers on marketing optimization. Follow Lauri on LinkedIn.


