MMM Use Case

A model that predicted sales well last month may become less accurate as new data arrives. Model History helps you check whether that is happening, which model versions are affected and whether the issue deserves a closer look before the next planning cycle.
This walkthrough uses Sellforte’s public Model History demo to compare out-of-sample prediction errors and follow one model through later evaluations.
Before you start: Open Model → History and choose a consistent time resolution, sample and business scope.
What you will produce: A view of whether prediction error is stable, where it has changed and which checks should follow.
1. Start with out-of-sample performance
Open Model → History → Fit. Set Time resolution to Day, Sample to Out-of-sample, Chart metric to MAPE and Show to Total. Keep all model versions selected initially.
Out-of-sample metrics evaluate predictions on observations excluded from the model’s fitting sample. MAPE summarizes absolute percentage prediction error; Bias adds information about systematic error. Read them together, with the evaluation period and business context.
The table separates Model version from Evaluated on. A row can evaluate an older model at a later date. The Backtest column identifies these evaluations, while Periods and Periods used show how many observations contribute to the reported metrics.
2. Compare recent versions without losing the evaluation context
| Model version | Evaluation date | Backtest | MAPE | Bias | Periods used |
|---|---|---|---|---|---|
| October 14, 2026 | October 14, 2026 | No | 3.5% | 1.4% | 182 |
| November 4, 2026 | November 4, 2026 | No | 4.4% | −0.4% | 183 |
| November 16, 2026 | November 16, 2026 | No | 4.5% | −0.4% | 183 |
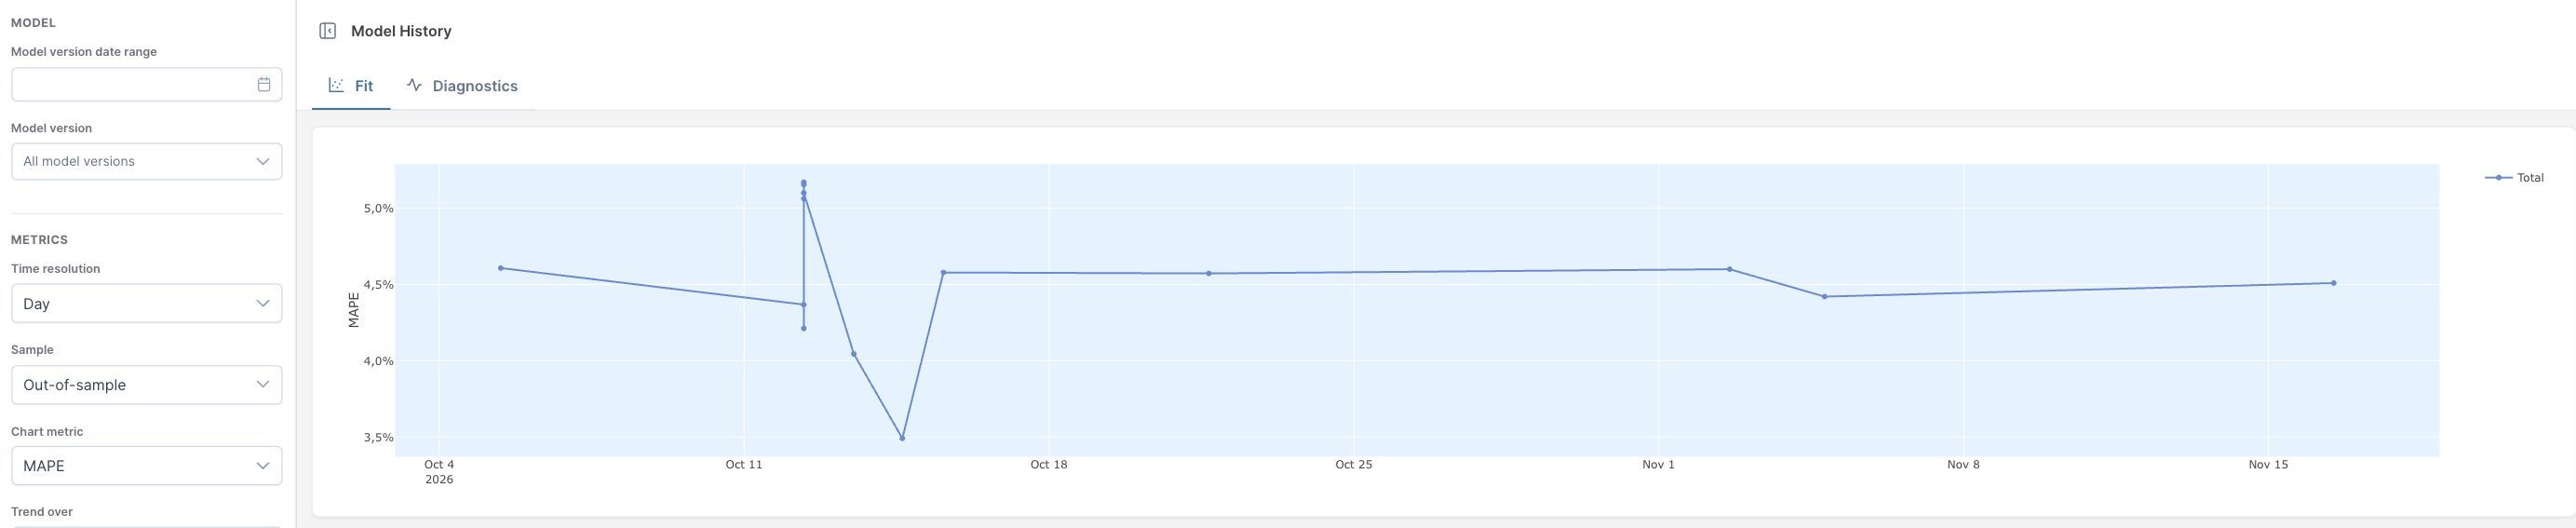
The latest version has 4.5% MAPE, compared with 4.4% for November 4. That is a 0.1 percentage-point difference. October 14 was lower at 3.5%, so looking only at the latest two versions would miss the earlier change.
These rows summarize different evaluations. Similar period counts do not establish identical held-out dates. Use the trend to identify a change worth investigating, then compare models on the same evaluation observations when deciding whether one version predicts better than another.
3. Follow a fixed model through later backtests
Set Model version to 10/12/2026 05:51:01 and switch Trend over to Evaluations. This holds the model version fixed while showing its results at successive evaluation dates.
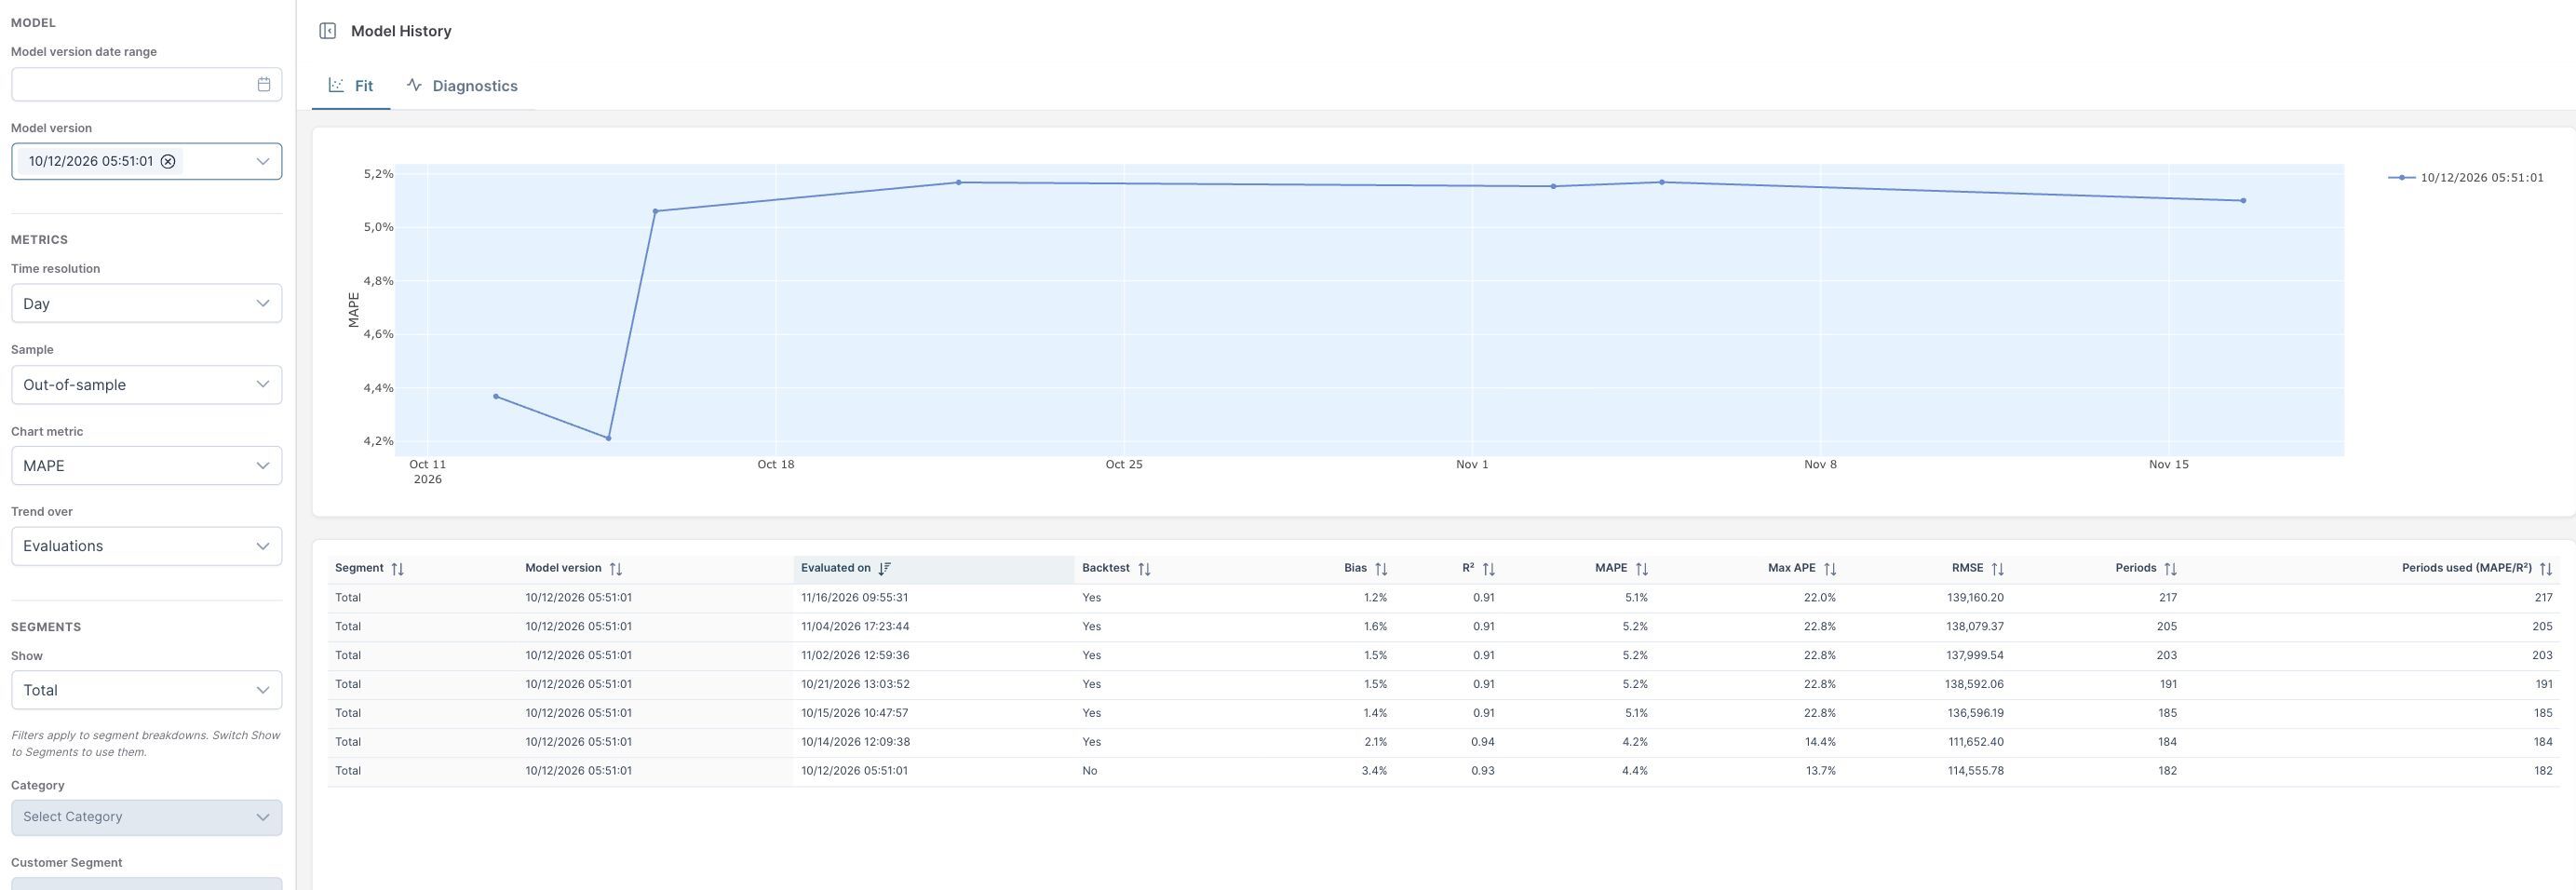
The October 12 model shows 4.2% MAPE in its October 14 backtest and 5.1% in its November 16 backtest. The number of periods used grows from 184 to 217. Its more recent backtests sit around 5.1%–5.2%, rather than returning to the earlier lower error.
On November 16, the latest model reports 4.5% MAPE, while this older model’s backtest reports 5.1%. The two rows use 183 and 217 periods respectively. That is a useful investigation signal, but the different evaluation sets prevent treating the 0.6-point gap as a controlled improvement from updating the model.
4. Investigate the source of a persistent change
If error stays elevated, switch Show to Segments and narrow the location, customer segment or sales channel. Then use the model-fit view to inspect actual versus modeled sales in the affected segment.
Check whether the change coincides with missing sales or spend data, revised revenue definitions, an unusual promotion, a stock constraint or a shift in demand. Compare daily and weekly views when daily volatility may be driving the error. A consistent bias or a recurring missed sales peak deserves a different response from one isolated unusual day.
For this example, the practical follow-up is to inspect what changed in the evaluation observations after mid-October and check the affected segments before relying on the earlier 3.5% MAPE as the current accuracy benchmark.
Predictive accuracy is one part of model validation. Continue to review the experiments informing the MMM when assessing channel incrementality: accurately predicting total sales does not, by itself, validate every channel’s causal contribution.
Further Reading and Resources
About the author

Lauri Potka is the Chief Operating Officer at Sellforte, with over 15 years of experience in Marketing Mix Modeling, marketing measurement and media spend optimization. Before joining Sellforte, he worked as a management consultant at the Boston Consulting Group, advising some of the world’s largest advertisers on marketing optimization. Follow Lauri on LinkedIn.

How Do You Check Which Experiments Inform Your MMM?
How Do You Find a Media Budget That Meets Your ROI Requirement?