MMM Use Case

To check model fit for the markets you plan in, open Model → Validation, compare the segment-level error metrics, and inspect the actual and modeled sales lines for any segment that needs attention. This helps you identify persistent errors that an overall business average can hide.
The worked example uses simulated data from the public Sellforte demo. Select model_2026-11-04, Country US, the displayed period W27 August 2 to W40 November 1, 2026, and weekly aggregation. The demo labels the metrics and prediction line Out-of-sample.
Before you start: A model version with validation results and a segment definition matching the planning decision.
What you will produce: A comparison of prediction errors and a specific segment to investigate before relying on its forecasts.
1. Read the summary at the level of your decision
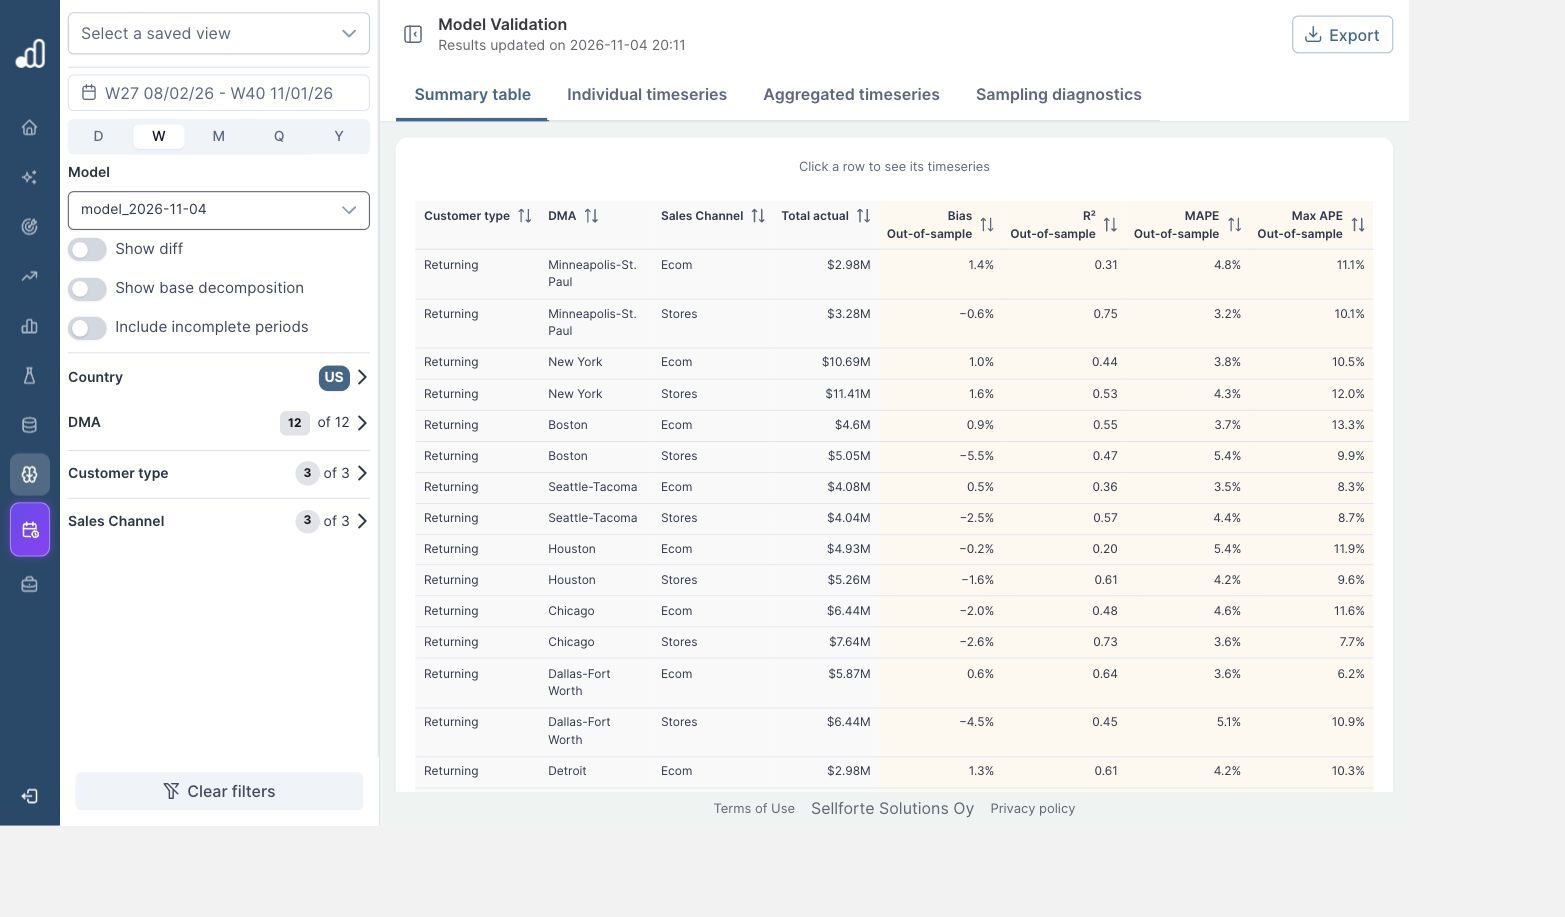
Open Summary table. The demo breaks results down by Customer type, DMA and Sales Channel. Each row therefore represents a particular business segment, such as returning customers buying in Boston stores.
Keep the same model, date range and time aggregation when comparing rows. Changing any of these can change the error metrics. For a regional budget review, inspect the relevant regional segments as well as the total sales pattern.
2. Compare average error with persistent bias
| Segment: Returning customers | Total actual sales | Bias | R² | MAPE | Max APE |
|---|---|---|---|---|---|
| Detroit · Stores | $3.24M | −0.2% | 0.91 | 2.6% | 5.3% |
| Boston · Stores | $5.05M | −5.5% | 0.47 | 5.4% | 9.9% |
| New York · Ecom | $10.69M | 1.0% | 0.44 | 3.8% | 10.5% |
Detroit Stores has relatively small errors in this comparison. Boston Stores has a larger average error and a negative bias. That combination points to a segment worth opening: the model may be consistently below actual sales rather than missing equally in both directions.
MAPE describes the average size of percentage errors; Bias describes their direction; Max APE identifies the largest percentage miss in the selected periods. R² describes how well the predictions track variation relative to a mean-sales benchmark. Read these together. New York Ecom’s 3.8% MAPE and 0.44 R² show why one number cannot describe every aspect of fit.
3. Open the segment’s actual-versus-predicted chart
Click the Returning · Boston · Stores row. Sellforte opens Individual timeseries with that segment selected. Compare the Actual and Out-of-sample lines through the weeks.
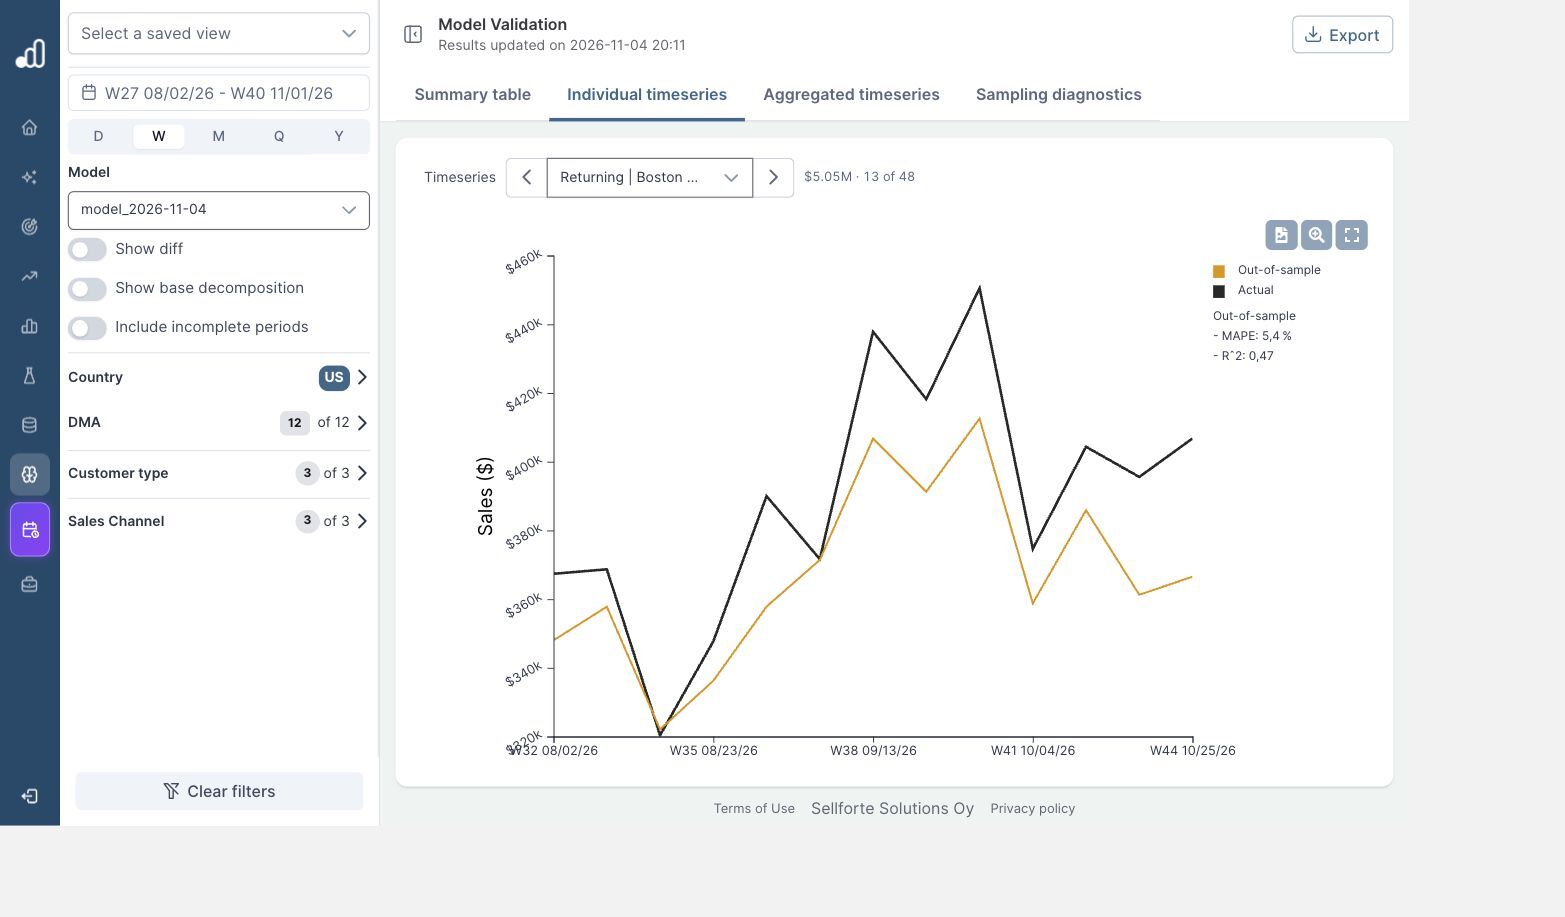
The chart gives the bias a practical meaning: the prediction follows much of the pattern but repeatedly falls short of the actual sales level. Check whether the gap begins around a change in trading conditions, a promotion, or a data issue before treating it as an isolated bad week.
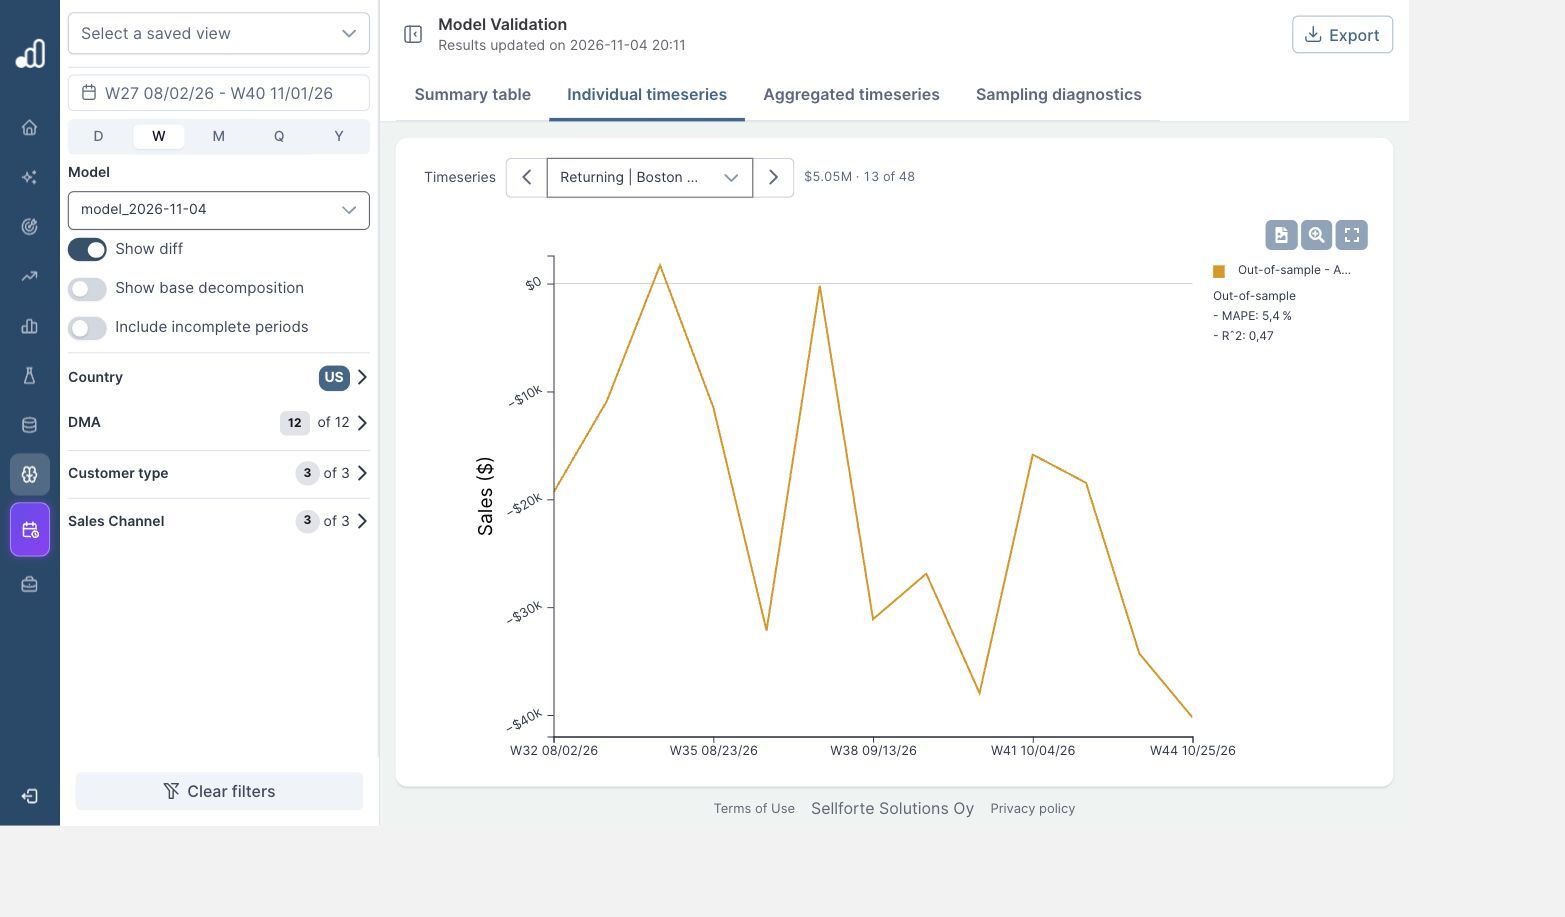
Enable Show diff to view predicted minus actual sales. A run of errors on one side of zero is easier to see here than in two overlapping lines. Use Aggregated timeseries to compare the combined sales pattern across the selected segments.
4. Decide what needs investigation before changing budgets
For Boston Stores, investigate the persistent shortfall with the modeling team. Review the underlying sales data and relevant business changes, then check whether the explanation also appears in other customer or sales-channel segments. A daily view can help locate an unusual date; weekly or monthly results are usually more useful for the planning decision.
Prediction quality and channel incrementality answer different questions. A close match to total sales does not by itself establish that every channel’s contribution is correct. For a substantial channel reallocation, also review relevant incrementality-test evidence and the broader model-validation checks.
Use the fit review to focus investigation where it matters. A weak result in one small segment should not automatically invalidate the full model, while a good aggregate result should not conceal a recurring error in a market receiving a significant budget.
Further Reading and Resources
Read the model results
Connect fit with decisions
About the author

Lauri Potka is the Chief Operating Officer at Sellforte, with over 15 years of experience in Marketing Mix Modeling, marketing measurement and media spend optimization. Before joining Sellforte, he worked as a management consultant at the Boston Consulting Group, advising some of the world’s largest advertisers on marketing optimization. Follow Lauri on LinkedIn.
How to Compare MMM Results with Platform ROAS
How to Understand Sales That Arrive After a Campaign Ends