

MMM Use Case

To compare campaign objectives by incremental sales, choose Campaign objective as the primary grouping in Dashboards → MMM, then filter to one ad platform. Compare each objective’s spend, modeled sales and iROAS. Add an advertising-channel breakdown to see which activities sit behind the averages.
This example uses simulated data from the public Sellforte demo, with Country set to US and the displayed period W27 August 2 to W40 November 1, 2026.
Before you start: MMM results with campaign objectives mapped into a consistent reporting dimension.
What you will produce: An objective-level performance comparison and a breakdown of the campaigns’ channel roles.
1. Keep the platform and reporting scope consistent
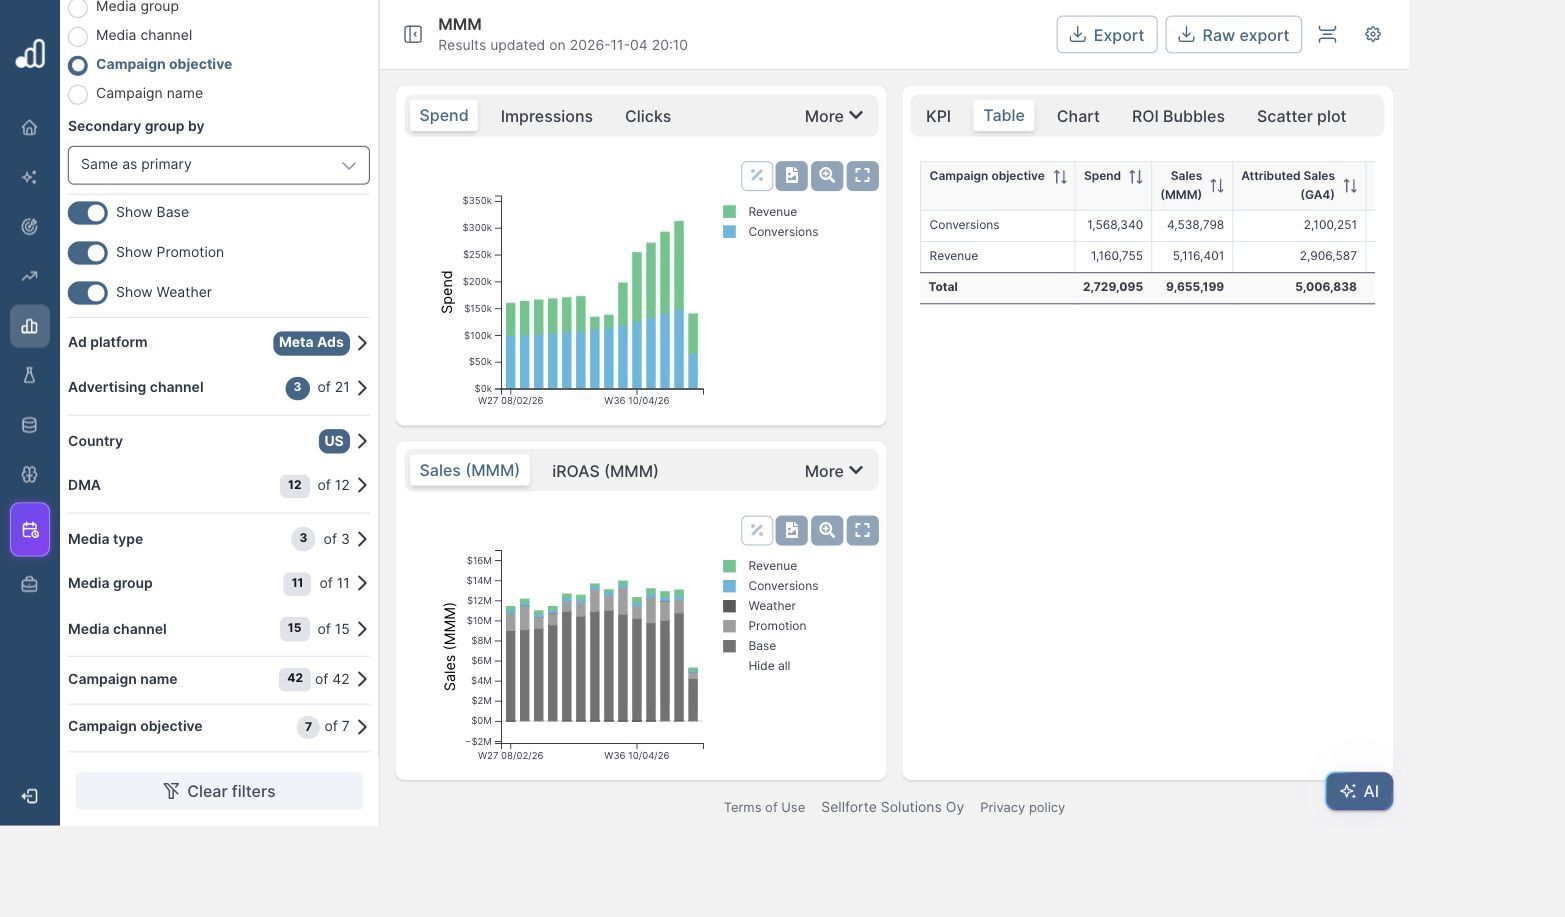
Open the MMM dashboard and select Campaign objective under Primary group by. In the Ad platform filter, deselect the full selection and choose Meta Ads. Open Table.
Leave the customer-type and sales-channel filters on their full selections. The example compares the contribution to all modeled sales in the selected market. Using the same period and scope lets you compare the objective groups on the same basis.
Sellforte standardizes platform objectives into categories such as Revenue, Conversions, Clicks and Reach. The campaign-objective mapping guide explains those categories. Only Conversions and Revenue have results in this Meta selection.
2. Compare contribution and efficiency together
| Campaign objective | Spend | Sales (MMM) | iROAS |
|---|---|---|---|
| Conversions | $1,568,340 | $4,538,798 | 2.89 |
| Revenue | $1,160,755 | $5,116,401 | 4.41 |
| Meta total | $2,729,095 | $9,655,199 | 3.54 |
The Revenue group contributes about $5.12M in modeled incremental sales on $1.16M of spend. Conversions contributes $4.54M on $1.57M. The platform average of 3.54 iROAS hides those different results.
For Revenue, the calculation is $5,116,401 ÷ $1,160,755 ≈ 4.41. Use summed sales divided by summed spend for the platform total; averaging the two iROAS values would give the groups equal weight despite their different budgets.
3. See which channels make up each objective
Set Secondary group by to Advertising channel. In the table, choose Both under Table group by. This displays the objective and channel together.
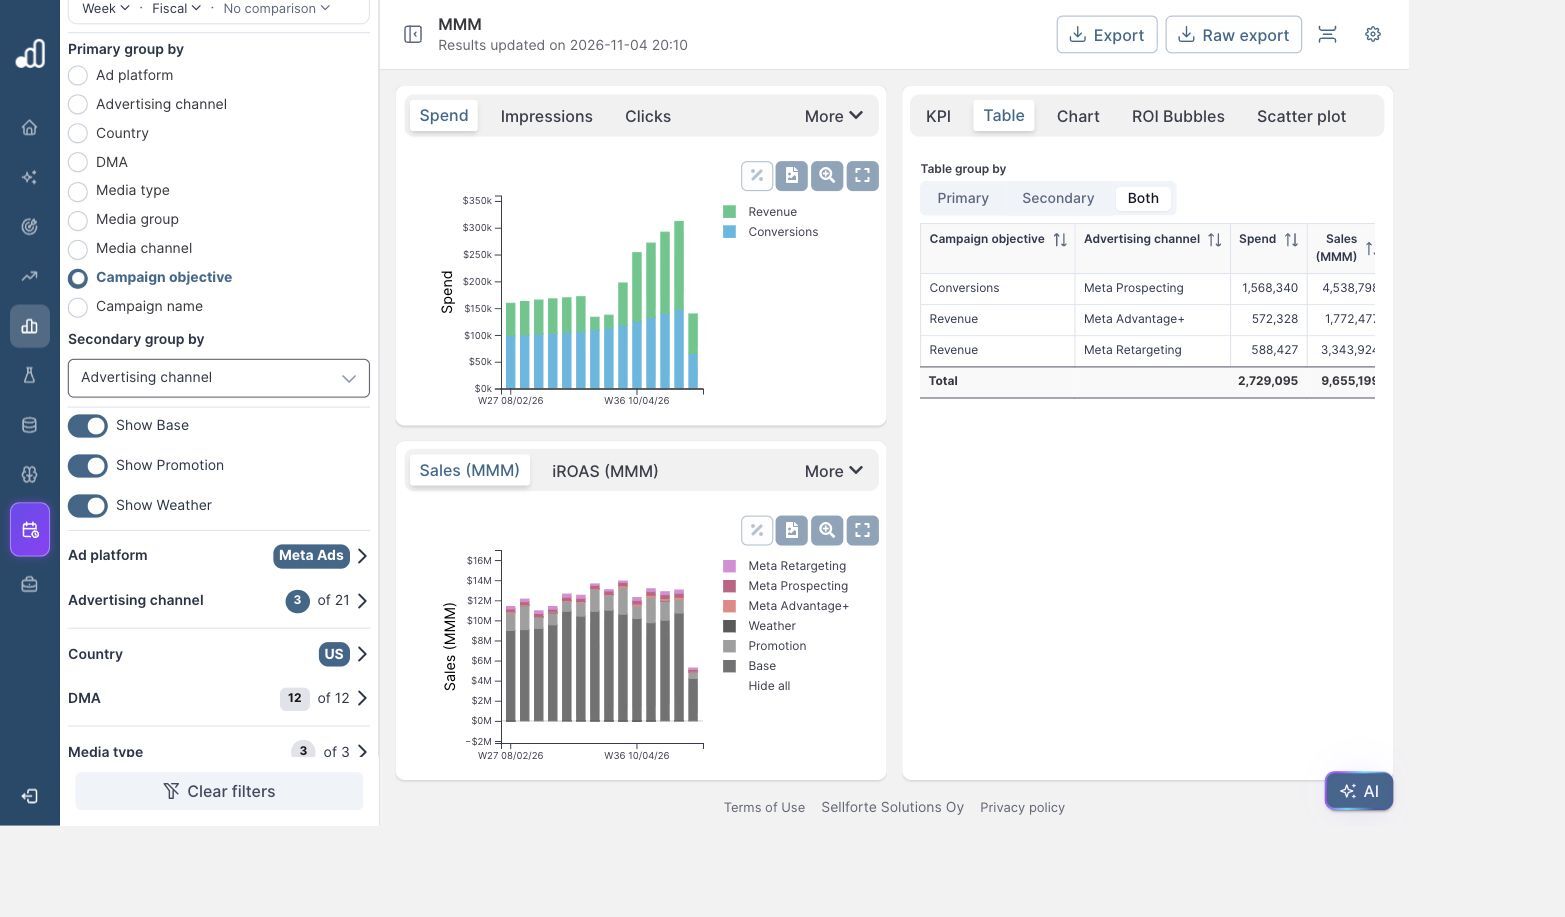
| Objective | Advertising channel | Spend | Sales (MMM) | iROAS |
|---|---|---|---|---|
| Conversions | Meta Prospecting | $1,568,340 | $4,538,798 | 2.89 |
| Revenue | Meta Advantage+ | $572,328 | $1,772,477 | 3.10 |
| Revenue | Meta Retargeting | $588,427 | $3,343,924 | 5.68 |
The entire Conversions row comes from Meta Prospecting. Revenue combines Advantage+ and Retargeting, with Retargeting producing the higher return. The objective comparison therefore also reflects different audiences and channel roles. It does not measure what would happen if the same prospecting campaign changed its optimization objective.
4. Use the breakdown to choose the next optimization
Use this view when reviewing whether budget is concentrated in objective groups that deliver the business outcome you need. In the demo, the Revenue result makes its contributing campaigns worth a closer look. The channel breakdown narrows that review to Retargeting and Advantage+ rather than treating every Revenue campaign as equally efficient.
If acquisition is the priority, also compare new-customer sales contribution or customer lifetime value. A group that reaches existing customers can have strong immediate iROAS while serving a different purpose from prospecting.
For a budget move, inspect the expected additional return at the proposed spend. For a change of campaign objective, compare campaigns with similar audiences and offers, or test the change directly. This keeps the decision tied to the particular activity you can change.
Further Reading and Resources
Understand the comparison
About the author

Lauri Potka is the Chief Operating Officer at Sellforte, with over 15 years of experience in Marketing Mix Modeling, marketing measurement and media spend optimization. Before joining Sellforte, he worked as a management consultant at the Boston Consulting Group, advising some of the world’s largest advertisers on marketing optimization. Follow Lauri on LinkedIn.


