MMM Use Case

To compare channels by customer lifetime value in Sellforte, open Dashboards → MMM and read New Customer CLV (MMM) alongside immediate sales and spend. The comparison shows which channels create the most modeled customer value, how efficiently they do it, and whether the ranking changes when you include that value.
This walkthrough uses simulated data from the public Sellforte demo, captured on November 15, 2026. The selected US period is W27 August 2–W40 November 1, 2026.
Before you start: A model with customer lifetime value metrics configured, and an agreed CLV definition and time horizon.
What you will produce: A channel comparison of immediate sales, new-customer lifetime value and combined return.
1. Keep the scope consistent
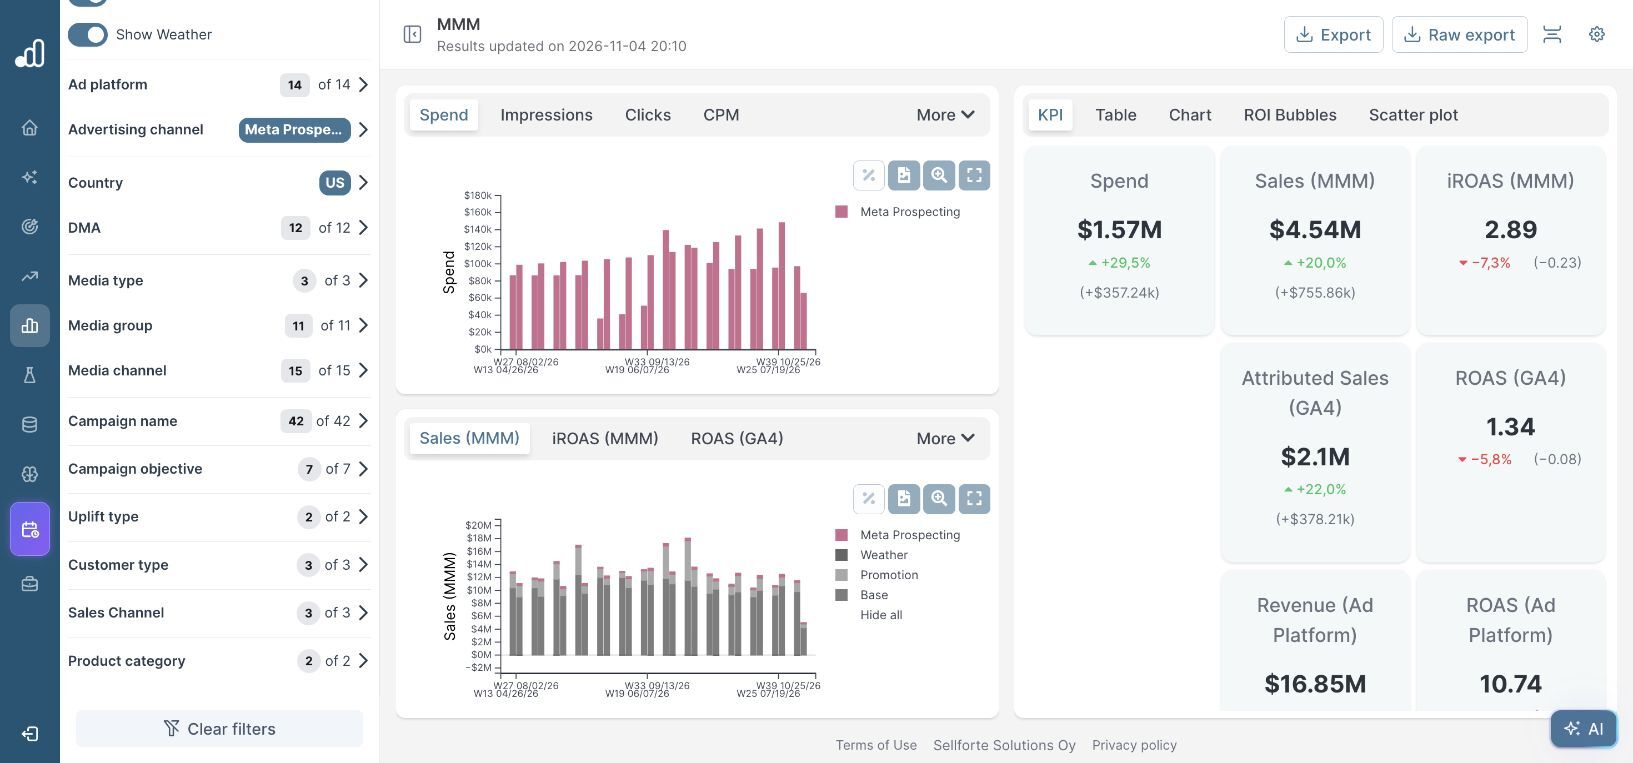
Open MMM, choose the period and market, and set Primary group by → Advertising channel. For this example, keep Country set to US and leave the other dashboard filters at their full selections.
Use the same dates and filters throughout. The acquisition period tells you when the customers were generated; their lifetime value can extend beyond that period. It should not be described as sales already collected during those weeks.
2. Find the lifetime value metrics
Open KPI and scroll down to the CLV cards. For channel-level results, switch to Table and scroll horizontally to the CLV columns.
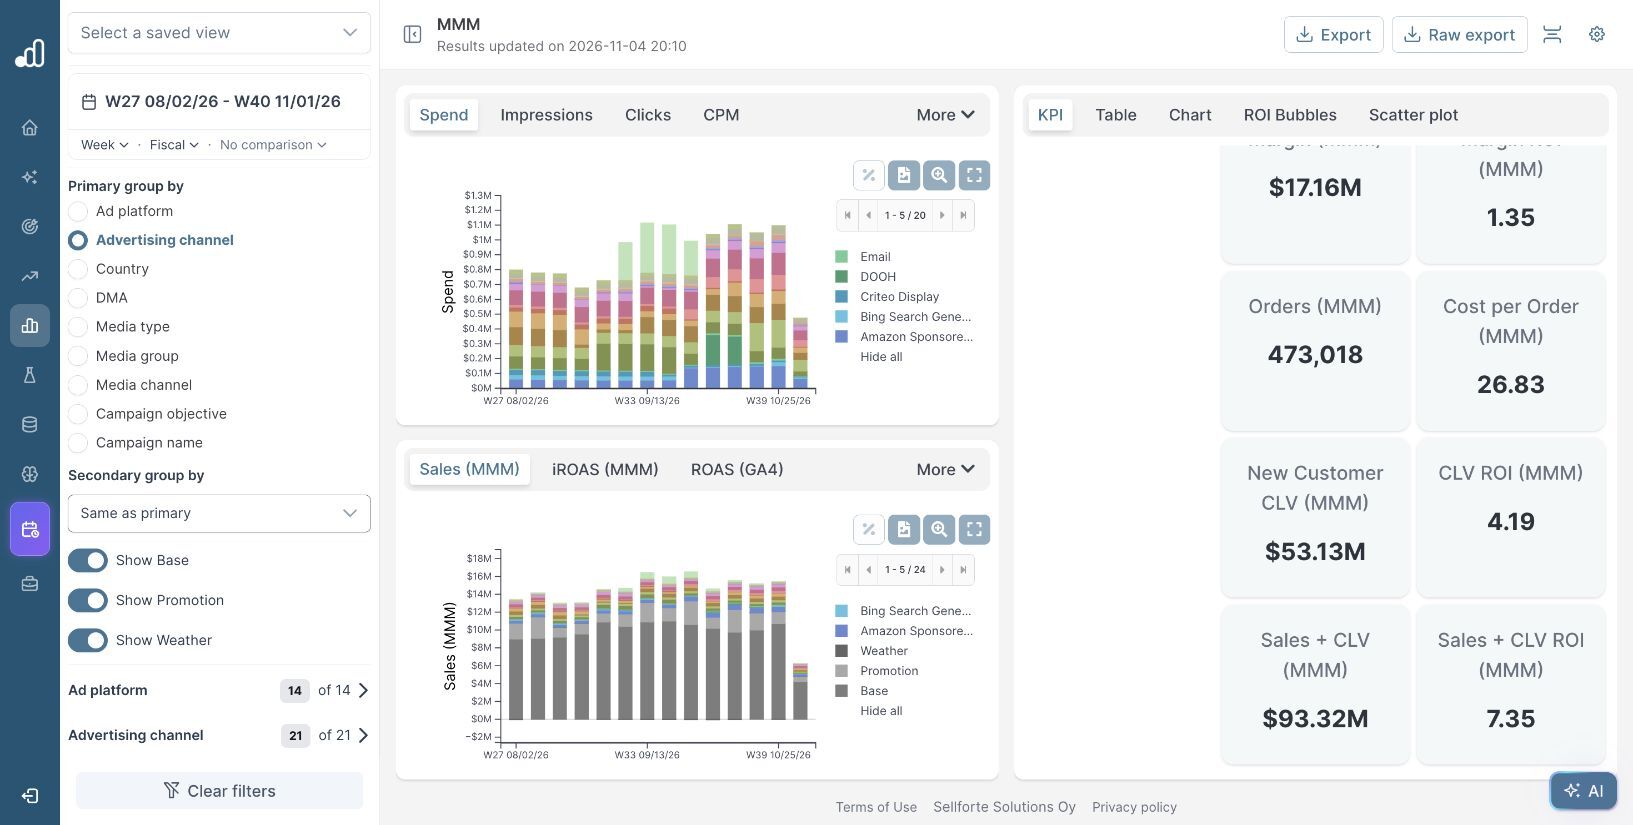
| Metric | How to use it |
|---|---|
| New Customer CLV (MMM) | Compare the modeled lifetime value generated through new customers. This is an absolute contribution. |
| CLV ROI (MMM) | Divide the modeled new-customer value by media spend to compare value per dollar. |
| Sales + CLV (MMM) | Read the configured combined measure of immediate sales and customer value. |
| Sales + CLV ROI (MMM) | Compare that combined measure per dollar of spend. |
Use the configured Sales + CLV measure when comparing combined value. If you build the calculation outside Sellforte, align the revenue or margin basis and check which purchases are included in CLV so the initial purchase is not counted twice.
3. Compare prospecting with retargeting
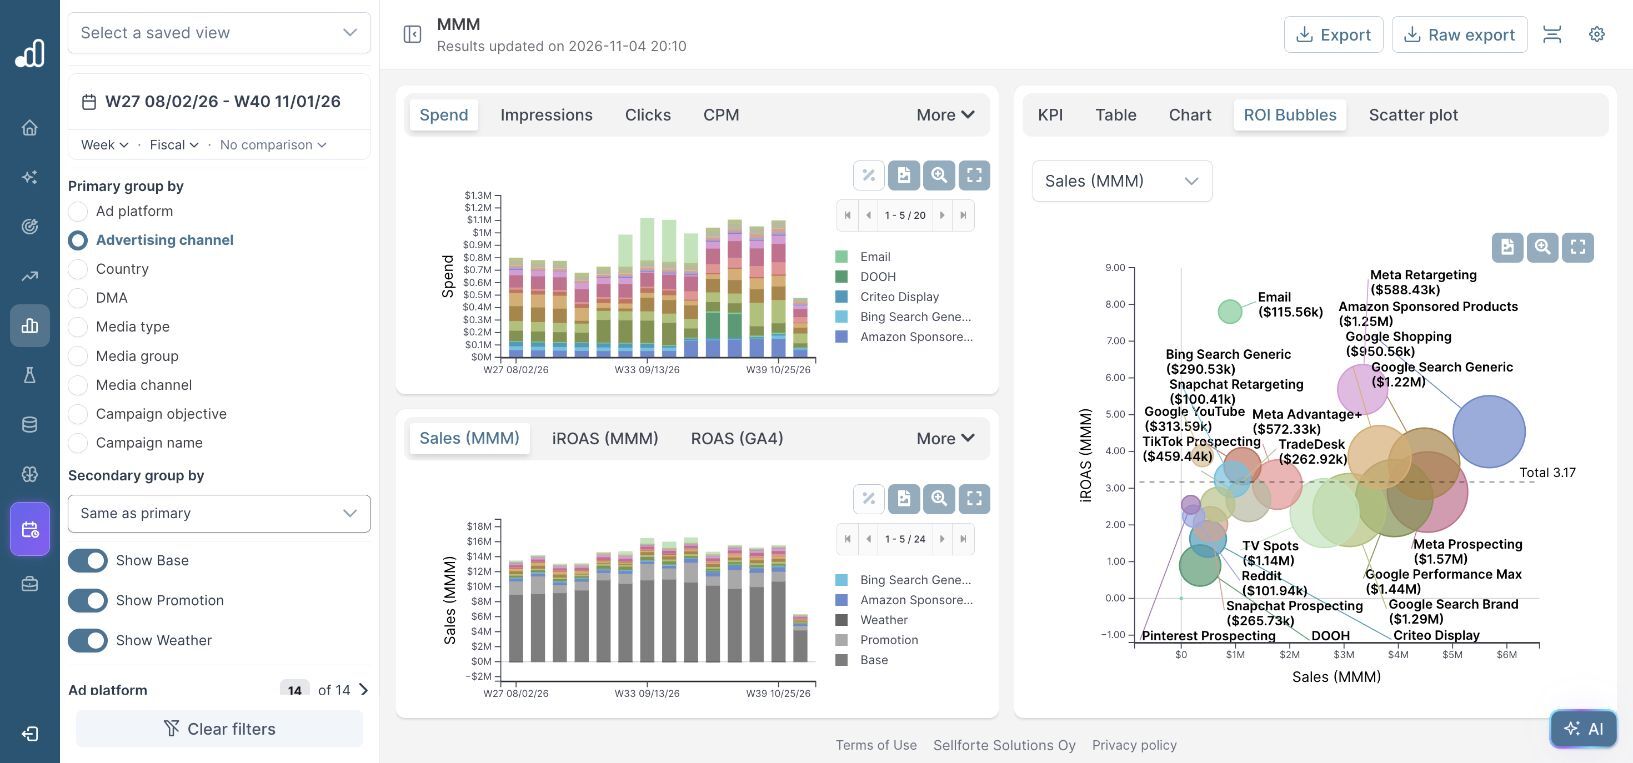
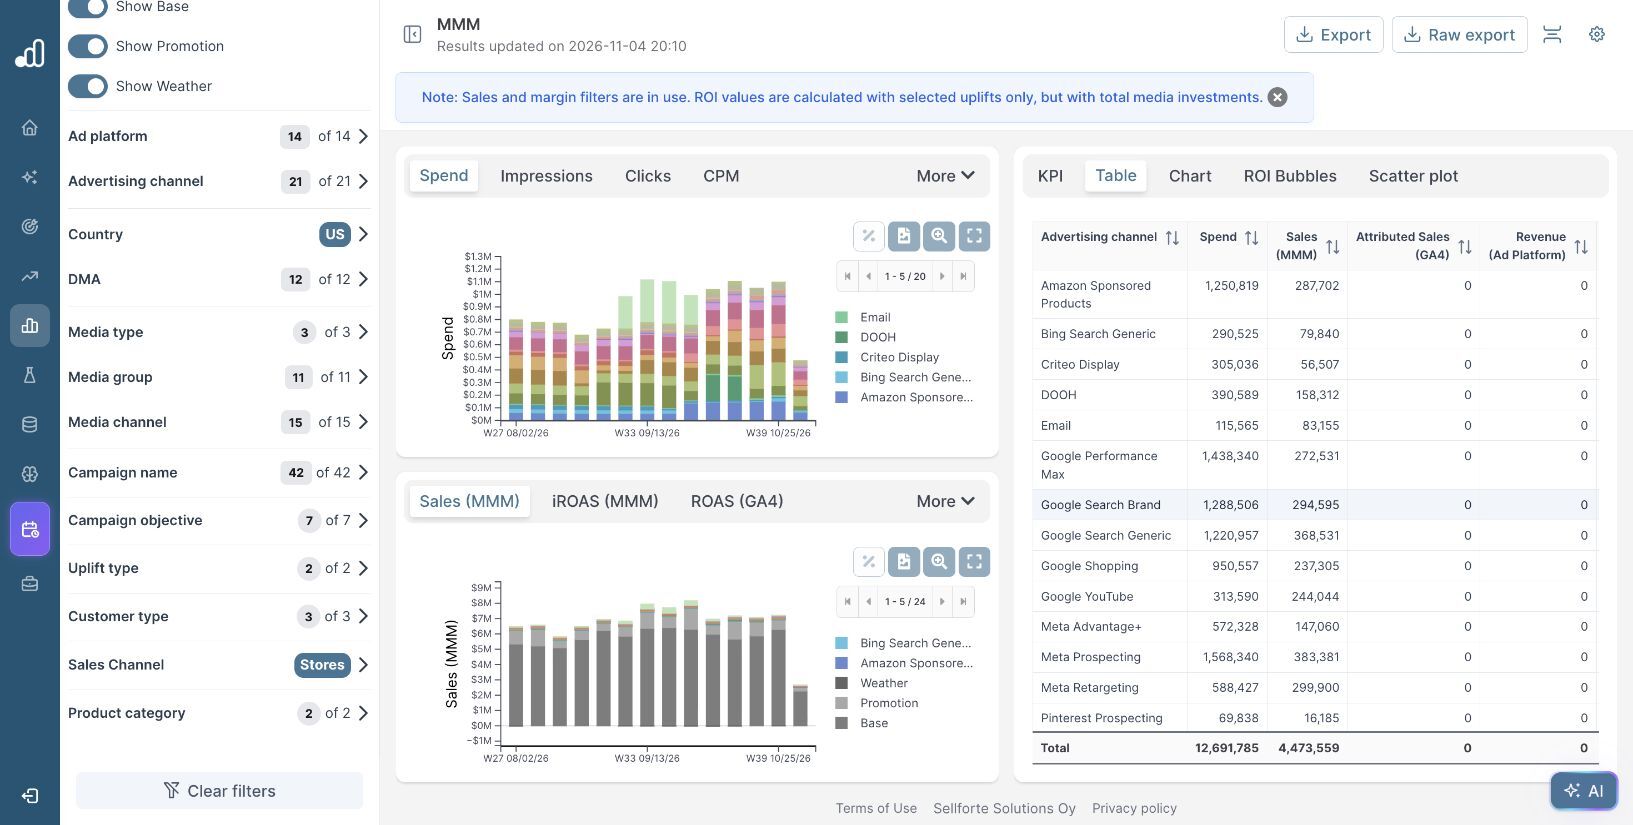
Read the Meta Prospecting and Meta Retargeting rows in the same Table view. They provide a clear example of why immediate iROAS and customer value answer different questions.
| Metric | Meta Prospecting | Meta Retargeting |
|---|---|---|
| Spend | $1,568,340 | $588,427 |
| Sales (MMM) | $4,538,798 | $3,343,924 |
| iROAS (MMM) | 2.89 | 5.68 |
| New Customer CLV (MMM) | $10,623,929 | $555,353 |
| CLV ROI (MMM) | 6.77 | 0.94 |
| Sales + CLV ROI (MMM) | 9.67 | 6.63 |
Retargeting has the higher immediate iROAS: 5.68 versus 2.89. Prospecting generates substantially more modeled new-customer value, both in total and per dollar of spend. Once the configured CLV contribution is included, Prospecting has the higher combined return: 9.67 versus 6.63.
The difference is not explained by scale alone. Prospecting spends more, but its CLV ROI is also higher. Reading both the contribution and the return prevents a large budget from being mistaken for better efficiency.
4. Use customer value to assess acquisition investment
This comparison helps when an acquisition campaign looks weak against a short-term ROAS target. In the demo, reducing Prospecting solely because its immediate iROAS is below Retargeting's would overlook much of the value associated with the new customers it generates.
Use immediate sales metrics for near-term sales and cash requirements, and the configured sales-plus-CLV measure when the decision includes longer-term customer value. Agree on the CLV horizon, retention assumptions and revenue or margin basis with finance before using the combined return as a budget target.
For the actual increase or reduction, inspect the response curve and marginal incremental ROAS (miROAS) for the relevant outcome. The historical combined return tells you why a channel deserves consideration; the forecast at the proposed spend tells you how far to change its budget.
Further Reading and Resources
Read channel performance
Turn the comparison into a plan
About the author

Lauri Potka is the Chief Operating Officer at Sellforte, with over 15 years of experience in Marketing Mix Modeling, marketing measurement and media spend optimization. Before joining Sellforte, he worked as a management consultant at the Boston Consulting Group, advising some of the world’s largest advertisers on marketing optimization. Follow Lauri on LinkedIn.
How to See Which Channels Drive Incremental Sales
How to Measure Digital Advertising’s Impact on In-Store Sales