

Let's fast-forward a few weeks to Peak Season. You lower the target ROAS of a Google Ads campaign to capture more demand, and a week later sales are up. On the face of it, the change worked.
But how much of that growth came from your decision, and how much would have happened anyway as shoppers ramped up for Black Friday?
This is one of the hardest parts of evaluating campaign changes in ecommerce and retail. Sales rise and fall for reasons that have little to do with your bidding decisions, which makes it difficult to tell whether an optimization actually worked.
Today we're releasing an update to Sellforte Change Intelligence that adjusts for shifts in demand, such as seasonal peaks and post-holiday slowdowns, when it evaluates a campaign change. You see the effect of your decision, separated from what the calendar would have done anyway.
From Campaign Changes to Incremental Impact
When we launched Change Intelligence in February, our goal was to help marketers understand whether their campaign optimizations were actually delivering results.
Change Intelligence automatically detects campaign adjustments, including changes to target ROAS, target CPA and budgets. It uses counterfactual analysis to estimate what would have happened without the change.
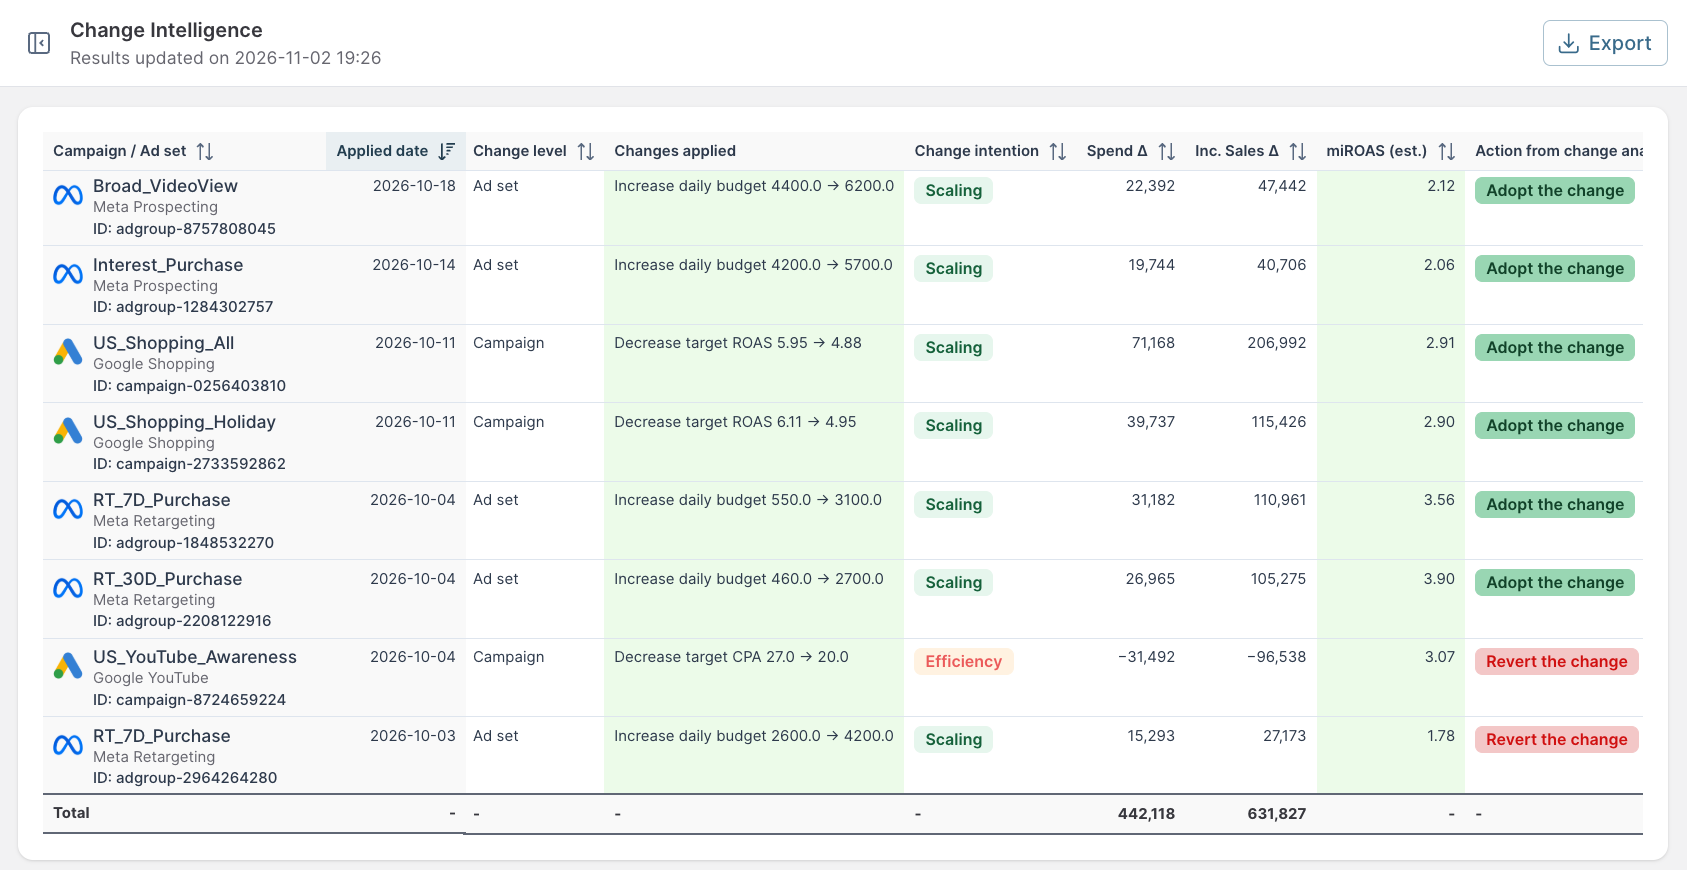
By comparing actual performance against this estimate, Change Intelligence calculates the marginal incremental ROAS (miROAS) of the change: the extra incremental sales generated for each extra unit of spend. It then recommends whether to adopt the change, revert it or keep observing.
What's New: A Baseline That Moves With Demand
Market demand rarely stays constant. In the first example below, available impressions doubled on Black Friday. In the second, they fell by a third after the New Year. If the counterfactual assumes demand stayed flat, those swings get credited to, or blamed on, your decision.
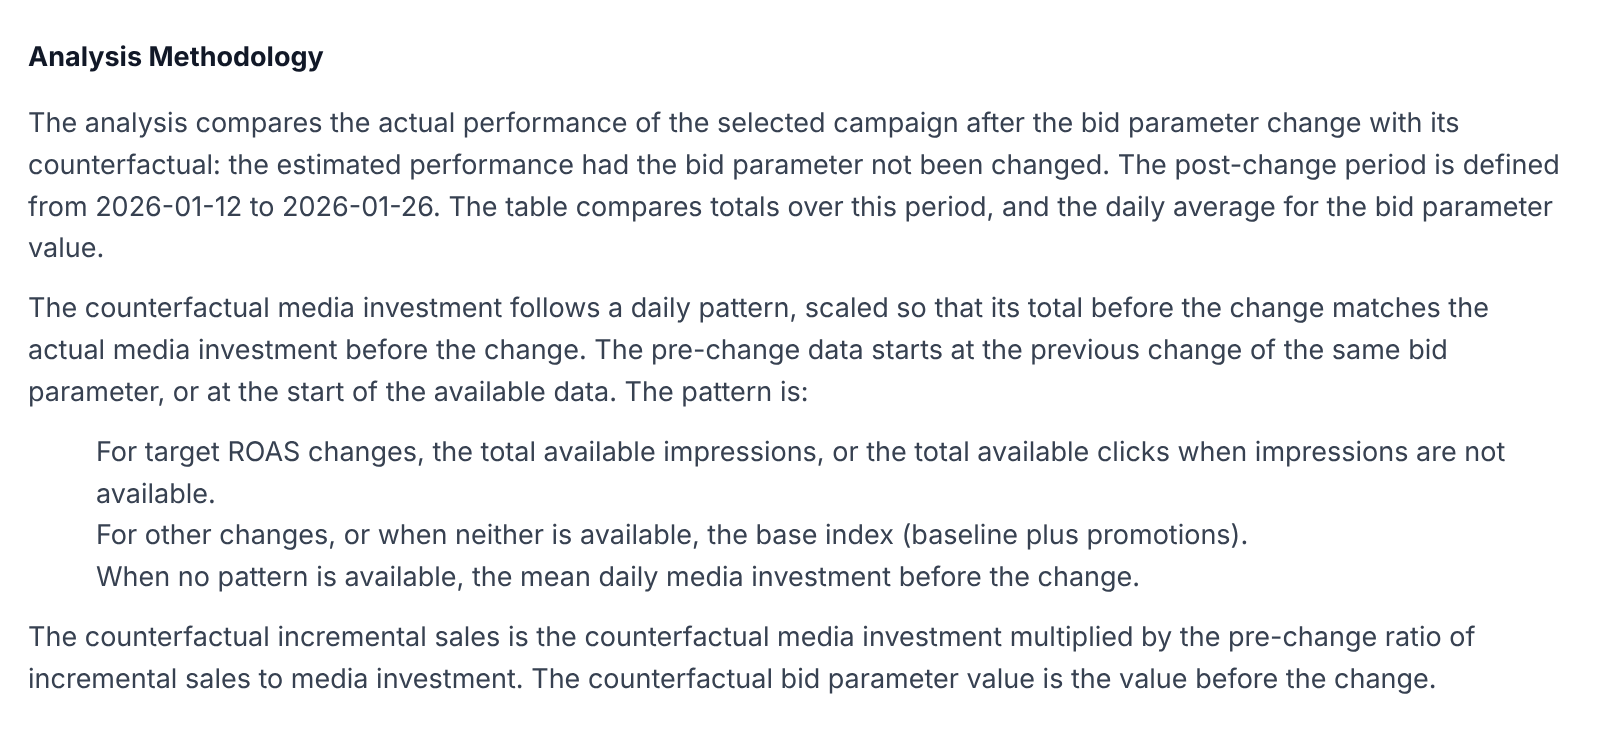
Change Intelligence now builds the counterfactual from a demand signal:
- Target ROAS changes: the campaign's available impressions, or available clicks when impressions aren't available.
- Other changes: Sellforte's baseline and promotions index.
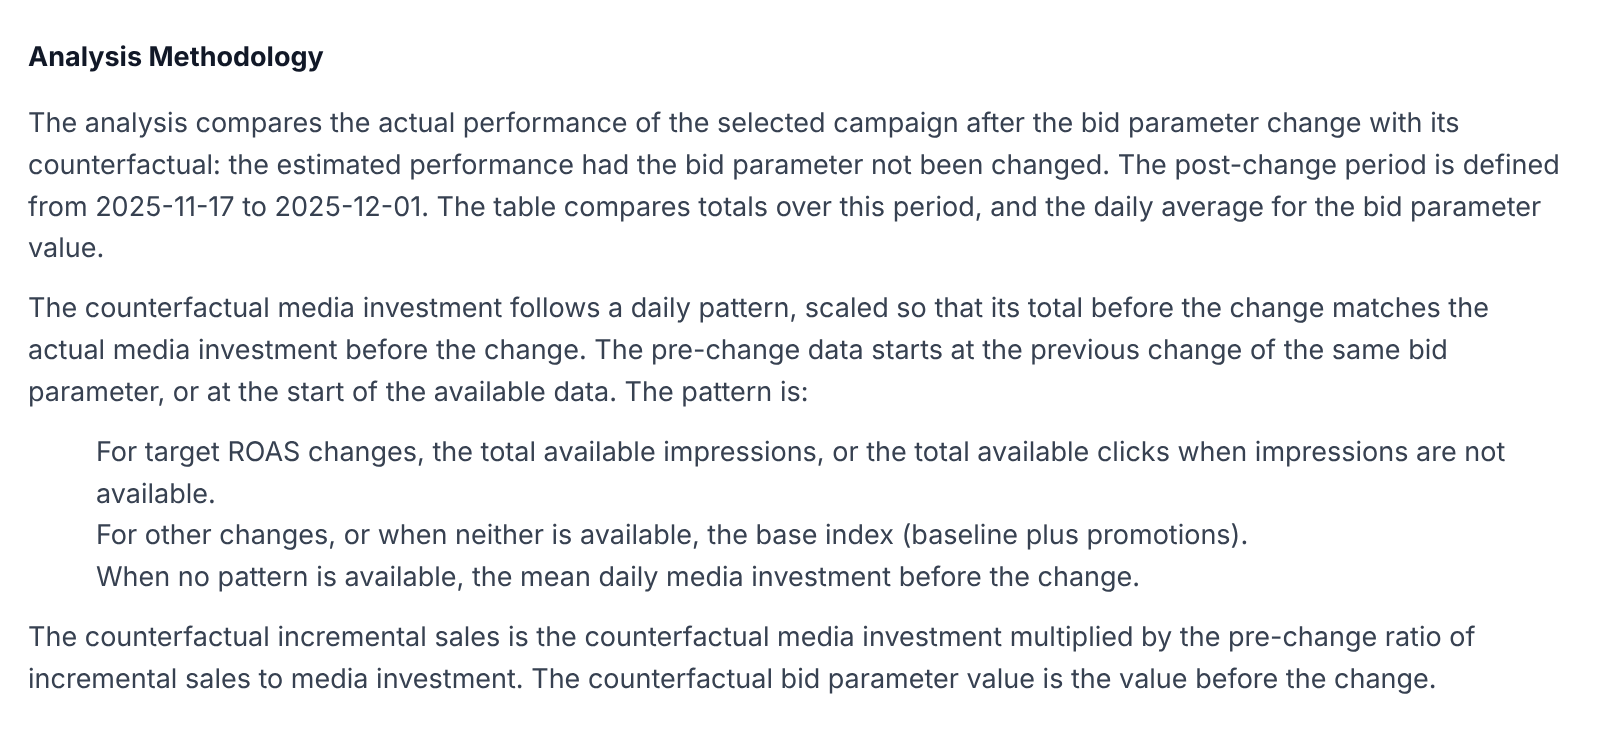
The counterfactual's spend follows that signal, and its incremental sales keep the campaign's pre-change return on spend. The estimate shows what the campaign would likely have done if demand had moved but your settings hadn't.
We've also updated the analysis view with clearer side-by-side comparisons of actual and counterfactual performance.
How to Read miROAS
miROAS tells you what the spend a change added or removed was returning. Compare it with your breakeven, which is 1 ÷ gross margin. At a 45% margin, breakeven is 2.22.
- Added spend: keep the change if miROAS is above breakeven. Below it, the extra spend costs more than it earns.
- Removed spend: keep the cut if miROAS is below breakeven. That spend was earning less than it cost, so cutting it saves money.
The rule is the same in both directions: spend should run only where it earns more than breakeven.
Where the Before-and-After View Goes Wrong
Both views use the same incremental sales from Sellforte's marketing mix model, which measures what each campaign drives every day. Those numbers aren't the problem. The problem is comparing two different periods: the before-and-after view credits your change with everything that moved between them, including Black Friday. When demand is steady, the two views agree and a simple before-and-after comparison works fine. Change Intelligence changes the answer only when demand moves.
Change Intelligence in Practice: Two Decisions That Flip Once Demand Is Accounted For
Both examples are illustrative. The data is simulated for a fictional US apparel retailer. Incremental sales are net of returns and the gross margin is 45%, so breakeven miROAS is 2.22. The results come from the same calculation Change Intelligence runs.
Example 1: Lowering Target ROAS Into Black Friday
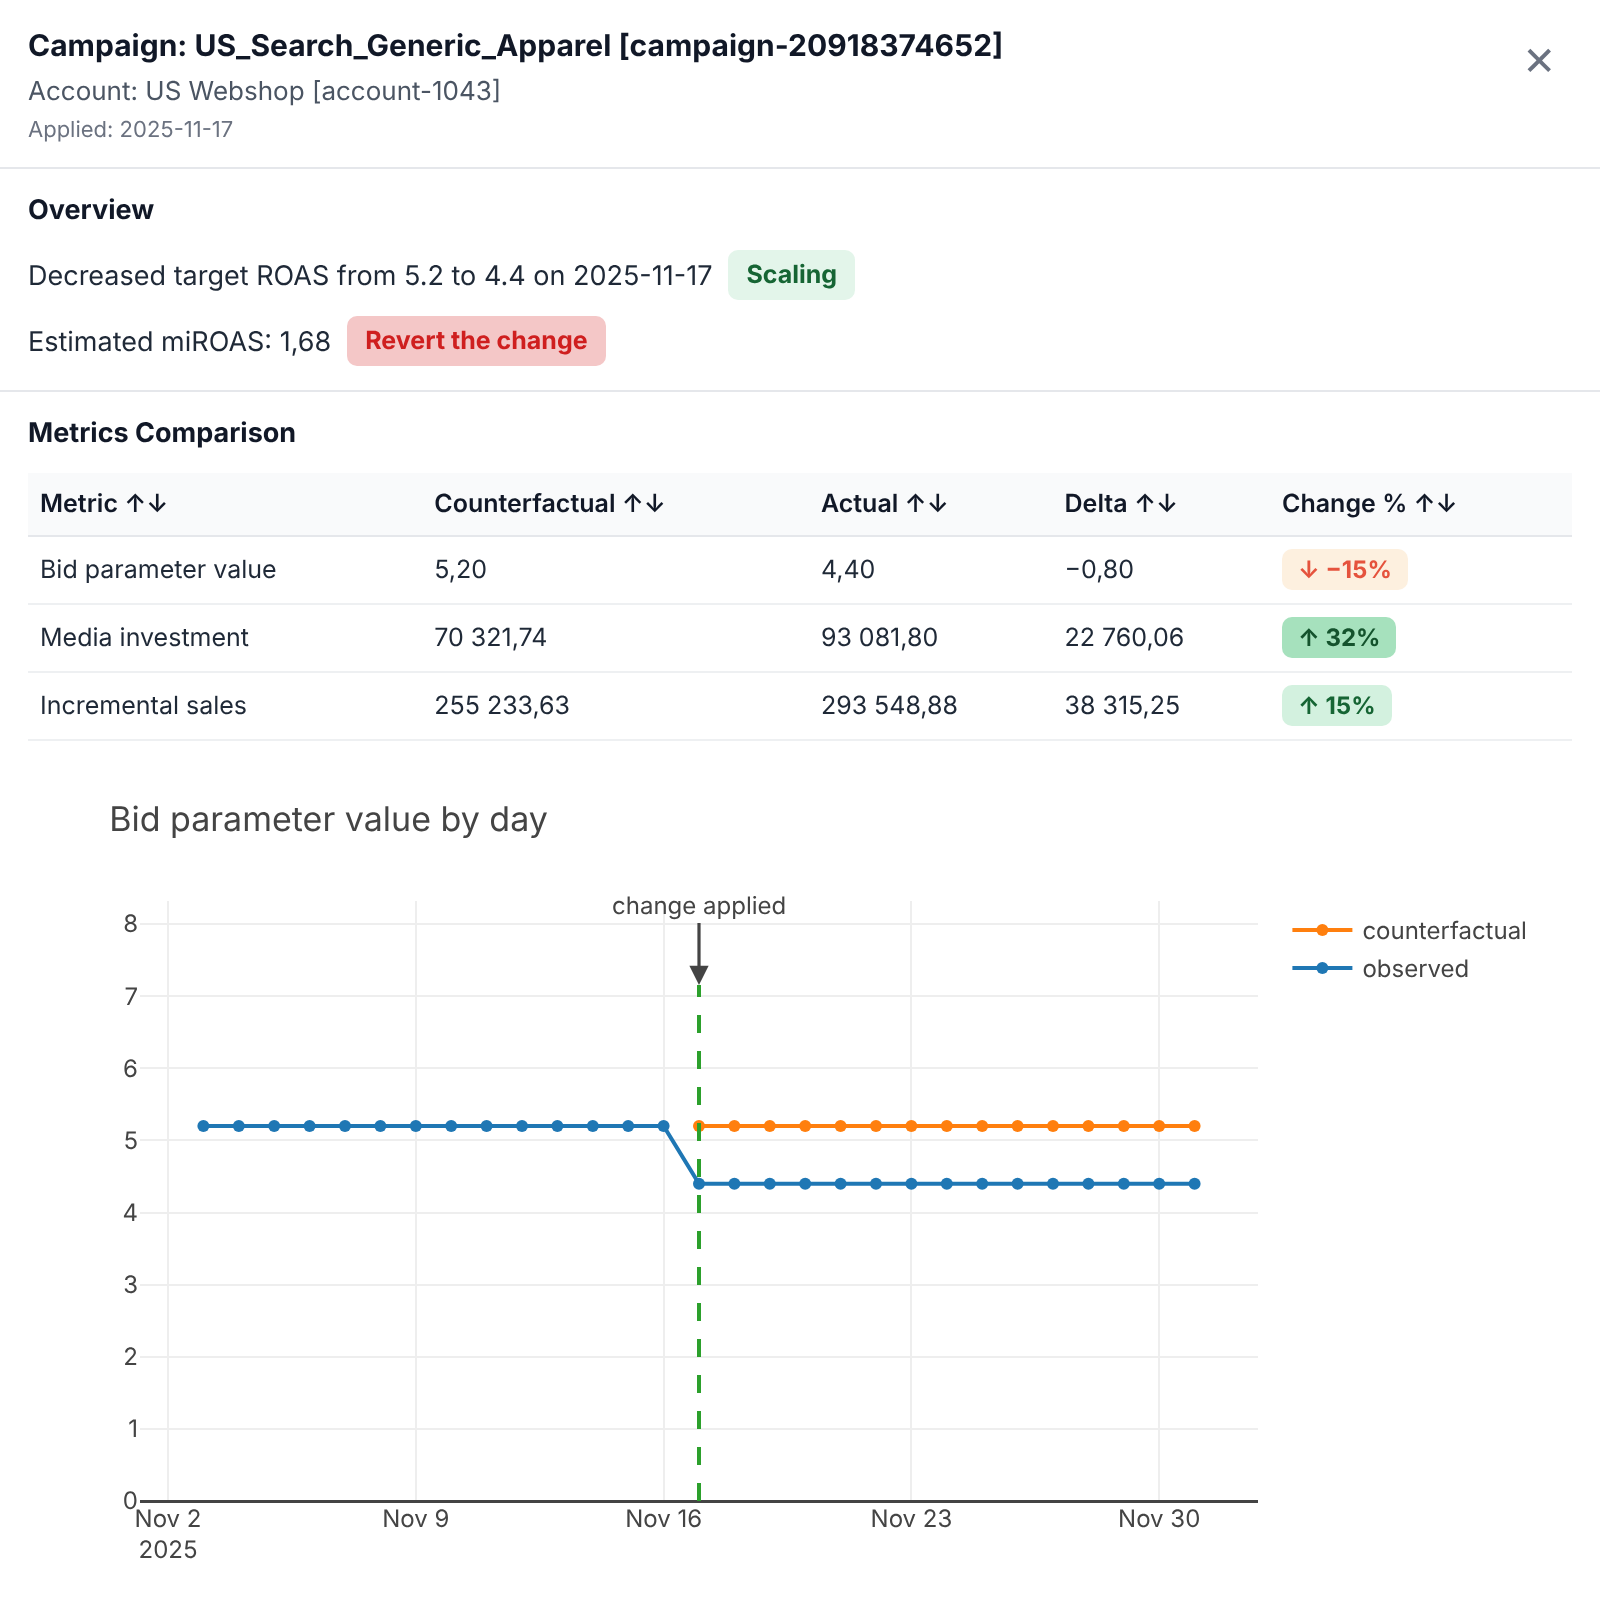
Here's how that played out last season. On 2025-11-17, ten days before Thanksgiving, the retailer lowered the target ROAS of its generic search campaign, US_Search_Generic_Apparel, from 5.2 to 4.4 to capture more peak-season demand.
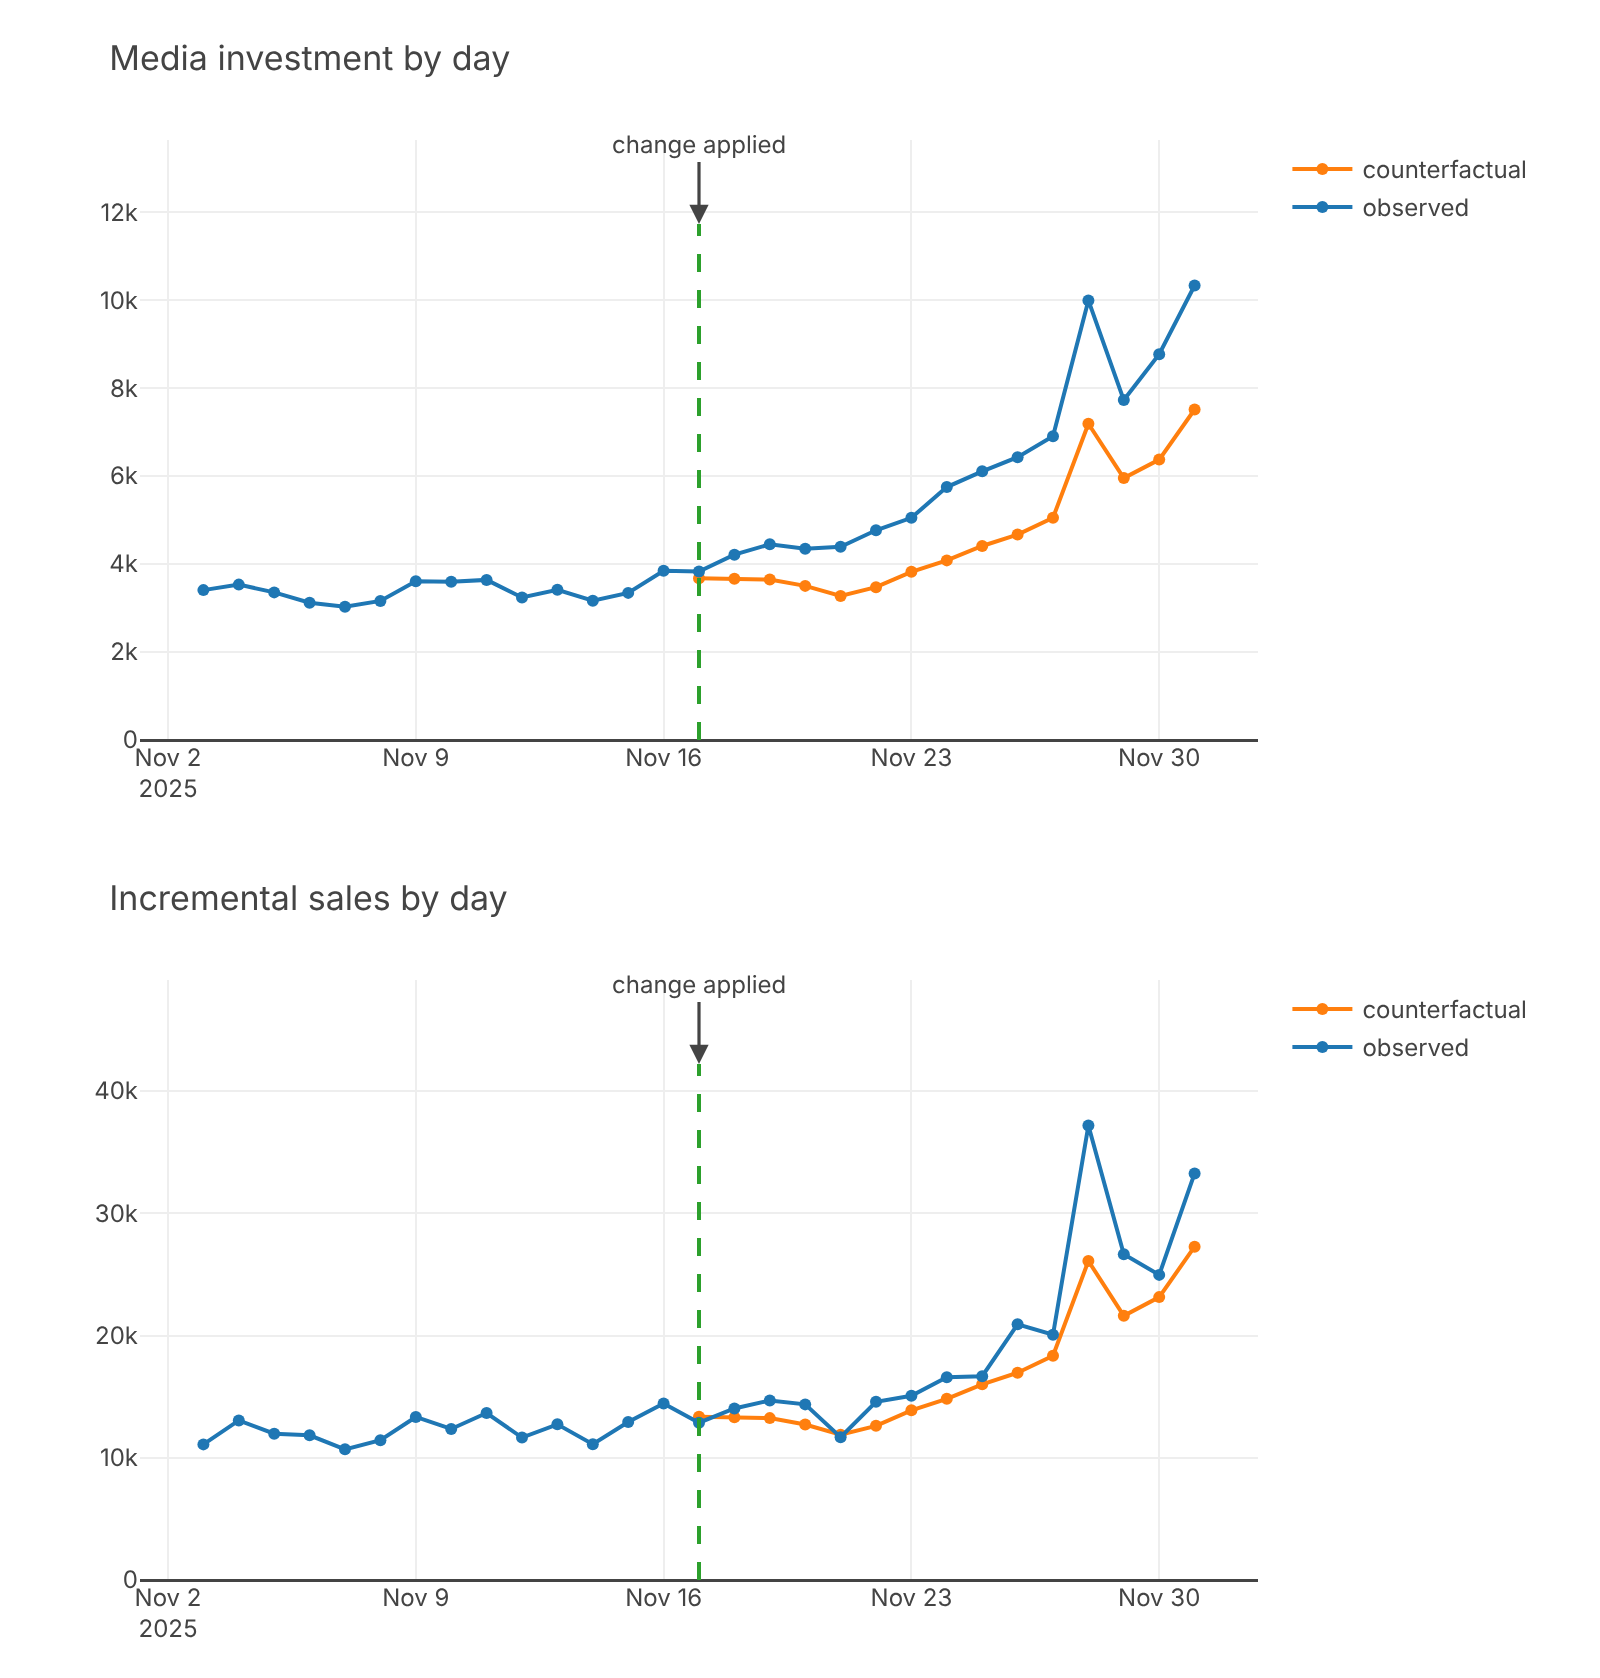
Change Intelligence uses the same incremental sales but compares them with what the campaign would have done at the old target. Available impressions rose 38% over the same period, so much of that growth would have happened anyway. Compared with the counterfactual, the lower target added $22 760 of spend (+32%) and $38 315 of incremental sales (+15%). That's a miROAS of 1.68.
That's below breakeven. Each extra dollar returned about $0.76 in gross profit, so the looser target cost roughly $5 500 over two weeks. Change Intelligence recommends Revert the change. Black Friday drove most of the growth, and the lower target mostly bought expensive extra sales.
Illustrative data
Example 2: Tightening Target ROAS in January
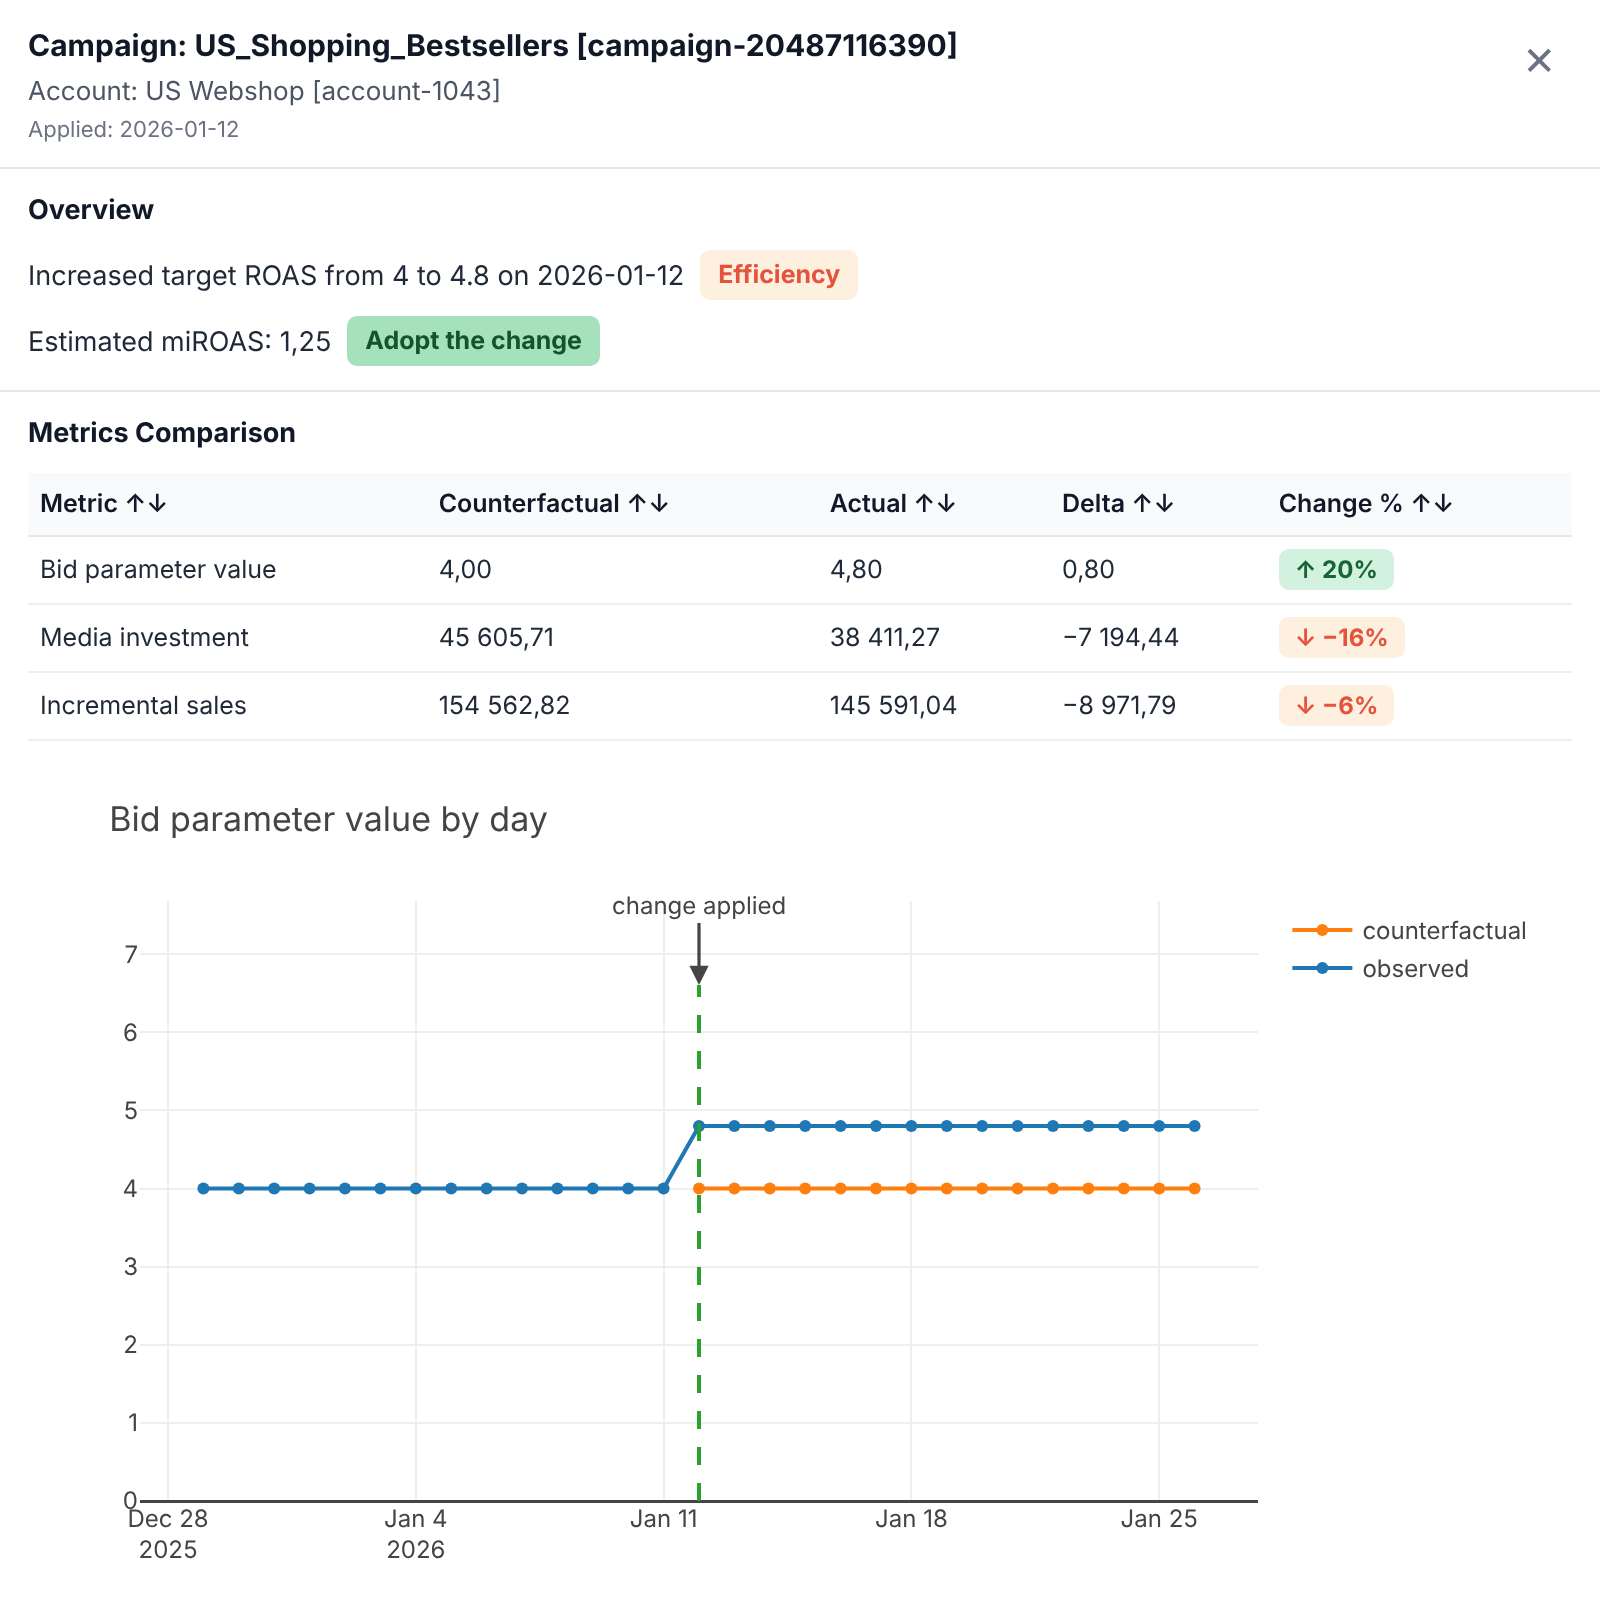
The opposite happens after the holidays. On 2026-01-12, the same retailer raised the target ROAS of its Shopping campaign, US_Shopping_Bestsellers, from 4.0 to 4.8 to cut back on less efficient traffic.
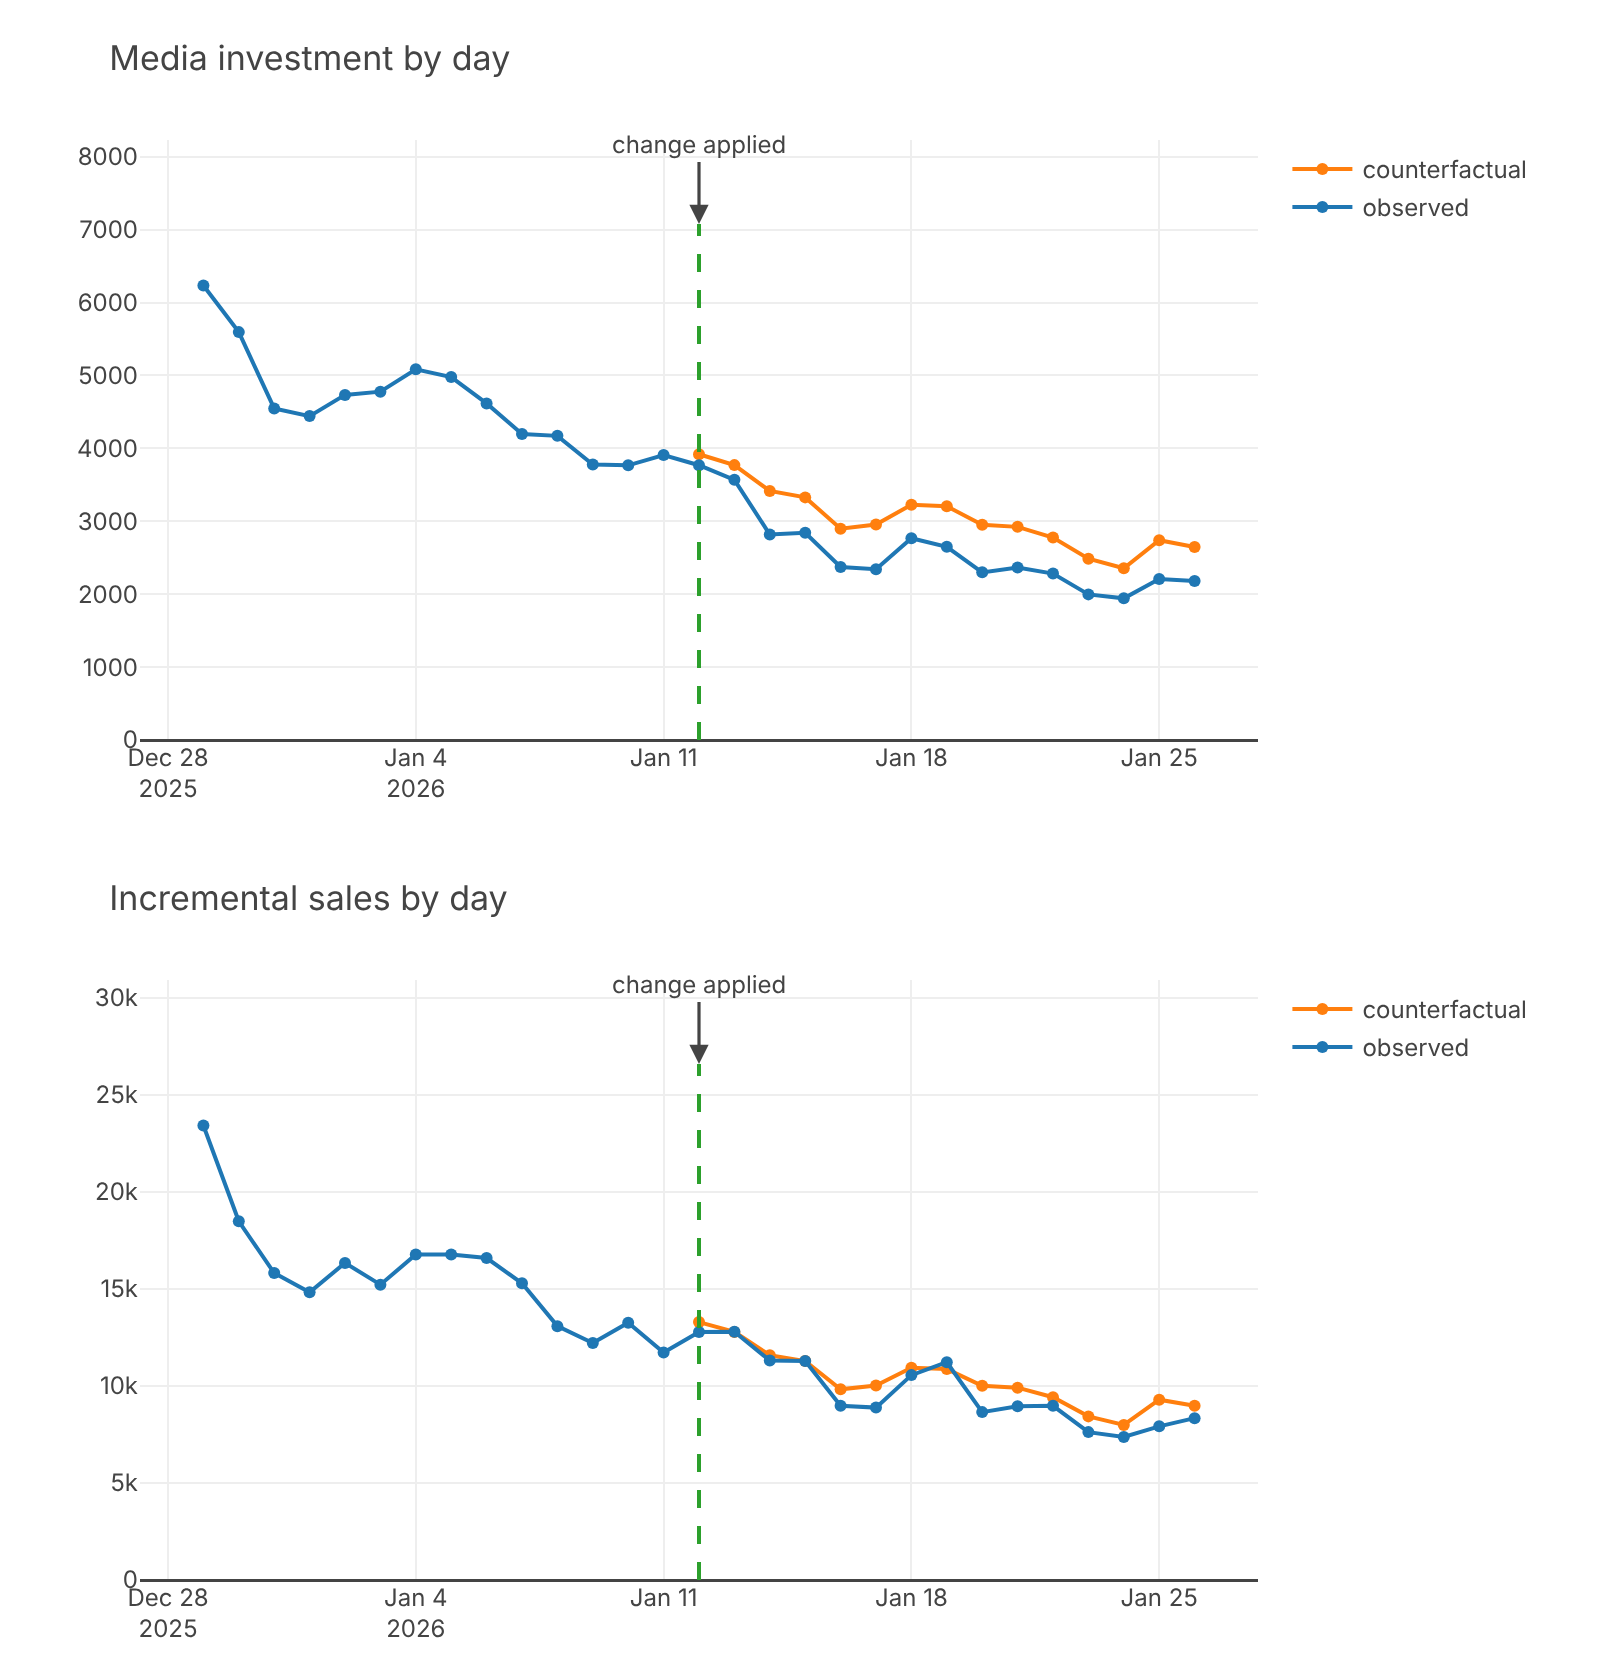
A before-and-after comparison looks alarming: daily spend down 45% and daily incremental sales down 38%. Each dollar cut appears to have cost about $2.90 in sales, well above breakeven. The obvious call is to undo the change.
But demand was falling anyway. Available impressions dropped 34% as post-holiday shopping slowed. Compared with the counterfactual, the higher target removed $7 194 of spend (−16%) and only $8 972 of incremental sales (−6%). That's a miROAS of 1.25 on the spend that was cut.
Each dollar that was cut had been returning only $1.25 in sales, about $0.56 in gross profit. Keeping that spend would have lost money, so the cut saved about $3 200 over two weeks. Change Intelligence recommends Adopt the change.
Illustrative data
In both cases, the before-and-after view and the demand-adjusted view point to opposite decisions. Without accounting for demand, the retailer would have kept a target that lost money on every extra dollar through peak season and reversed a cut that was saving money.
Like any estimate, miROAS carries uncertainty. The closer a result is to breakeven, the more it pays to keep observing.
Better Measurement, Better Optimization
Marketing teams make campaign adjustments every day, but knowing which decisions actually improved performance isn't straightforward.
With this update, Change Intelligence separates the effect of your decisions from shifts in demand. Everyday campaign changes become a source of continuous learning, including during the weeks when demand moves the most.
Because the question isn't whether performance improved after your change. It's whether your change made the difference.
Want to see how it works?

Introducing Change Intelligence: Finally, Measure the Incremental Impact of Every Target ROAS Change

What changes when an ecommerce or retail company adopts incrementality?