


Return on advertising spend (ROAS) is the revenue credited to advertising for each unit of currency spent on media. It is calculated by dividing attributed revenue by media spend, so a ROAS of 5.0 means $5 of attributed revenue per $1 of ad spend. Standard ROAS relies on attribution: it shows credited revenue, not the revenue the ads actually caused.
ROAS formula
Return on ad spend (ROAS) = Revenue attributed to advertising / Media spend
Media spend: the amount paid to ad platforms and publishers for the campaign. Creative production, agency fees and other costs are normally left out of ROAS and included in return on investment (ROI) instead.
Attributed revenue: revenue linked to advertising touchpoints by an attribution model, such as last-click, first-click or multi-touch attribution, or by the ad platform's own attribution rules.
ROAS is expressed either as a ratio (5.0) or as a percentage (500%). Google Ads reports it in the "Conv. value / cost" column, and its Target ROAS bidding strategy is set as a percentage: conversion value / cost × 100% (Google Ads Help, n.d.-a).
Example calculation for ROAS
If $10,000 of revenue can be attributed to a campaign and $2,000 was spent on the campaign, ROAS is 5.0.
| Revenue attributed to a campaign | $10,000 |
| Spend on the campaign | $2,000 |
| Return On Ad Spend (ROAS) | 5.00 |
ROAS vs. ROI
ROAS and ROI answer different questions:
- ROAS = revenue / media spend. It uses revenue, not profit, and only media costs. It is the standard metric for comparing and bidding campaigns inside ad platforms.
- ROI = (profit generated − total marketing cost) / total marketing cost. It uses profit or contribution margin and includes all costs: media, creative production, agency fees and tools.
A campaign can have a ROAS above 1.0 and still lose money once product costs and production costs are counted. For this reason, ROAS targets are set from margins, as below.
Break-even ROAS
Break-even ROAS is the ROAS at which the gross profit from the revenue exactly covers the media spend:
Break-even ROAS = 1 / Gross margin (or contribution margin)
With a 40% margin, break-even ROAS is 1 / 0.40 = 2.5. Every $1 of media must bring at least $2.50 of revenue to pay for itself. With a 25% margin, break-even ROAS is 4.0. Break-even ROAS only holds when the revenue in the numerator is incremental. If half of the attributed revenue would have happened anyway, an attributed ROAS of 2.5 corresponds to an incremental ROAS (iROAS) of about 1.25 and a loss.
The attribution foundation of ROAS
Standard ROAS is based on attribution, not incrementality. Conversion tracking requires that the advertiser has implemented the ad platform's tracking method, often called a tracking pixel, or a server-side connection. This sends conversion events to the platform, which then connects them to campaigns using attribution rules.
The rules are set by the platform and can be adjusted by the advertiser. In Google Ads, the default click-through conversion window is 30 days, adjustable between 1 and 90 days depending on the conversion source (Google Ads Help, n.d.-b). Meta's default attribution setting is 7-day click or 1-day view (Meta Business Help Center, n.d.), which means conversions can be credited after a view without a click.
Why attribution-based ROAS can be misleading
- Capturing existing demand. Attribution credits conversions that would have happened without the ad. In a large field experiment at eBay, the returns to paid search were a fraction of non-experimental estimates, and brand-keyword ads showed no measurable short-term benefit (Blake, Nosko & Tadelis, 2015).
- Observational bias. Across 15 randomized experiments at Facebook, observational methods often failed to reproduce the experimental ad effects, even with extensive data on users (Gordon et al., 2019).
- Cross-channel double counting. Each platform attributes conversions with its own rules, so the same order can be credited to several platforms, and the sum of platform-reported revenue can exceed actual sales.
Attributed ROAS vs. incremental ROAS (iROAS)
While attributed ROAS tells you what revenue is credited to your advertising, incremental ROAS (iROAS) tells you how much additional revenue the advertising caused, compared with what would have happened without it:
iROAS = Incremental revenue / Media spend
Incremental revenue cannot be observed directly; it is estimated by comparing outcomes with and without advertising, typically through:
- Marketing mix modeling
- Conversion lift studies with randomized holdout groups
- Geo experiments
Advertising effects are small relative to the normal variation in sales, so even large experiments measure them with wide uncertainty. Lewis and Rao analyzed 25 large field experiments with U.S. retailers and brokerages, most of them reaching millions of customers, and showed that the returns to advertising are hard to measure precisely even at that scale (Lewis & Rao, 2015). This is one reason to combine experiments with MMM rather than rely on a single test.
Two further concepts build on iROAS. Marginal iROAS (miROAS) is the incremental return on the next unit of spend, which falls as a channel saturates and is the relevant number for budget shifts; see marginal incremental ROAS (miROAS). Sellforte also explains the concept of full iROAS. For an overview of all three, read ROAS, iROAS and miROAS.
Setting a target ROAS
Platform bidding strategies such as Target ROAS optimize towards attributed ROAS. To set a target that reflects real profitability, the target has to account for how much of the campaign's attributed revenue is incremental, as well as for margins. Sellforte describes one way to do this in how to set a target ROAS that takes incrementality into account.
How can digital marketers track ROAS?
Each ad platform reports ROAS for its own campaigns. To compare ROAS across platforms on the same basis, and to compare attributed ROAS with iROAS, the data needs to be consolidated in one measurement tool. Below is an example of an advertising channel-level view from the Sellforte demo.

Articles comparing last-click attribution with incrementality-based measurement:
- How to measure Meta correctly? GA4 vs. MTA vs. MMM
- How to measure Meta correctly? Part 2: Add offline sales impact
- How to measure the true effectiveness of TikTok ads?
ROAS in the media metric funnel
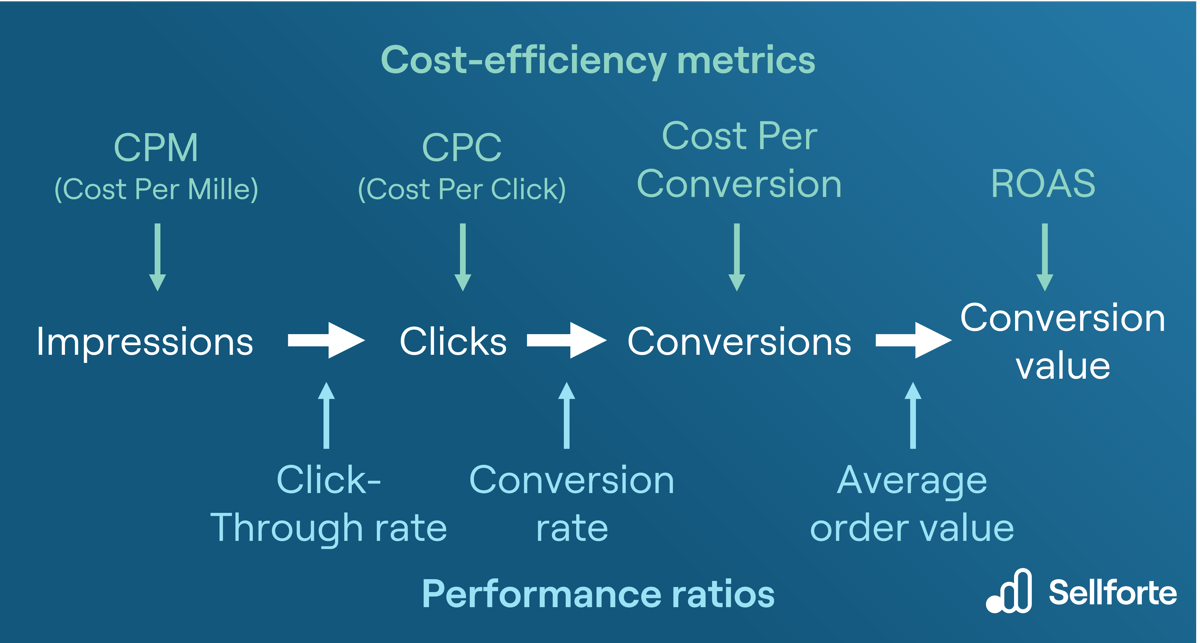
ROAS is one of the cost-efficiency metrics in the media metric funnel, which follows an ad from impressions to clicks, conversions and conversion value. Conversions in the funnel are counted by attribution rules after a click or, for some ad types, after a view without a click, so the funnel describes attributed results rather than incremental ones.
Key takeaways
- ROAS = attributed revenue / media spend. Production and other costs belong in ROI.
- Break-even ROAS = 1 / margin, and it applies to incremental revenue, not attributed revenue.
- Budget decisions should rest on iROAS and marginal iROAS, measured with experiments and MMM.
Related terms
- Incrementality
- Average order value (AOV)
- Cost per conversion (CPA)
- Branded search advertising
- Causality
- Response curve
- Marginal iROAS (miROAS)
- Multi-touch attribution (MTA)
Further reading on Sellforte
- ROAS, iROAS and miROAS
- Marginal incremental ROAS (miROAS)
- Full iROAS
- How to set a target ROAS that takes incrementality into account
References
- Blake, T., Nosko, C., & Tadelis, S. (2015). Consumer heterogeneity and paid search effectiveness: A large-scale field experiment. Econometrica, 83(1), 155–174. https://doi.org/10.3982/ECTA12423
- Google Ads Help. (n.d.-a). About Target ROAS bidding. Retrieved 2026-10-30, from https://support.google.com/google-ads/answer/6268637
- Google Ads Help. (n.d.-b). About conversion windows. Retrieved 2026-10-30, from https://support.google.com/google-ads/answer/3123169
- Gordon, B. R., Zettelmeyer, F., Bhargava, N., & Chapsky, D. (2019). A comparison of approaches to advertising measurement: Evidence from big field experiments at Facebook. Marketing Science, 38(2), 193–225. https://doi.org/10.1287/mksc.2018.1135
- Lewis, R. A., & Rao, J. M. (2015). The unfavorable economics of measuring the returns to advertising. The Quarterly Journal of Economics, 130(4), 1941–1973. https://doi.org/10.1093/qje/qjv023
- Meta Business Help Center. (n.d.). About the attribution setting. Retrieved 2026-10-30, from https://www.facebook.com/business/help/460276478298895
Authors

Lauri Potka is the Chief Operating Officer at Sellforte, with over 15 years of experience in Marketing Mix Modeling, marketing measurement, and media spend optimization. Before joining Sellforte, he worked as a management consultant at the Boston Consulting Group, advising some of the world’s largest advertisers on data-driven marketing optimization. Follow Lauri in LinkedIn, where he is one of the leading voices in MMM and marketing measurement.


