


Marginal incremental ROAS (miROAS), or marginal iROAS, is the incremental revenue generated by the next unit of advertising spend in a channel, campaign or ad set at its current spend level. Because returns diminish as spend grows, miROAS is usually lower than average incremental ROAS (iROAS), and it is the metric for deciding where to add or cut budget.
Marginal iROAS formula
Marginal iROAS (miROAS) = Δ Incremental revenue / Δ Spend
- Δ Spend: a small change in spend from the current level, for example one euro or 1% of the current budget.
- Δ Incremental revenue: the change in incremental revenue that this extra spend causes.
In the limit, miROAS is the slope of the channel's response curve at the current spend level, so the same channel can have a high miROAS at low spend and a low one once it saturates. Average iROAS, by contrast, covers the whole range from zero to the current spend. For the longer explanation, see Marginal Incremental ROAS (miROAS): What is it?
Example calculation
A marketing mix model estimates the incremental revenue of two channels at current spend and with 5 000 EUR more per month (illustrative numbers):
| Channel A | Channel B | |
| Current monthly spend | 50 000 EUR | 20 000 EUR |
| Incremental revenue at current spend | 200 000 EUR | 70 000 EUR |
| iROAS (average) | 4.0 | 3.5 |
| Incremental revenue with 5 000 EUR more spend | 206 000 EUR | 83 000 EUR |
| Added incremental revenue | 6 000 EUR | 13 000 EUR |
| Marginal iROAS (miROAS) | 1.2 | 2.6 |
Channel A has the higher iROAS, but Channel B returns more than twice as much for the next euro. Moving 5 000 EUR from A to B would raise incremental revenue by roughly 13 000 − 6 000 = 7 000 EUR at the same total spend (slightly less in practice, because on a concave curve the euros removed from A are worth a little more than those added).
Whether the next euro is profitable depends on margin. With a 50% contribution margin, each euro of incremental revenue brings 0.50 EUR of contribution, so the break-even miROAS = 1 / contribution margin = 2.0. Channel B's next euro (2.6) clears that bar. Channel A's (1.2) does not, which suggests A is above its profit-maximizing spend even though its iROAS of 4.0 looks excellent.
miROAS vs iROAS vs ROAS
| Metric | Revenue in numerator | Question it answers |
| Platform ROAS | Revenue attributed by the ad platform or by last click | How much revenue was credited to the ads? |
| iROAS | Incremental revenue caused by all spend in the period, divided by that spend | Did the money spent so far pay off? |
| Marginal iROAS (miROAS) | Incremental revenue from the next unit of spend | Should we spend more or less from here? |
Platform ROAS is neither incremental nor marginal, yet it is what bidding systems use. Google Ads' Target ROAS strategy sets bids to maximize conversion value while trying to achieve an average ROAS equal to the target, based on tracked conversion values (Google Ads Help, n.d.). Turning an MMM's marginal iROAS into a Target ROAS therefore needs a conversion step; bid optimization with miROAS walks through it.
The idea has other names. Jin et al. (2017) compute ROAS and mROAS from the posterior samples of a Bayesian MMM, and Google's open-source MMM Meridian reports marginal ROI (mROI), defined as the incremental outcome of the next dollar spent above the historical spend level (Google, n.d.). When a source writes marginal ROAS without the "i", check whether the revenue behind it is incremental or attributed.
How marginal iROAS is estimated in MMM
A marketing mix model estimates a response curve for each channel from spend and sales over time, adjusting for carryover, seasonality, prices and other drivers. Marginal iROAS is the derivative of that curve at the current spend level, and a Bayesian model gives a distribution for it rather than a single number. The Meridian documentation gives a practical reading: if a channel's mROI is much lower than its ROI, the channel is beginning to saturate at its historical spend level, and channels with the highest mROI are the best candidates for additional funds (Google, n.d.).
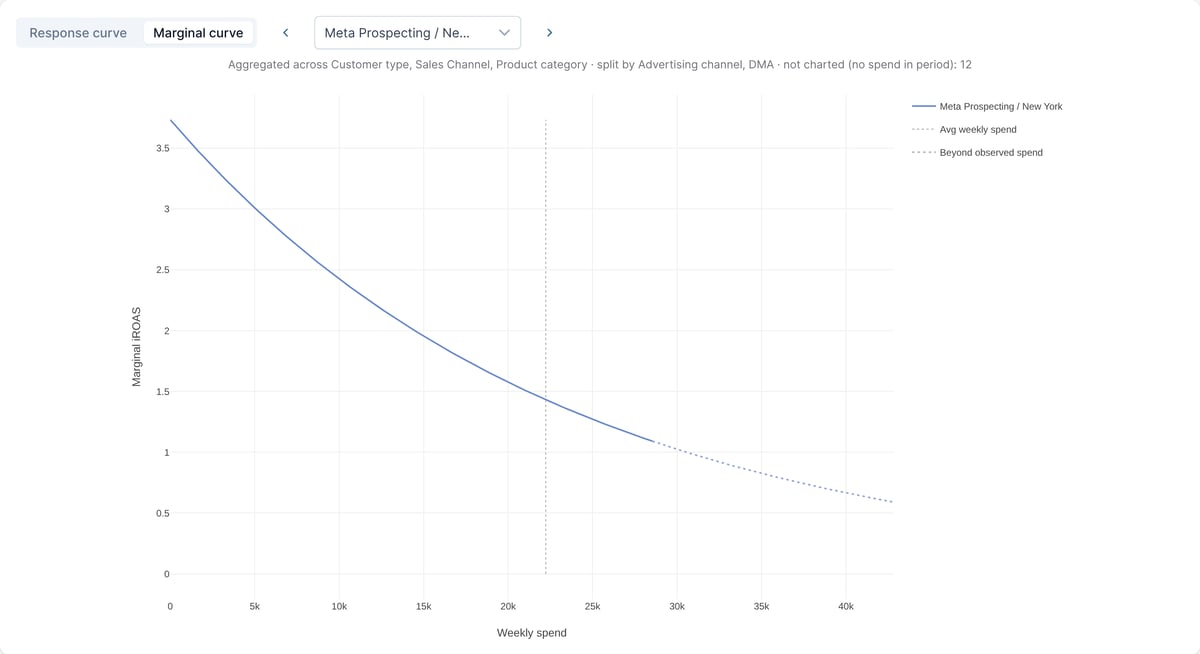
The chart below from the Sellforte demo (demo data) shows the marginal curve for one channel and market, Meta Prospecting in New York. Marginal iROAS falls from about 3.7 for the first dollars of weekly spend to about 1.4 at the average weekly spend (vertical line), and the dotted part extends beyond the spend levels observed in the data.
Three limits apply when reading marginal iROAS:
- It is local. For a large budget shift, read the change from the response curve instead of multiplying it by today's miROAS.
- It is less certain than iROAS. The slope can only be learned from variation in spend, and values beyond the observed range are extrapolation.
- It moves. Seasonality, creative and competition shift the curve, so miROAS needs refreshing as the model updates.
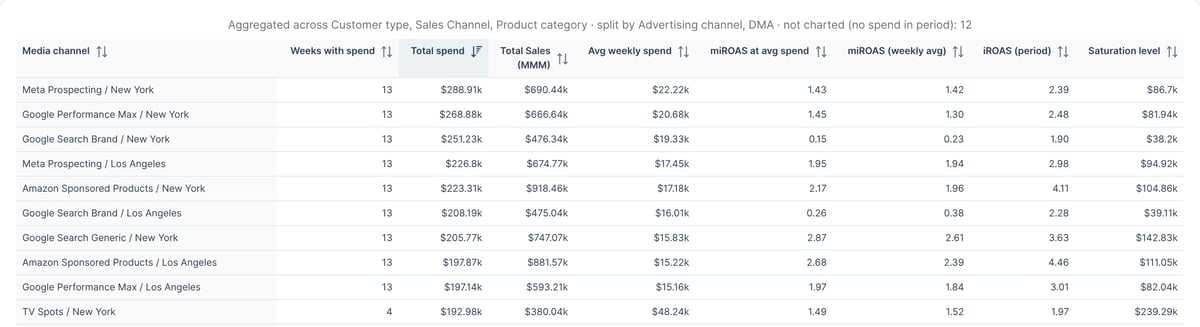
The summary table below, also from the Sellforte demo (demo data), lists marginal iROAS at average weekly spend next to period iROAS for the largest channel and market combinations. Google Search Brand in New York has a period iROAS of 1.90 but a marginal iROAS of 0.15 at its average weekly spend: past spend paid back on average, but the next dollar adds almost nothing.
Marginal iROAS and incrementality experiments
Experiments estimate iROAS as the causal effect on the response metric divided by the causal effect on ad spend (Chen & Au, 2022). Which part of the response curve that ratio describes depends on the design:
- Holdout or go-dark test. Spend in the test regions or audience drops to zero, as in a typical geo lift test. The result is the average iROAS over the whole range from zero to the current spend, which can be well above marginal iROAS.
- Heavy-up or scale test. Spend in the test regions increases from the current level. The result is the return on the added spend, which is close to marginal iROAS over that range and directly tests whether the channel can scale.
A single test measures one segment of the curve, so experiments are most useful for calibrating an MMM, which then gives marginal iROAS at any spend level.
Using marginal iROAS for budget decisions
Two rules follow. First, move budget from activities with low miROAS to those with high miROAS until marginal iROAS is roughly equal everywhere; at that point no reallocation can raise total incremental revenue for the same budget. Second, set the total budget where marginal iROAS reaches break-even after margins and variable costs. Setting advertising at the margin rather than from average returns goes back to the classic analysis of optimal advertising by Dorfman and Steiner (1954), and market response modeling treats diminishing returns to marketing effort as a typical shape of sales response (Hanssens, Parsons & Schultz, 2001).
Sellforte reports marginal iROAS down to campaign and ad set level and translates it into bid value recommendations, so the same rule applies inside ad platforms as well as across channels.
Key takeaways
- Marginal iROAS is the incremental revenue from the next unit of spend: the slope of the response curve at the current spend level.
- iROAS shows whether past spend paid off; miROAS shows whether to spend more or less. On a concave curve, miROAS is below iROAS.
- Break-even miROAS is 1 divided by the contribution margin. Reallocate until miROAS is similar across channels and at or above break-even.
- Holdout tests measure average iROAS. Heavy-up tests and experiment-calibrated MMMs are needed for the marginal return.
Related terms
- Response curve
- Return on Advertising Spend (ROAS)
- Incrementality
- Marketing Efficiency Ratio (MER)
- Geo lift test
Further reading on Sellforte
- Marginal Incremental ROAS (miROAS): What is it? And why does it matter to marketers?
- ROAS, iROAS, miROAS: Choosing the right KPI for optimizing media spend
- Bid optimization: How to calculate the optimal bid values for your campaigns using miROAS
References
- Chen, A., & Au, T. C. (2022). Robust causal inference for incremental return on ad spend with randomized paired geo experiments. The Annals of Applied Statistics, 16(1), 1–20. https://doi.org/10.1214/21-AOAS1493
- Dorfman, R., & Steiner, P. O. (1954). Optimal advertising and optimal quality. The American Economic Review, 44(5), 826–836. https://www.jstor.org/stable/1807704
- Google. (n.d.). About Target ROAS bidding. Google Ads Help. Retrieved 2026-11-17, from https://support.google.com/google-ads/answer/6268637
- Google. (n.d.). Incremental outcome, ROI, mROI & response curves. Meridian documentation. Retrieved 2026-11-17, from https://developers.google.com/meridian/docs/basics/roi-mroi-response-curves
- Hanssens, D. M., Parsons, L. J., & Schultz, R. L. (2001). Market response models: Econometric and time series analysis (2nd ed.). Kluwer Academic Publishers. https://doi.org/10.1007/b109775
- Jin, Y., Wang, Y., Sun, Y., Chan, D., & Koehler, J. (2017). Bayesian methods for media mix modeling with carryover and shape effects. Google Inc. https://research.google/pubs/bayesian-methods-for-media-mix-modeling-with-carryover-and-shape-effects/
Authors

Lauri Potka is the Chief Operating Officer at Sellforte, with over 15 years of experience in Marketing Mix Modeling, marketing measurement, and media spend optimization. Before joining Sellforte, he worked as a management consultant at the Boston Consulting Group, advising some of the world’s largest advertisers on data-driven marketing optimization. Follow Lauri in LinkedIn, where he is one of the leading voices in MMM and marketing measurement.


