

A promotion can increase revenue and still leave the business with less profit. Some customers would have bought at full price. Others bring their next purchase forward. And the extra units you sell may carry much less margin.
Promotion analysis measures what an offer changes compared with what would have happened without it. That means estimating incremental sales, calculating the effect on profit, and using the result to decide which offers to repeat, adjust, or stop.
This guide explains how to build that analysis, work through the economics, and read a Promotions dashboard. It also covers questions that come up in promotion reviews: how to separate media from discount effects, when returns change the conclusion, and why the best discount depth depends on the products and customers involved.
The decision to aim for
For each promotion, establish how much additional demand it created, how much contribution profit remained after costs, and what you would change next time. Keep revenue, discount investment, and profit as separate measures.
What is promotion analysis?
Promotion analysis, also called promotion effectiveness analysis, evaluates the commercial impact of offers such as price reductions, vouchers, bundles, loyalty discounts, and free shipping.
A sales report tells you how much customers bought during a campaign. An effectiveness analysis estimates how much of that business the campaign caused. The difference matters because promoted sales include purchases that would have happened anyway.
Start with these measures:
| Measure | What it tells you |
|---|---|
| Promoted sales | Revenue from transactions receiving the offer. Useful for tracking activity, but it includes baseline demand. |
| Incremental sales | The revenue difference between the promotion scenario and a credible scenario without the promotion. |
| Discount investment | The value of discounts granted against the agreed regular-price reference. |
| Incremental gross profit | The change in revenue minus product costs between those two scenarios. |
| Incremental contribution profit | The profit difference after additional variable campaign costs and relevant supplier funding. |
Define whether sales are before or after returns, exclude sales tax consistently, and agree which costs are included in margin. A revenue return and a profit return answer different questions, even when both are labeled “ROI.”
1. Establish what would have happened without the promotion
The starting point is the counterfactual: expected sales for the same period without the offer, with other conditions accounted for.
Last week's sales are rarely an adequate baseline on their own. Paydays, holidays, weather, stock availability, distribution, and advertising can all change demand. Comparing Black Friday with an ordinary October week attributes those differences to the promotion unless you adjust for them.
You can build the comparison through a well-designed test, a statistical model, or a combination of both:
- Controlled tests: compare eligible customers, stores, or regions receiving the offer with a suitable control group. Randomize where practical and monitor spillover between groups.
- Marketing Mix Modeling: estimate promotion effects alongside media and other sales drivers using historical variation. Marketing Mix Modeling (MMM) is useful when campaigns overlap and the analysis needs to cover online and offline sales.
- Adjusted historical comparisons: use comparable periods or locations and account for differences in demand conditions. Treat the result as less certain when major differences remain unexplained.
For revenue, the basic calculation is:
Incremental sales = sales with the promotion − estimated sales without the promotion
Apply the calculation to the same products, channels, geography, and time window. Record the assumptions behind the estimate. A precise-looking number is only useful if the comparison is credible.
2. Include the effects outside the promoted products and dates
A product-level sales spike can hide a weaker result for the business. Four effects deserve a separate check.
Customers who would have bought anyway
A discount applies to many baseline purchases as well as the additional purchases it creates. If regular customers use a sitewide voucher on orders they already intended to place, the business gives away margin without gaining the same amount of additional demand.
Cannibalization and halo effects
A discounted product may take sales from a substitute you sell at full price. It may also bring customers into the store and increase purchases of complementary products. Measure the net change at category, basket, or business level where the data allows. Count a halo only when the evidence supports additional purchases.
Purchases shifted across time
Customers may delay buying before an advertised sale or stock up during it and buy less afterward. Extend the evaluation window far enough to capture the relevant purchase cycle. Comparing only the promotion dates can turn a timing shift into apparent growth.
Returns and cancellations
An early read based on orders can overstate the result if returns arrive later. Compare offers using consistent return-adjusted sales, or mark recent results as provisional and use an explicit returns estimate. Include unrecovered shipping and handling costs when assessing contribution profit.
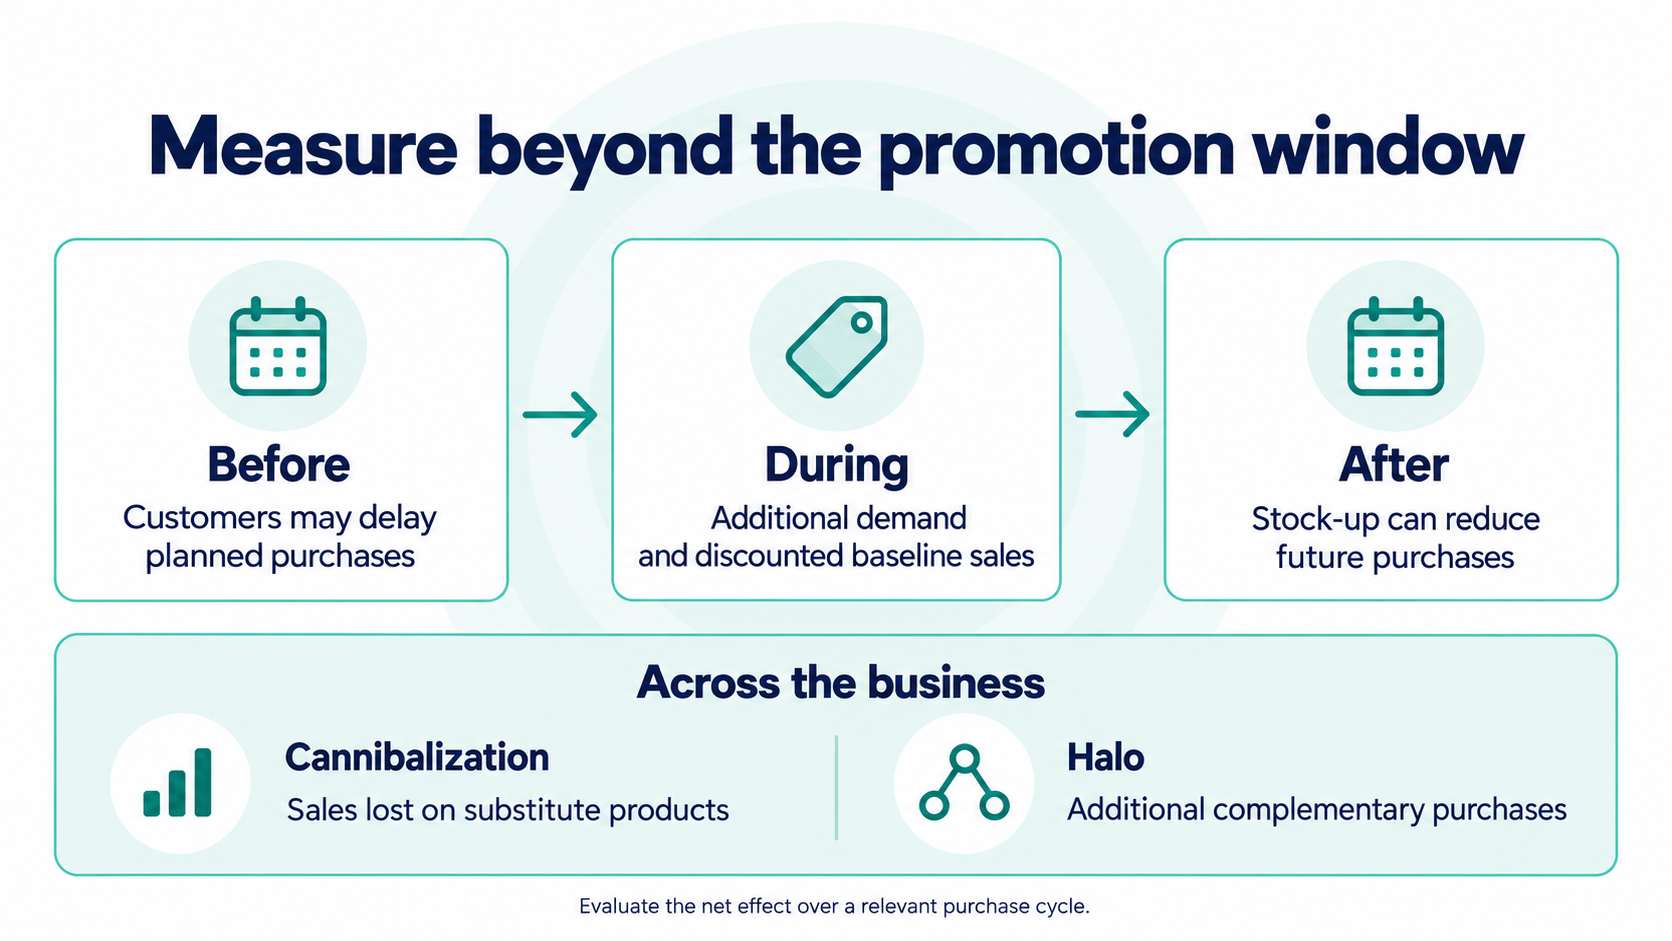
If the model or experiment already measures the net business effect across this scope, do not subtract estimated cannibalization or timing effects a second time. These checks define what the estimate needs to cover.
3. Calculate profit using the actual promotional economics
Consider a product that normally sells for $100 and costs $60. Without a promotion, you expect to sell 1,000 units. A 20% discount increases sales to 1,500 units.
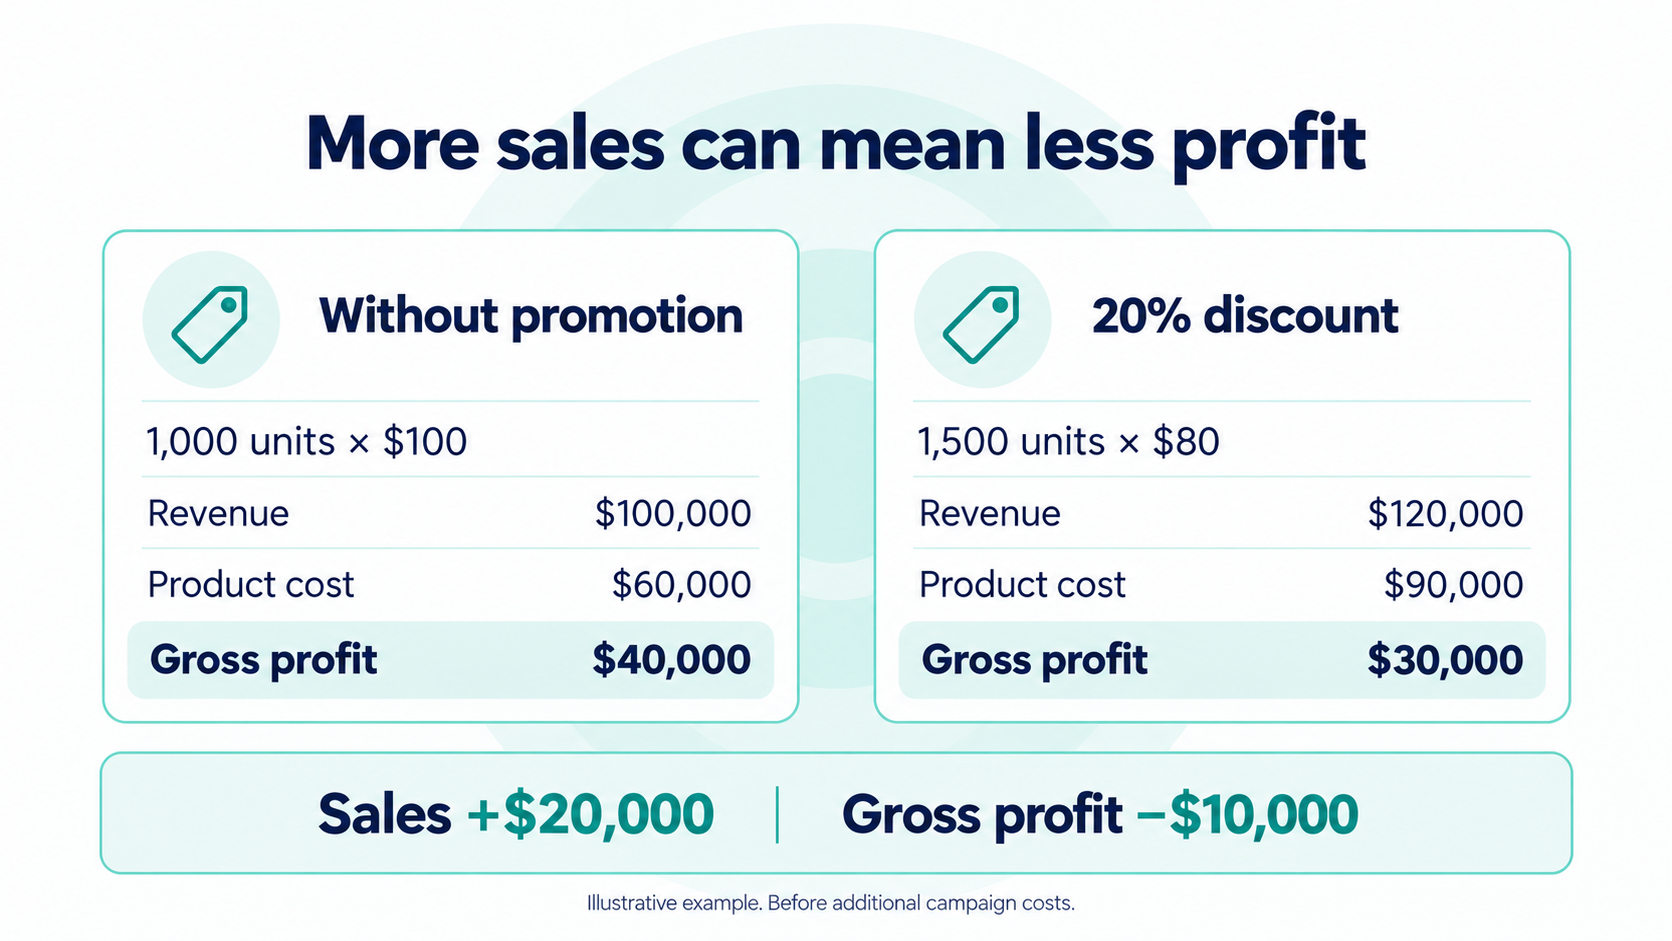
The offer creates 500 additional unit sales. Those units contribute $10,000 of gross profit at the discounted unit margin of $20. But the business also loses $20 of margin on each of the 1,000 units it would have sold anyway. That $20,000 loss outweighs the profit on the additional units.
If the campaign also incurs $5,000 of additional media, fulfillment, and execution costs, its incremental contribution profit is negative $15,000.
At this discount and unit cost, the business would need to sell 2,000 units just to preserve its original $40,000 gross profit, before additional campaign costs. Selling 50% more units is not enough.
A useful reconciliation is:
Incremental contribution profit
= gross profit with the promotion
− gross profit without the promotion
− additional costs not already included
+ incremental supplier funding not already included
Count every cost once. In this example, the $30,000 of granted discounts is already reflected in the $80 selling price. Subtracting that amount again from gross profit would double-count it. The same principle applies when returns, shipping, or supplier funding are already included in the input data.
Use the margins of the products actually sold at each discount depth. Applying one company-wide average margin to every promotion can hide the effect you are trying to measure.
4. Read sales, investment, and margin together in the dashboard
The Sellforte Promotions dashboard lets you examine modeled promotion contribution alongside granted discount investment. The screenshots below use the public demo, with the US selected and results grouped by discount bin. All figures are illustrative demo data.
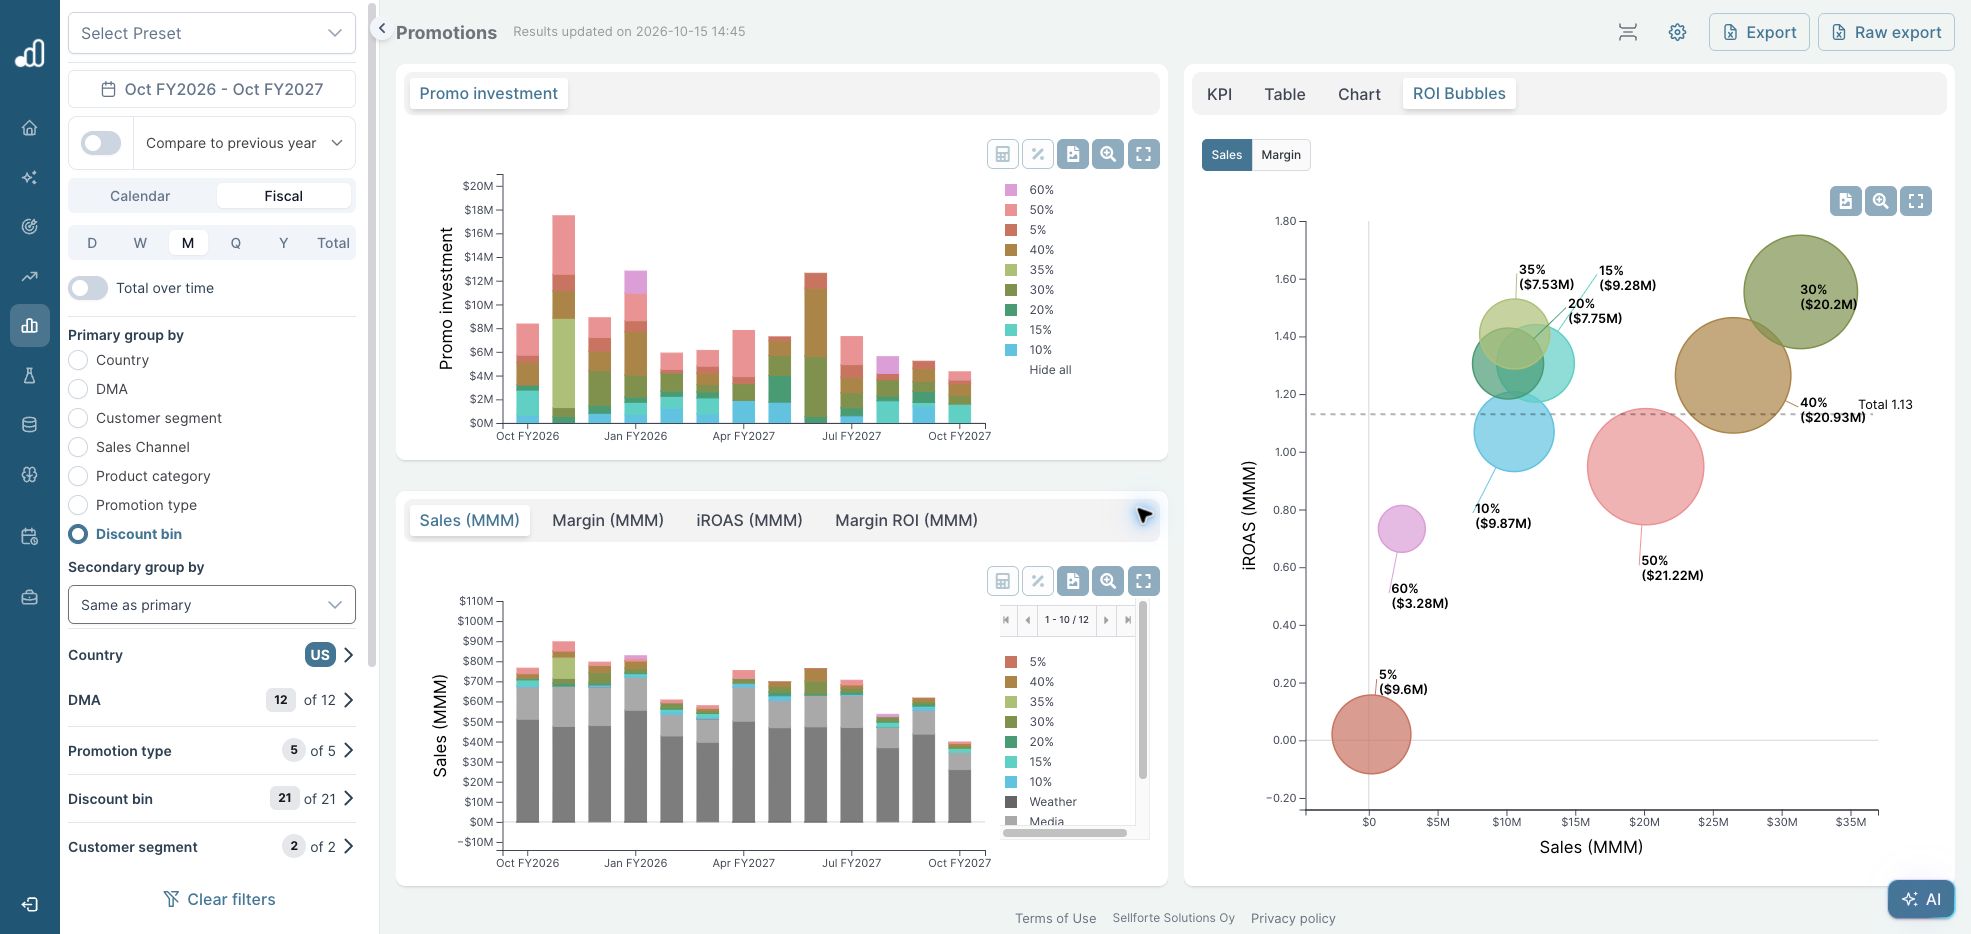
Start with how much discount investment each group receives
The top-left chart shows granted discount investment over time. For example, selling a $100 item for $80 represents $20 of discount investment. Summing that value across discounted transactions provides the investment measure used in the promotion analysis.
This makes it possible to compare the scale of different offers. A discount rate alone does not tell you how much value the business gave away: the number and value of eligible purchases matter too.
Use the sales bubbles to identify questions worth investigating
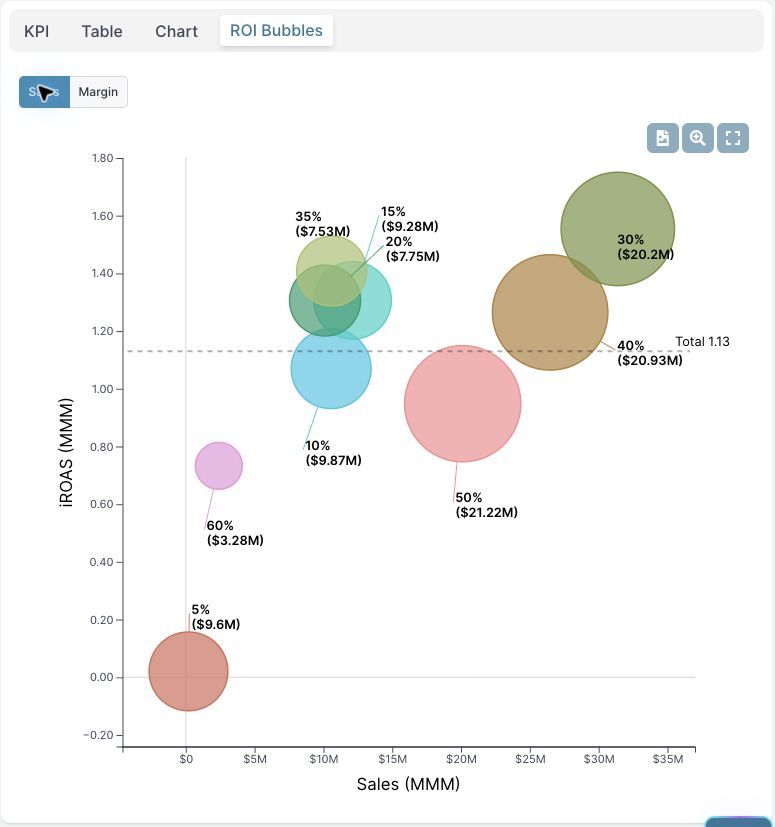
In this demo selection, the 30% group has about $20.2 million of investment and an iROAS near 1.55. The 50% group has slightly more investment, $21.22 million, but an iROAS near 0.95. The deeper discount generates less modeled incremental sales despite the similar investment.
That is a reason to investigate the 50% group. It does not establish 30% as the right discount for every product. The groups may contain different categories, clearance stock, customer segments, or promotion mechanics.
Also, a sales iROAS above 1 is not proof of profit. It means the measured incremental revenue exceeds the granted discount investment under that metric's definition. Product costs and the complete profit calculation still matter.
Switch to margin before making the commercial decision
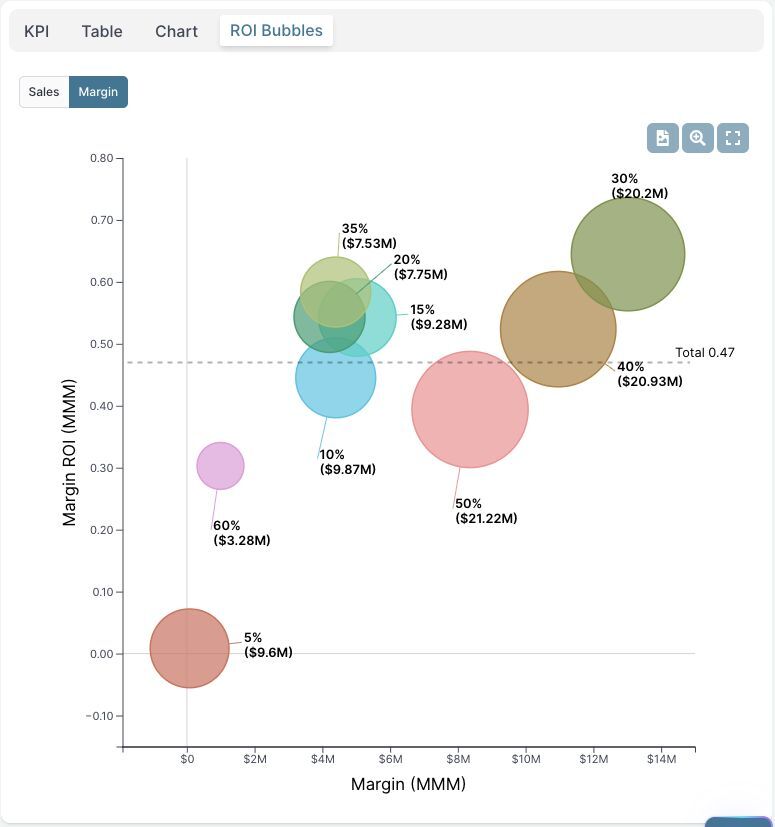
Review absolute incremental margin alongside its return on discount investment. A small offer may have an attractive ratio but contribute little total profit. A large offer may generate substantial revenue while consuming margin.
Confirm which costs your margin measure includes before calling an offer profitable. Where additional campaign costs sit outside that measure, reconcile them with finance. Margin analysis also depends on having suitable margin or cost data; revenue alone cannot establish the profit result.
5. Compare like-for-like offers before changing discount depth
Discount bins are a useful first view. The next step is to understand what sits inside them.
A permanent member discount, an acquisition voucher, and an end-of-season markdown can share the same percentage while serving different purposes. Compare performance within relevant product categories, markets, channels, customer groups, and promotion types, using the dimensions available in your data.
Record campaign names or promotion IDs in the transaction data if you want to distinguish individual events. A discount-depth field cannot, by itself, tell you whether a sale belongs to Black Friday or an ongoing loyalty program.
For a clearance campaign, the alternative may be holding aging stock and marking it down later. Evaluate that business case explicitly. For an acquisition offer, follow the acquired cohort's subsequent contribution profit and repeat purchases before assuming the initial margin loss will pay back.
Be cautious with groups containing few campaigns or little variation. A promising historical result is a candidate for testing. It does not guarantee that the same return will hold at a larger scale or on different products.
6. Evaluate promotions and media in the same measurement framework
Promotion periods often coincide with heavier advertising. An email announces the offer, paid social expands its reach, and search captures some of the resulting demand. Giving the whole sales increase to both the offer and the advertising overstates their combined effect.
Include promotional activity in the model used to evaluate media. Then make the scope of the decision explicit: are you estimating the effect of the discount with media held constant, or the effect of the whole campaign package?
Even with both drivers included, separating them is harder when they always move together. Examine how results change under reasonable modeling assumptions. Where the decision is material, use incrementality testing to create useful variation and use appropriate evidence in MMM calibration. A good fit to historical sales does not, on its own, prove that credit has been allocated correctly.
This also matters when considering whether to shift money from discounts into media. Historical average returns do not tell you what the next dollar will generate. For media, marginal incremental ROAS (miROAS) helps evaluate the return on an additional unit of spend. Compare feasible changes on a consistent profit basis and allow for changes in demand when an offer is reduced.
What data do you need for promotion analysis?
Build a record that connects the offer to the sales and costs it affects. The useful level of detail depends on the decision, but transaction or daily product-level records provide a stronger starting point than a monthly total.
- Sales and prices: date, units, net revenue, regular-price reference, realized price, and granted discount.
- Offer details: campaign ID, mechanic, eligibility, start and end dates, discount depth, and funding arrangements.
- Commercial context: product and category, store or country, sales channel, customer segment, inventory, and stockouts.
- Costs and returns: product cost or margin, cancellations, returns, shipping subsidies, and additional execution costs.
- Other demand drivers: paid and owned media activity, holidays, seasonality, and other relevant external factors.
Reconcile totals before comparing dashboards. If discount data covers only part of the business, filter the sales and media views to the same scope. Check for changes in discount coding and regular-price definitions, and distinguish missing values from genuine zero activity.
Keep both the early campaign read and a later review after returns and the relevant purchase cycle have matured. Document what changed between them.
Turn the analysis into the next promotion decision
A useful promotion review ends with a change to the next campaign. Record the result, the uncertainty, and the action together.
| Finding | Next action |
|---|---|
| Incremental contribution profit is positive and stable across comparable events. | Repeat or test a controlled expansion, with inventory and margin limits. |
| Sales grow but contribution profit falls. | Test a shallower discount, narrower eligibility, a different mechanic, or lower execution costs. |
| Most demand shifts from other products or nearby weeks. | Reduce frequency or redesign the offer; measure the wider business effect. |
| The offer supports clearance or acquisition rather than immediate profit. | Set an explicit objective, budget, and follow-up measure for that purpose. |
| Results depend heavily on assumptions or limited data. | Run a focused test before making a large commitment. |
Bring commercial, ecommerce, marketing, and finance teams into the same review. Agree the regular-price reference, the no-promotion comparison, and the cost boundary before debating which offer performed best.
You can explore the views used here in the Sellforte Promotions demo, or book a walkthrough to discuss how the analysis would work with your promotion and margin data.
Frequently asked questions
How do you calculate promotion uplift?
Subtract estimated sales without the promotion from sales with the promotion over the same scope and period. Divide that difference by estimated sales without the promotion to express uplift as a percentage. State whether you are measuring units, revenue, or profit; a discount can produce very different results across those measures.
What is a good promotion ROI?
There is no universal number. It depends on the return definition, product economics, campaign objective, and alternative use of the investment. For a profit-led campaign, require positive incremental contribution profit after relevant costs and assess whether the return justifies the risk and resources involved.
How long after a promotion should you measure performance?
Long enough to observe returns and the purchase cycle affected by the offer. A frequently purchased grocery item and an infrequently purchased durable product need different windows. Use an early read for operational decisions and a later review for the final commercial assessment.
Further Reading and Resources
Explore the dashboard, validate incremental effects, and compare the returns from different uses of your budget.
Promotion measurement
Asked by Marketers
Incrementality and model validation
Comparing investment decisions
About the author

Lauri Potka is the Chief Operating Officer at Sellforte, with over 15 years of experience in Marketing Mix Modeling, marketing measurement and media spend optimization. Before joining Sellforte, he worked as a management consultant at the Boston Consulting Group, advising some of the world’s largest advertisers on marketing optimization. Follow Lauri on LinkedIn.

How should MMM distinguish dynamic pricing from genuine promotions?

The Missing 24%: Why MMM Without Promotions Behaves Like Last-Click