

OTT measurement tracks the delivery and business impact of streaming advertising. For connected TV (CTV), that means understanding who the ads reached, which visits and purchases were linked to exposure, and how many sales the advertising actually caused.
Those questions need different evidence. A viewer can watch an ad on the living-room TV, search for the brand on a phone, and buy in a store days later. Click reporting will miss much of that journey. Household attribution can connect some of it, but a matched purchase may have happened without the ad.
This guide explains which OTT and CTV metrics to use, how attribution works, and how experiments and Marketing Mix Modeling (MMM) help turn campaign reporting into budget decisions.
What is the difference between OTT and CTV measurement?
OTT, or over-the-top, describes video delivered over the internet. It can be watched on a television, phone, tablet, or computer. CTV describes the connected television screen, including smart TVs and televisions connected through streaming devices. The IAB’s streaming video playbook explains this distinction.
An “OTT campaign” may therefore contain several device types. Ask for the inventory breakdown before comparing results. A mobile video placement with a clickable ad and a television placement without one create different opportunities for response and tracking.
Keep CTV, linear TV, and other online video identifiable in your data. Streaming a live program on a connected television is still CTV delivery; the fact that the program is live does not make it a traditional broadcast placement.
Which OTT and CTV metrics should you track?
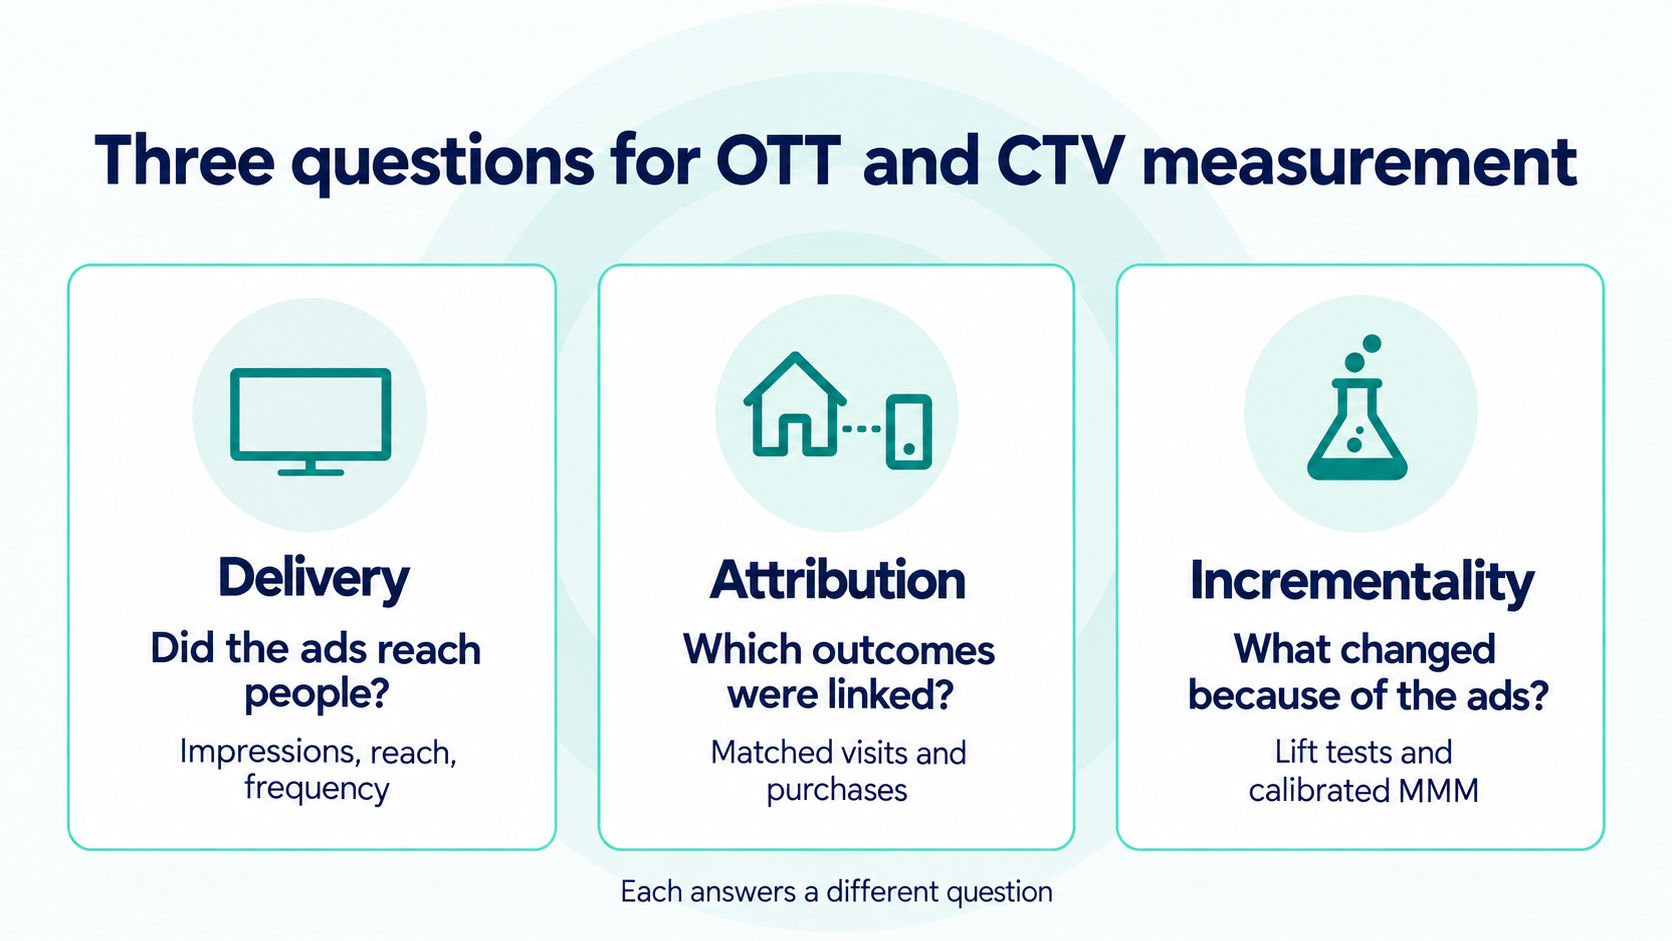
Start with the decision you need to make. Delivery metrics help assess the media buy. Attribution reports help diagnose response. Incrementality measurement estimates how outcomes changed because of the advertising.
| Metric | What to look for |
|---|---|
| Impressions and CPM | How much eligible ad delivery you bought, and its cost. Check the impression definition and invalid-traffic filtering. |
| Reach and frequency | How widely and repeatedly ads were delivered. Confirm whether the unit is a device, household, or estimated person. |
| Video completion rate | How often playback reached the end. Completion does not establish attention, persuasion, or sales impact. |
| Attributed conversions and ROAS | Outcomes linked to exposure under the provider’s matching and attribution rules. Read them alongside the lookback window and sales coverage. |
| Brand lift | Differences in awareness, recall, consideration, or other surveyed attitudes under the study’s control design. |
| Incremental sales and iROAS | Estimated additional sales and revenue per additional advertising dollar, with uncertainty and the measurement scope stated. |
For delivery quality, ask how the provider handles televisions being switched off while a streaming device continues playing, and how it accounts for multiple people watching the same screen. The IAB’s Anatomy of a Video Impression describes why these issues complicate CTV reporting.
Do not add publisher reach figures together and call the result unique reach. The same household may appear in several reports. Incremental reach also has a specific meaning: people or households reached beyond another media buy. It does not mean incremental sales.
If the campaign’s immediate objective is awareness, a brand lift study can address that objective directly. Report it as a change in surveyed attitudes. A rise in awareness is not itself a financial return.
How does CTV attribution work without clicks?
CTV attribution links an ad exposure to a later event, such as a website visit or purchase, using the identifiers and matching methods available to the provider. The connection may span a TV and a phone or laptop. Google’s CTV cross-device measurement documentation gives one example of how an advertising platform reports these outcomes.
When reviewing an attribution report, establish four things:
- The matching unit. Is the outcome associated with a person, account, device, or household? A household match does not prove that the purchaser watched the ad.
- The lookback window. How long after an impression can a purchase be credited? Longer windows create more opportunities to match purchases that would have happened anyway.
- The outcome coverage. Does the report include the web store only, or also apps, physical stores, and marketplaces? What share of outcomes can be matched?
- The credit rules. Can another publisher, paid search platform, or social campaign also claim the same purchase?
A conversion API can improve the flow of purchase events from an advertiser to a platform. The IAB’s CTV conversion API guide discusses this approach. Better event coverage is useful, but the presence of a server-side connection does not establish that an ad caused a purchase.
QR codes and dedicated landing pages can also capture direct responses. Treat those responses as one observable part of the campaign. People who remember the brand and return later through search will follow a different path.
Why view-through ROAS can overstate the contribution
Suppose a campaign reaches existing customers who already shop regularly. Many will purchase during the attribution window. The report may correctly link their households to an impression while leaving the causal question unanswered: how much would they have bought without the campaign?
Audience selection, overlapping channels, and attribution windows all affect that answer. Use view-through reporting to investigate patterns and implementation problems. Validate the business contribution with a credible comparison. Our guide to incremental attribution explains how those two kinds of evidence fit together.
Controlled experiments and Marketing Mix Modeling offer complementary ways to estimate CTV’s incremental sales impact. Experiments test the effect of a defined change in advertising. MMM estimates CTV’s contribution over time alongside other media and business drivers, subject to the available data and model assumptions. Experimental results can also help calibrate the model and improve future budget decisions.
How to measure CTV incrementality with experiments
An incrementality test creates a comparison between advertising and a defined alternative. That alternative might be no CTV activity, the existing CTV budget, or a different spending level. Choose it to match the decision you are making.
In a randomized audience experiment, eligible people or households are assigned to treatment and control groups before the campaign. A valid design needs to account for shared televisions and exposure across devices. Simply comparing people who happened to see an ad with people who did not is vulnerable to selection bias.
In a geo experiment, advertising differs across selected regions. The analysis uses suitable control regions and historical patterns to estimate what would have happened in the treatment regions without that change. Geographic outcomes can include sales that are difficult to match to individual ad exposures. See our guide to conducting a geo-lift experiment and Google’s explanation of conversion lift measurement.
Make the test answer the right question
A common planning problem is that CTV launches alongside YouTube, social, and audio, with all four switched off in the control regions. That design can measure the combined campaign. It cannot assign the entire measured lift to CTV.
To estimate CTV’s contribution at the tested spending level, vary CTV while keeping the rules for other planned media and commercial activity consistent across groups. Monitor unintended differences, such as a regional promotion or store closure. If paid search responds to demand created by CTV, decide in advance how to interpret that response and any associated cost. Removing every downstream search effect can remove part of the impact you intended to measure.
The sales boundary matters just as much. A brand selling through its own website, marketplaces, and stores needs to decide which of those outcomes the test can observe. A web-only study cannot establish the campaign’s total retail impact. Our Asked by Marketers discussion on full sales impact covers this issue in more detail.
Check feasibility before committing the budget
Historical sales totals by region are not enough on their own. You need a consistent time series to examine pre-campaign trends, volatility, and the comparability of treatment and control regions. Differences in product mix, store coverage, promotions, and stock availability may affect the design.
Agree on the primary outcome, required data, detectable effect, campaign duration, and follow-up period before launch. Choose the follow-up window with the purchase cycle and delayed response in mind. Our article on measuring sales after an incrementality test explains why the campaign end date is not always the right measurement end date.
Report uncertainty around the result. An estimate that is too imprecise to distinguish a profitable effect from an unprofitable one may not settle the budget decision. A test that does not detect lift is not automatically evidence of zero impact.
A worked example: 6x attributed ROAS and 2.4x incremental ROAS
Consider a hypothetical CTV campaign with $100,000 of spend. Its attribution report credits $600,000 of revenue, giving an attributed ROAS of 6x.
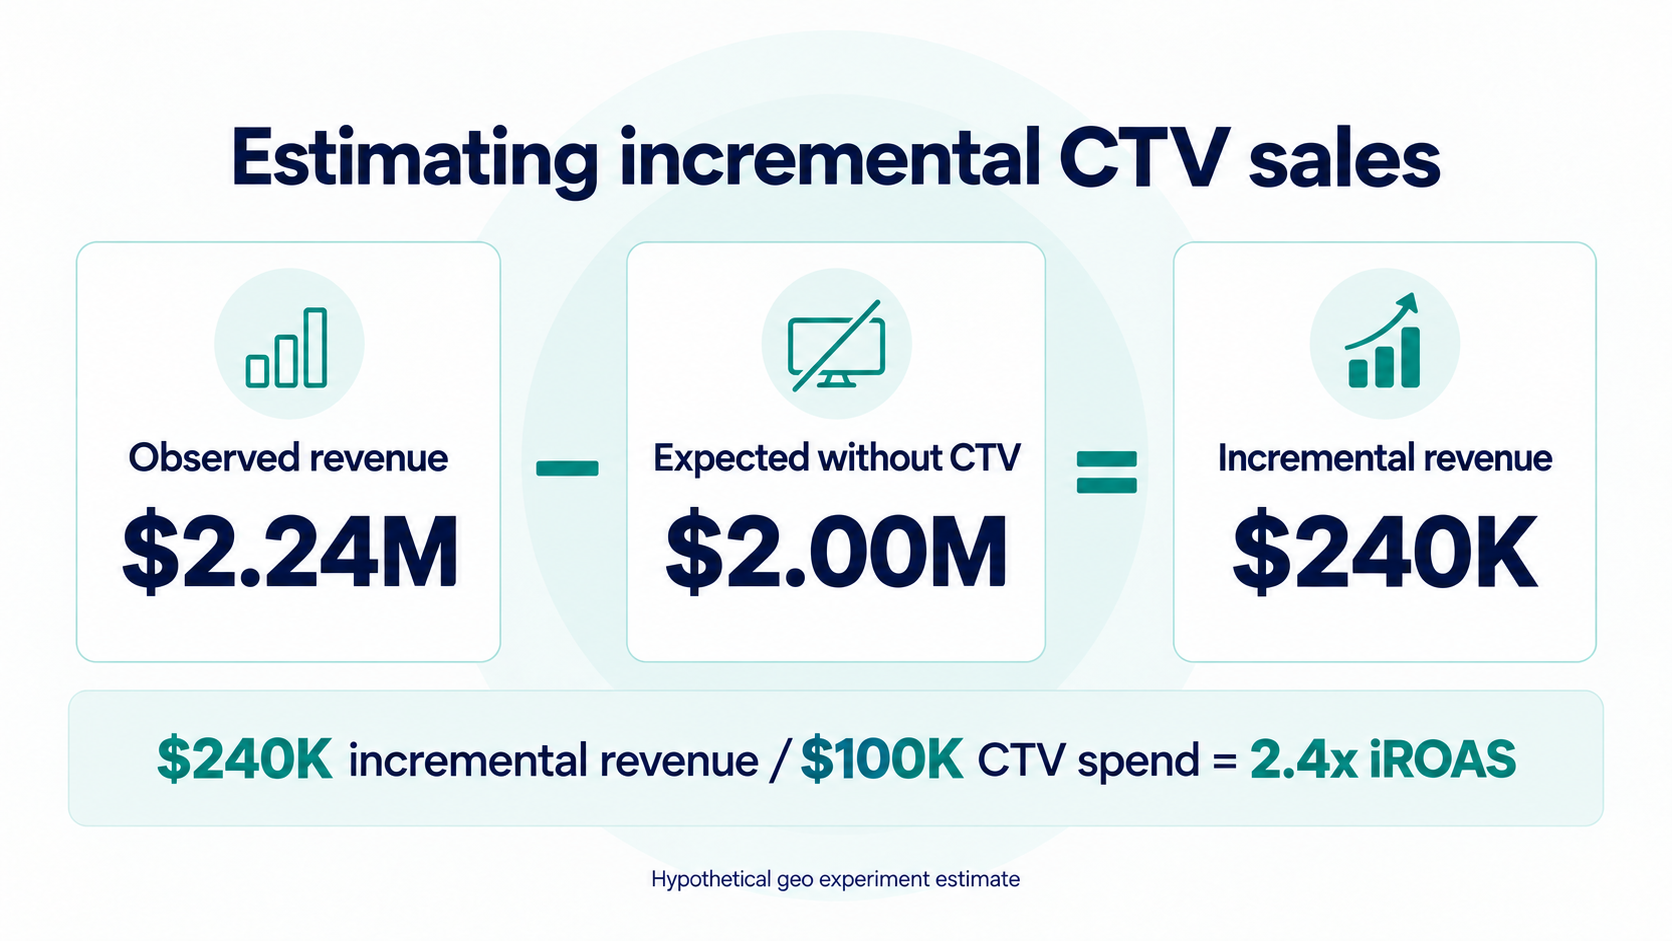
A separate geo experiment varies CTV alone. Within the treatment regions and agreed measurement period, observed net revenue is $2.24 million. The experiment estimates that those same regions would have generated $2.00 million without the campaign. This counterfactual is adjusted to the treatment regions; it is not simply the raw sales total from a differently sized control group.
| Calculation | Result |
|---|---|
| Attributed ROAS: $600,000 ÷ $100,000 | 6.0x |
| Incremental revenue: $2,240,000 − $2,000,000 | $240,000 |
| Revenue lift: $240,000 ÷ $2,000,000 | 12% |
| Incremental ROAS: $240,000 ÷ $100,000 | 2.4x |
These figures answer different questions. The attribution report links purchases to exposure. The experiment estimates additional revenue against a counterfactual. It does not follow that the ratio between them will stay constant in the next campaign.
The iROAS denominator here is $100,000 because the comparison has no CTV spend and other relevant media costs are assumed unchanged. In a test comparing two spending levels, use the additional cost between them. Google’s geo-lift reporting guidance explains incremental conversion value, incremental cost, and the uncertainty around these estimates.
Profit adds another consideration. If the incremental revenue carries a 40% contribution margin before media, $240,000 generates $96,000 of contribution. After $100,000 of media spend, that is a $4,000 shortfall, before any additional creative or agency costs. Under those assumptions, the revenue iROAS needed to cover media is 1 ÷ 40%, or 2.5x.
A real report would show the estimate’s uncertainty as well as the margin assumptions. A positive revenue effect alone is not enough to justify scaling.
How to estimate CTV’s sales contribution with MMM
Experiments answer a defined question for a particular campaign, audience, geography, and period. Marketing Mix Modeling helps assess CTV alongside the rest of the media mix over time, using aggregate sales, media activity, and other business drivers.
For a useful CTV analysis, the model needs more than a line called “video spend.” Supply consistent activity data by period, geography where available, and channel. Document changes in publisher mix, campaign purpose, and inventory. Include relevant non-media drivers such as pricing, promotions, distribution, seasonality, and stock constraints.
Separate CTV from linear TV and other online video when the data supports it. If those channels always increase and decrease together, the model may struggle to identify their individual effects. A detailed-looking output does not resolve that underlying limitation.
MMM can represent delayed advertising effects, but an estimated carryover curve is not proof that a particular ad caused a particular later order. It also does not deduplicate individual viewers across publishers. Those are different measurement tasks.
Use experiments to inform the model
A well-designed CTV lift test can help constrain the channel’s modeled contribution through MMM calibration. Google’s Meridian documentation on ROI priors and calibration describes how experimental evidence can inform a model.
Match the evidence carefully. A CTV-only test using total net sales has a different scope from a platform study using matched web purchases. A combined upper-funnel experiment should not become a CTV-only calibration input. Preserve the test’s uncertainty and consider how relevant its period, geography, and spending level are to the model.
Our Asked by Marketers article on combining geo-lift, conversion lift, and MMM explains why these results should be reconciled by scope rather than averaged together.
When deciding whether to increase spend, look beyond the campaign’s historical average return. Marginal incremental ROAS (miROAS) estimates the return on additional spend. A CTV campaign can have an attractive average iROAS while its next dollar is less productive than another available investment.
What to agree before the next CTV campaign
A short measurement brief can prevent a long argument after the results arrive. Record the following before launch:
- The decision. Are you evaluating a first CTV investment, increasing the budget, changing inventory, or testing creative?
- The outcome. Define awareness, net sales, new customers, or contribution margin, including which sales channels and products are covered.
- The reporting rules. Document impression quality, reach units, attribution windows, matching coverage, and overlapping credit.
- The comparison. Specify what changes in treatment and control, which other activities remain consistent, and what could contaminate the test.
- The decision threshold. Set the required economic return, acceptable uncertainty, and the evidence needed to increase, maintain, or reduce spend.
Sellforte combines Marketing Mix Modeling with incrementality experiments to support these decisions. For CTV, the useful starting point is a shared definition of the sales outcome and a review of the available media and geographic data. That establishes what can be measured separately and where a dedicated test would improve the evidence.
Frequently asked questions
Can you measure CTV without clicks?
Yes. Experiments and MMM can estimate business effects without requiring each purchase to be matched to a clicked ad.
What is a good CTV ROAS?
There is no universal threshold. First establish whether the figure is attributed ROAS or incremental ROAS. Then compare incremental revenue with contribution margin and all relevant costs. In the example above, a 40% contribution margin requires 2.5x revenue iROAS to cover media alone.
Can MMM isolate CTV from other video channels?
Yes. To do it well, you need high quality data with variation in spend. When CTV always moves with other video activity, separating it from other activity becomes harder.
Further Reading and Resources
Explore the measurement methods, test design choices, and budget decisions behind effective streaming advertising.
Measuring streaming and upper-funnel advertising
Designing and interpreting lift tests
Using the evidence in budget decisions
About the author

Lauri Potka is the Chief Operating Officer at Sellforte, with over 15 years of experience in Marketing Mix Modeling, marketing measurement and media spend optimization. Before joining Sellforte, he worked as a management consultant at the Boston Consulting Group, advising some of the world’s largest advertisers on marketing optimization. Follow Lauri on LinkedIn.

How much should I invest in media overall?

How should we weight multiple incrementality tests when calibrating an MMM?