

The short answer
Start with the spend that has the lowest marginal incremental ROAS instead of cutting the same percentage everywhere. Response curves show which reductions put the least incremental sales at risk, while business constraints keep the plan realistic. If the cut is mandatory, you can also use selected reductions as controlled tests and learn something useful for the next budget round.
This article is part of Asked by Marketers, a series answering real questions from marketing leaders.
Sellforte's team holds more than 1,450 meetings each year with marketing leaders in Ecommerce and Retail about Marketing Mix Modeling and incrementality testing. Each week, we anonymize at least one question from those conversations and answer it in depth, based on what marketers are actually struggling with, not what keyword tools suggest. About the series →
Why do marketers ask this?
It's unfortunate but inevitable. We've worked with more than a hundred retailers and ecommerce businesses over the years, and this happens in every business at some point. One day, finance will call and ask you to reduce media spend for the next month, quarter, or year.
Marketing budget cuts are seldom clean optimization exercises. Finance may set the total reduction, the quarter when it must happen, or even how much must come from brand and performance marketing. Marketing then has to decide where the cut lands, sometimes with only days to act.
A proportional haircut can look fair: take 10% or 20% from every channel, market, and campaign. Everyone shares the pain. The problem is that this usually sacrifices more growth than necessary because each investment sits at a different point on its response curve. Some are highly saturated. Others still generate strong incremental sales from the next dollar.
Which marketing budget should you cut first?
Cut the investment pockets with the lowest marginal incremental ROAS first, subject to business constraints. Marginal incremental ROAS estimates the incremental sales generated by the last dollar currently invested. When you reduce a budget, it approximates the incremental sales you put at risk by removing that dollar.
This is different from average incremental ROAS:
Average incremental ROAS = total incremental sales / total spend
Marginal incremental ROAS = change in incremental sales / change in spend at the current investment level
A channel can have a strong historical average and still be the right place to cut if its current investment is far into saturation. The reverse is also possible. A smaller channel may have a modest average but a high marginal return because its next dollars still reach valuable customers efficiently.
The calculation uses response curves estimated with Marketing Mix Modeling and calibrated with incrementality evidence. For each channel, the curve estimates how incremental sales change as spend rises or falls. The image below shows a response curve in the Sellforte platform.
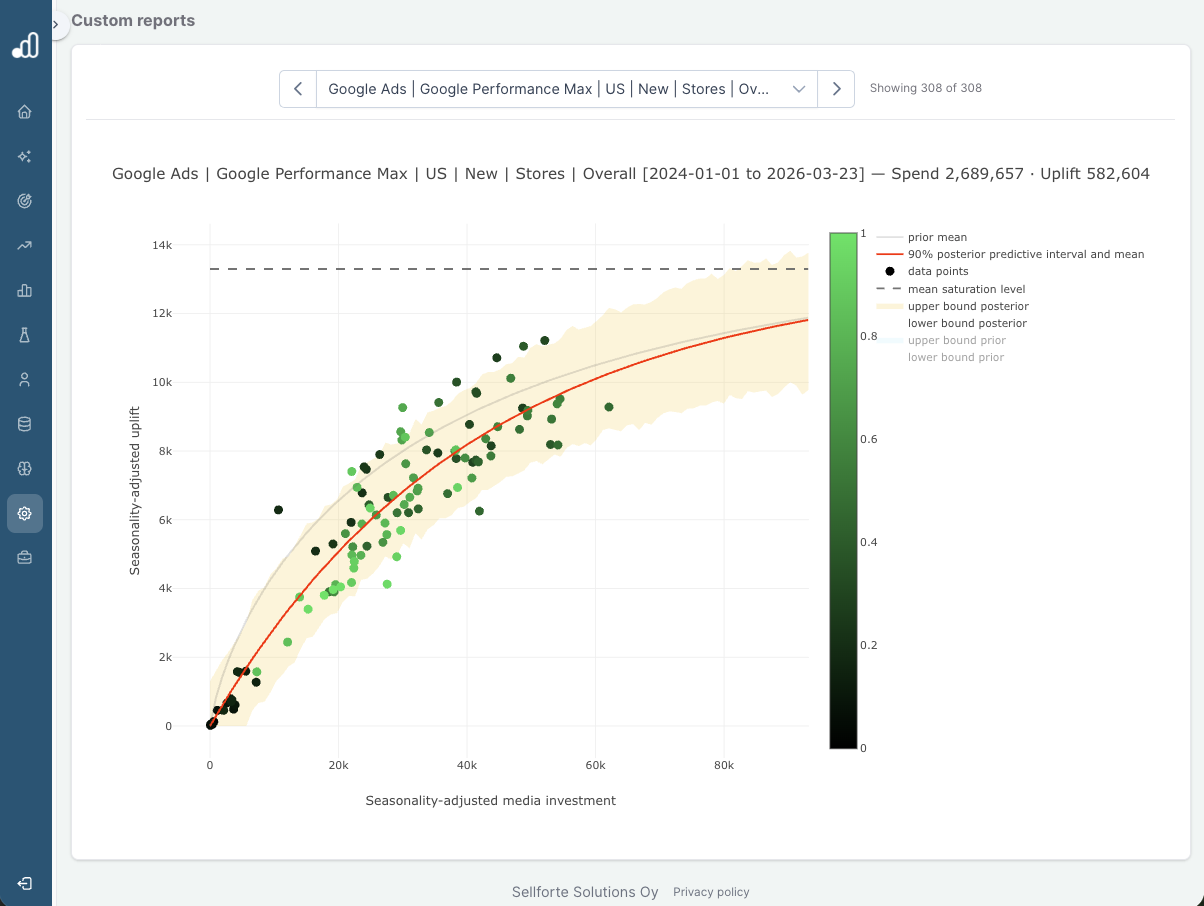
An optimizer starts by removing a small amount from the channels with the lowest miROAS, moving their spend to the left on the response curve. It then recalculates the marginal returns and repeats the process until it reaches the required reduction. You need that recalculation at every step. Remove a large amount from one channel and it becomes less saturated, which raises its marginal return. Its next dollar must then be compared again with every other investment pocket.
For more background, see Why diminishing returns matter in marketing planning and How to set a target ROAS that reflects true incrementality.
What constraints should the budget optimization respect?
The optimization has to reflect how the business actually operates. A model might suggest moving every dollar into one market or switching off an entire channel. In practice, the plan needs limits that account for strategy, economics, and what the team can execute.
Start by defining the following constraints:
-
Specify how much you must remove and whether you are trying to maximize revenue, contribution margin, profit, new customers, or another outcome.
-
Keep peak trading weeks, product launches, committed media, and other moments where an interruption would create disproportionate risk out of scope.
-
Account for the economics of each market. An iROAS of 3 can be attractive in one country and unprofitable in another because margins, cancellations, and return rates differ. Judge each market against its own required return.
-
Set minimum and maximum investment levels. Some channels need a minimum budget to function. Others cannot absorb a large reallocation without losing efficiency.
-
Protect activity that acquires new customers, supports a market entry, or creates delayed sales unless the optimization KPI already captures those strategic growth effects.
-
Respect organizational boundaries. If finance has set separate reductions for brand and performance, optimize within those pools. Do not assume every euro can move freely.
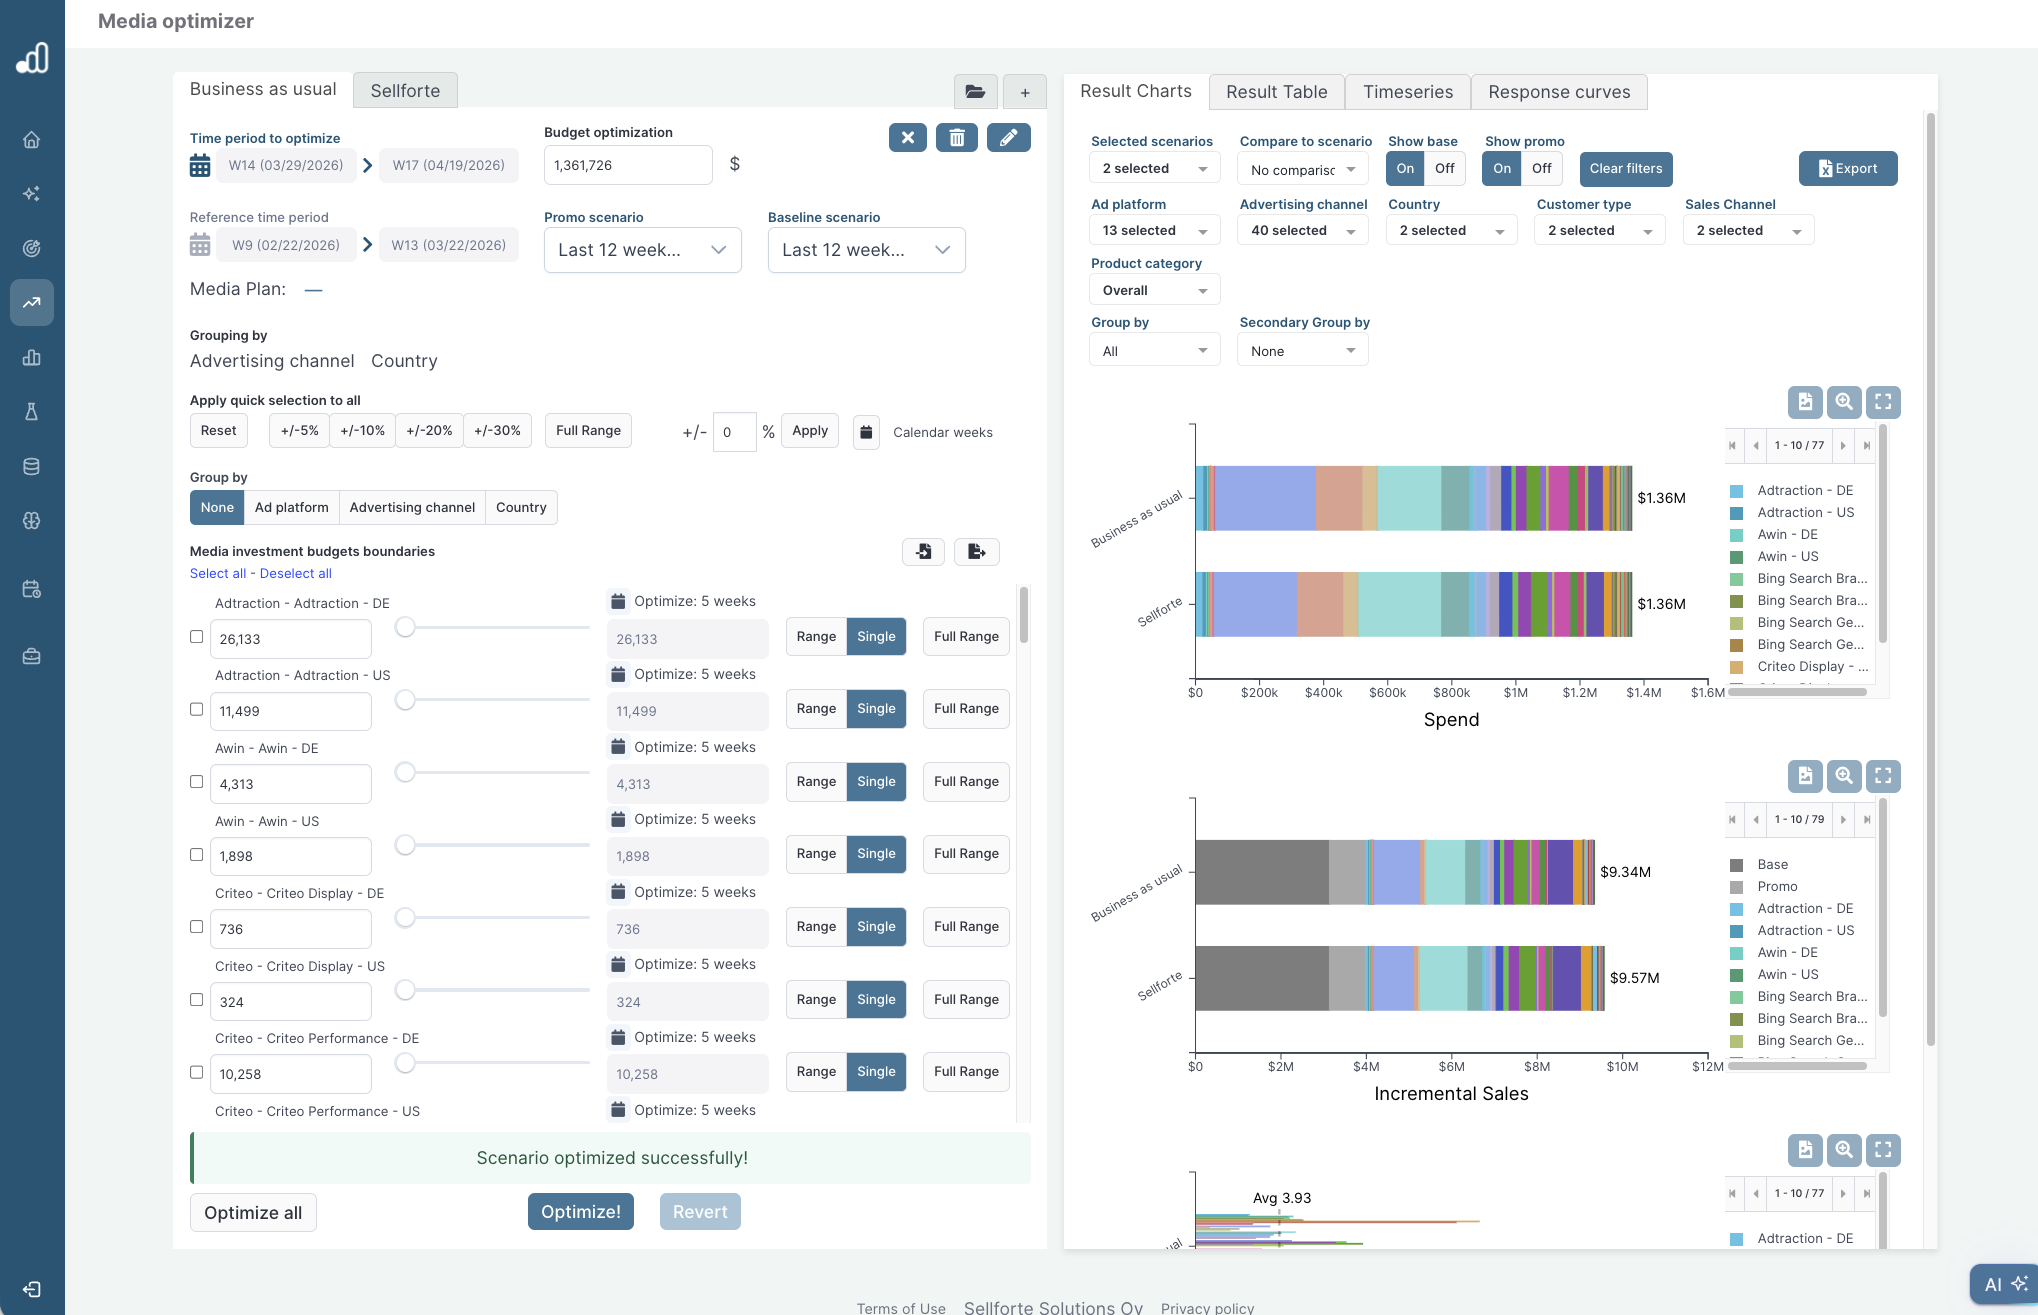
Taking all of this into account requires a scenario-planning tool with advanced configuration. The screenshot below shows how a multi-constraint optimizer can look in Sellforte.
Do not cut brand marketing first just because its iROAS looks lower when you measure only immediate sales effects. A brand campaign may generate delayed sales or bring in new customers who continue to buy over their lifetime. Measure the full effect over the right time horizon before reducing mid-funnel or top-of-funnel spend. Our first Asked by Marketers article explains how MMM and incrementality testing measure the full sales impact of mid-funnel and top-of-funnel campaigns.
Sellforte Research: How much can optimization reduce the sales impact of a budget cut?
We used Sellforte Optimizer to simulate a 20% media budget cut across 12 anonymized ecommerce companies. Average annual revenue in the sample was $288 million. The simulations used company-specific response curves estimated from each company's data.
In the first scenario, we reduced every channel budget by 20%. The median change in media-driven sales was -14.7%, with the first quartile at -15.5% and the third quartile at -13.1%.
In the second scenario, total spend fell by the same 20%, but Sellforte Optimizer allocated the reduced budget across channels using response curves and marginal incremental ROAS. The median change in media-driven sales was -7.3%, with the first quartile at -9.1% and the third quartile at -5.6%. The median sales decline was about 51% smaller than with equal channel cuts.
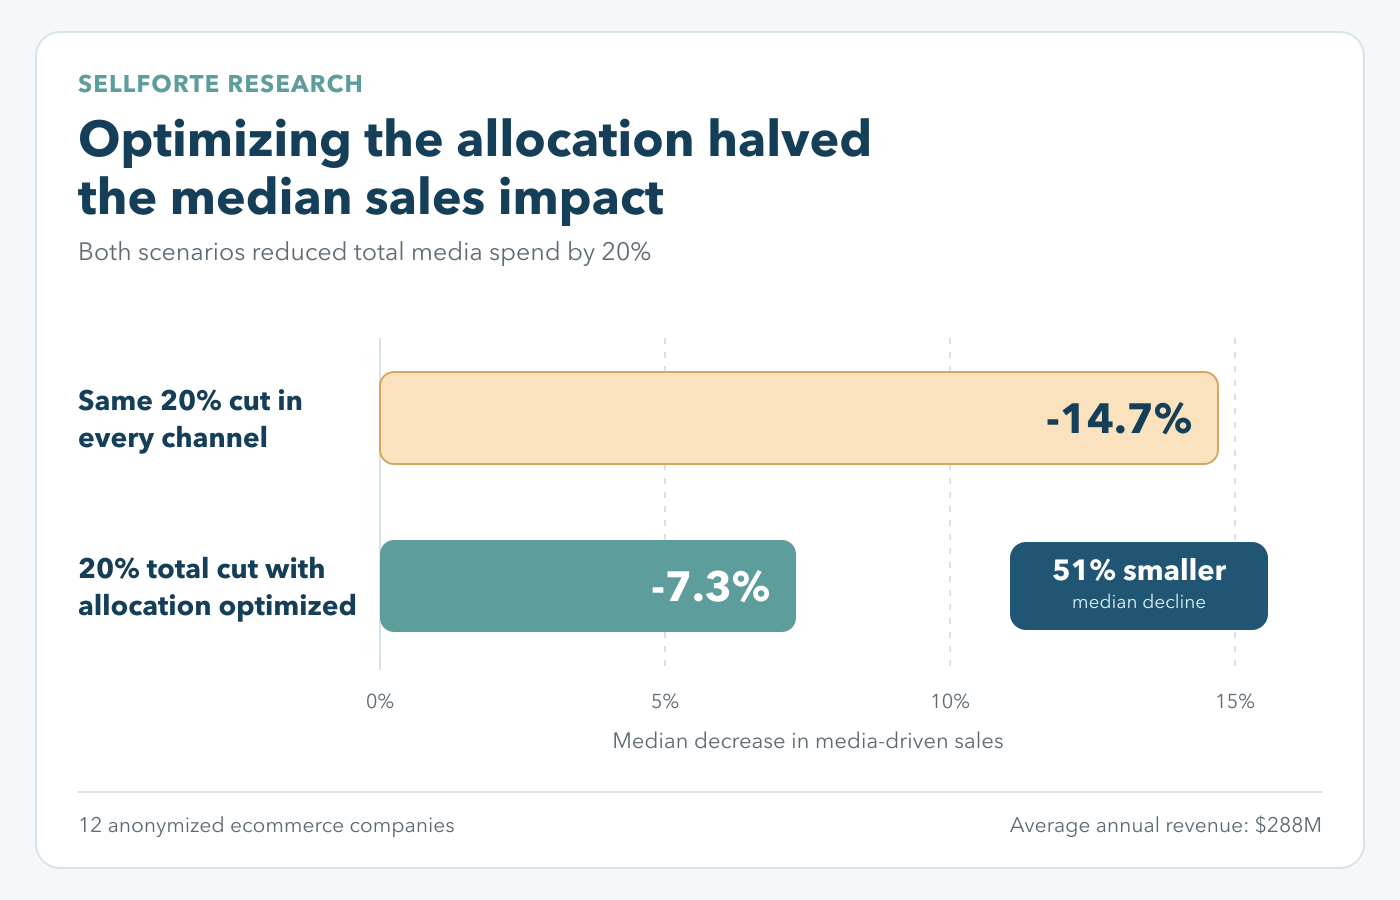
These are median simulated outcomes from a 12-company sample, not a universal benchmark. Results for any advertiser will depend on its starting allocation, channel saturation, business constraints, and response curves.
How this looks in practice
Consider a hypothetical ecommerce business with $100 million in annual revenue and a $10 million media budget. Separate Sellforte research found that media drove an average 43% of revenue across 15 ecommerce and DTC brands. Using that average, the hypothetical business would have $43 million in media-driven sales. Finance requires a 20% budget reduction, so marketing must remove $2 million.
Scenario 1: cut every channel by 20%. Applying the Sellforte Research median, media-driven sales fall by 14.7%, or approximately $6.3 million. The plan is easy to explain, but it ignores saturation and the different marginal returns across channels.
Scenario 2: reduce total spend by 20% and optimize the allocation. The team uses response curves and marginal incremental ROAS to decide where the cuts should land. Applying the Sellforte Research median, media-driven sales fall by 7.3%, or approximately $3.1 million.
Both scenarios deliver the full $2 million saving. Applying the Sellforte Research medians, the optimized allocation protects approximately $3.2 million more in media-driven sales and reduces the simulated sales loss by about 51%.
How can a mandatory budget cut create a learning opportunity?
Turn selected reductions into incrementality tests by preserving a credible counterfactual. If the business has to reduce spend anyway, a controlled design can show how much incremental sales were lost for each dollar saved. The result can inform the current decision and the next planning cycle.
A workable design usually includes:
-
Concentrate the reduction enough to create a clear treatment and a measurable signal. A shallow cut across every campaign may save the same amount but teach the business very little.
-
Keep normal spend in comparable control regions or audiences and compare their sales trajectory with the treated group. In a geo test, the groups need similar historical behavior and enough sales volume for statistical power.
-
Define the outcomes and timing in advance. Decide which sales, profit, customer, or lead metrics matter and how long you will observe delayed effects.
-
Check treatment integrity. Confirm that spend changed as planned and that no other major commercial actions differed between treatment and control.
-
Agree on a decision rule in advance, including when the evidence will lead you to restore, reduce, or reallocate spend.
A total marketing blackout is rarely the best design. It cannot isolate individual channels and may cause unnecessary sales loss. Channel-level geo tests, conversion-lift studies, or staged budget changes usually tell you more. An urgent reduction may leave no time for a perfect setup, though. In that case, well-chosen control regions can turn a blunt operational decision into a useful first data point.
The cut may also introduce variation that improves the Marketing Mix Model. Historical budgets often change too little to reveal the shape of response curves with confidence. A measured reduction adds evidence about the scale-down side of the curve and can show whether the previous investment was saturated, efficient, or too low.
How should you monitor and adjust the cuts?
Monitor the spend you save alongside the incremental outcomes you lose, and give the effect time to develop. A marketing cut can look harmless for the first few days. Adstock, existing demand, and customers already in the purchase journey may support sales for a while.
Track these four measures:
-
Check spend delivery. Did every treatment market and platform make the intended reduction?
-
Compare incremental sales or profit with the counterfactual. How far did actual performance fall below it, and what incremental return does that imply for the spend you removed?
-
Watch new-customer and lead volume for signs that the cut is weakening future demand before you can see the effect in total sales.
-
Assess confidence and stability. Is the estimate mature enough to support a decision, or does normal weekly variation still exceed the measured effect?
Use guardrails instead of a fixed waiting period. For example, restore spend if the lost incremental contribution margin exceeds the required savings or a strategically protected acquisition KPI breaches its threshold. If the cut causes little measurable loss, keep it and test whether some of the saved budget belongs in an opportunity with a higher marginal return.
The old budget does not need to be defended at all costs. A cut may expose genuinely inefficient spending. The team still needs to distinguish between savings that remove waste and savings that trade a lower marketing expense for an even larger loss in sales or profit.
Related questions
Why not cut every marketing channel by the same percentage?
Because a proportional cut ignores diminishing returns. Some investments are saturated and can be reduced with limited sales loss. Others still produce high marginal returns. One percentage may be simple to administer, but it rarely minimizes the loss in growth.
What is the difference between incremental ROAS and marginal incremental ROAS?
Incremental ROAS usually describes the average causal sales return across an investment. Marginal incremental ROAS estimates the return from a small change at the current spend level. Because a budget increase or cut changes spend at the margin, that is the measure to use for the decision.
Should brand marketing be cut before performance marketing?
No. First compare the full incremental value of both, including delayed sales and customer acquisition, and then optimize within the financial constraints. Immediate platform ROAS alone will usually make brand activity look weaker than it is.
How large should a marketing holdout be?
It needs to create a detectable sales difference without exposing the business to unnecessary risk. The right size depends on baseline sales, market similarity, spend, expected effect, and test duration. Use a statistical power assessment, not a universal percentage.
How Sellforte helps
Sellforte uses Marketing Mix Modeling, response curves, incrementality testing, and scenario planning to find budget reductions that put the least incremental sales or profit at risk. Teams can apply their actual business constraints, compare cut scenarios, and use planned changes as evidence for the next allocation decision. Book a demo.
Authors

Lauri Potka is the Chief Operating Officer at Sellforte and has over 15 years of experience in Marketing Mix Modeling, marketing measurement, and media spend optimization. Before joining Sellforte, he worked as a management consultant at the Boston Consulting Group, advising some of the world's largest advertisers on data-driven marketing optimization. Follow Lauri on LinkedIn, where he is one of the leading voices in MMM and marketing measurement.

Why do platform ROAS and incremental ROAS tell such different stories?

Can you trust a generic AI to do reliable media spend optimization with raw marketing data?