
The Model Validation view lets you check how well your Sellforte model reproduces your actual sales, and how much you can rely on its results for planning. This article explains two things that are easy to confuse, evaluating the model and validating it, what each metric means, which to rely on and when, and how to judge whether a model is performing well.
How to open the Model Validation view: In the left-hand navigation, go to Model → Validation. Not a customer yet? You can explore the view in our demo.
Evaluation vs. validation
These are two related but distinct questions.
Evaluation asks whether the model is statistically sound and plausible: does it fit the data well (R², MAPE), has the estimation settled, and does the split of sales across channels make business sense? All of this is done inside the model, using the data it was trained on.
Validation asks whether the model's conclusions hold up outside the model: do its predictions hold on data it has not seen, and does the effect it attributes to a channel match what a controlled experiment shows?
The distinction matters because a model can look good on evaluation (a high R², a clean fit) and still get the causal attribution wrong. The classic example: marketing budgets are often increased in Q4, exactly when sales are already high for seasonal reasons. Spend and sales then move together for reasons that have nothing to do with cause and effect, and a model can fit that pattern beautifully while over-crediting the channel. That is why a strong fit is necessary but not sufficient, and why we also validate against evidence from outside the model.
The Model Validation view
The view has two tabs: Timeseries, which plots the model against actual sales over time, and Validation metrics table, which lists the metrics broken down by segment.
Across the top of the view you can:
- Select a date range.
- Group the results by day, week, month, quarter, or year.
- Choose the model version.
- Toggle Show diff and Include base decomposition.
- Filter by the model's dimensions, such as Country and Customer type.
In-sample vs. actual
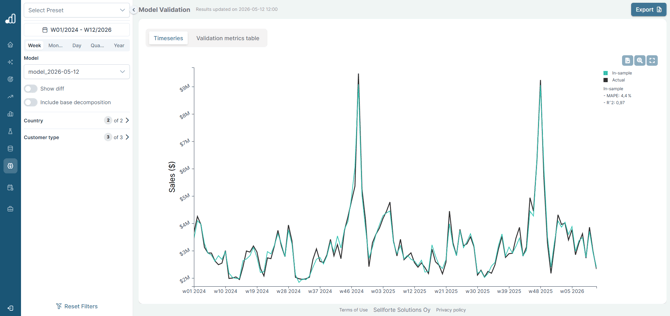
The line chart compares in-sample sales against actual sales.
In-sample is the model's estimate of total sales based on investment data and the historical performance of media. When the model is trained, it learns a set of parameters for each media describing how effective that media is. Those parameters are plugged back into the model equation to produce estimated sales, which is the in-sample line. In short, in-sample is the model's predicted sales based on the parameters it has learned. The closer the in-sample line tracks the actual line, the better the model reproduces your sales.
Show diff
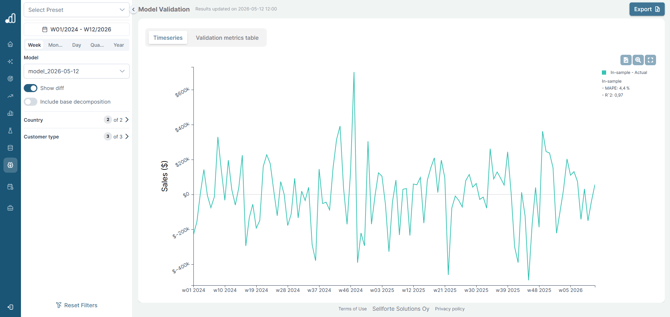
With Show diff on, the chart plots the difference between in-sample and actual sales (the residual) around a zero line, instead of the two separate lines. This makes it easy to see exactly where and when the model runs above or below actual sales.
Include base decomposition
With Include base decomposition on, the view adds the model's baseline: the sales the model attributes to underlying organic demand rather than to marketing. This lets you see the split between baseline and marketing-driven sales alongside the fit.
Evaluation: reading the fit metrics
The comparison between in-sample and actual sales produces the validation metrics. The Validation metrics table shows these for each segment, alongside total actual sales for context.

R²
R² (the coefficient of determination) measures how well the model's predicted values match the actual values. Higher is better. It ranges from 0 to 1, where 1 is a perfect fit and 0 is no fit at all. R² accounts for the variation in the actual values and how much of that variation the model explains, so a higher R² means the model tracks the data more closely.
MAPE
MAPE (mean absolute percentage error) measures how far the model's predicted values are from the actual values, as a percentage of the actual value. Smaller is better. For example, if the model predicted 100 sales and the actual number was 110, the error is roughly 10%. MAPE averages that error across the period, so it tells you how accurate the model is on average.
Bias
Bias measures whether the model systematically over- or under-predicts, expressed as a percentage. It is the average signed error: a positive value means the model tends to predict too high across the period, and a negative value means it tends to predict too low. A bias close to 0% is what you want, because it means there is no systematic skew in either direction. Bias is different from MAPE, which measures the size of the errors regardless of direction.
Max APE
Max APE (maximum absolute percentage error) is the single largest percentage error across the periods in the selected range. Where MAPE tells you the average error, Max APE tells you the worst case. It is useful for spotting one-off periods, such as an unusual promotion or a data gap, that the model did not reproduce well.
Choosing the right granularity
The most important thing to understand when reading these metrics is the level you are looking at. You can view validation by day, week, month, quarter, or year, at the total level or broken down by segment. Fit naturally looks tighter at coarser levels and looser at finer ones. This is expected, and it reflects the data rather than a fault in the model: a smaller slice of the business contains fewer sales, so ordinary day-to-day randomness makes up a much larger share of what you see. When only a handful of orders happen in a market on a given day, the movement is mostly random, and no model can (or should) predict it. Aggregating over a larger area or a longer period averages that noise out.
For this reason, Sellforte evaluates fit primarily at the weekly and monthly level, at the total level and for larger segments, because those are the levels relevant for planning decisions. As a rule of thumb, a weekly R² above 0.85 is considered good.
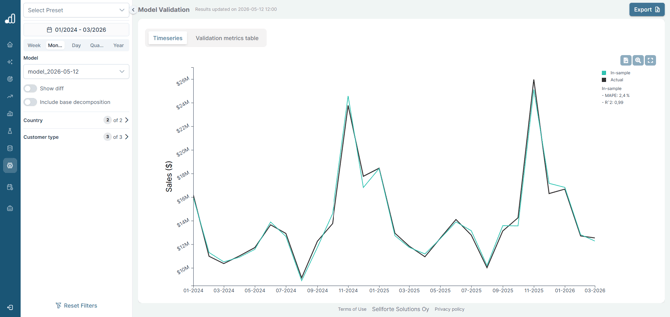
Fit should still be reviewed at the level where budget decisions are made, not only at the aggregate, because a strong aggregate fit can hide a weaker segment. Genuinely weak segments are worth investigating rather than averaging away. At the same time, the smallest and sparsest slices, for example an individual small market on a daily basis, are noise-dominated and are read as directional rather than treated as pass/fail.
The daily view is mainly a diagnostic aid, used for example to confirm that holidays and store-closure flags have been applied correctly.
Validation: does it hold up outside the model?
A good fit shows the model reproduces history. Validation checks that its conclusions hold up beyond the data it was trained on.
Held-out data and backtesting
One test is to withhold the most recent few months of data before fitting, then compare the model's prediction against what actually happened. Out-of-sample accuracy should be broadly comparable to in-sample: a model that fits well on its training data but poorly on held-out data is likely overfitting or missing an important external driver.
Sellforte's backtesting supports this on an ongoing basis. Rather than only producing a one-off out-of-sample estimate, it takes an earlier model, uses it to predict the period that has since elapsed, and checks that prediction against actual results — so you can see how the model has held up over time.
Experiments (the gold standard)
The strongest validation is a controlled experiment, such as a geo holdout or an A/B budget test. The lift measured by the experiment is compared against the model's estimate for the same channel, market, and period. Experiment results are stored in Sellforte's experiment library and combined into an incrementality estimate for each channel, weighted by how much was spent, how recent the test is, and how statistically significant it was. A new test shifts the estimate in proportion to its weight rather than overwriting earlier evidence.
Cross-checks and stability
- Platform reporting (Google, Meta, and so on) is a useful sanity check but not causal ground truth, because it is shaped by attribution windows and overlap across platforms. A large mismatch between the model and platform reporting is a prompt to investigate, not proof that either is wrong.
- Stability across refreshes: channel ROIs and contributions should stay reasonably stable between model updates, with any large movement explained by a real change in the data or inputs.
- Decomposition plausibility: the baseline share, each channel's contribution versus its spend share, and the ordering of channel ROIs should broadly match the expected roles of the channels. Surprising results are not automatically wrong, but they are worth flagging for an incrementality test.
What "excellent" looks like
Fit is assessed at weekly and monthly level for the total and larger segments. Daily and small-segment figures are read as a diagnostic rather than as pass/fail.
| Check | Where it applies | Target |
|---|---|---|
| R² | Weekly / monthly, total and larger segments | ≥ 0.85 (weekly) |
| MAPE | Weekly / monthly, total and larger segments | ≤ 10% (weekly), ≤ 5% (monthly) |
| Bias | Weekly / monthly | Within ±1% |
| Max APE | Weekly / monthly | ≤ 25% (weekly), ≤ 15% (monthly). Read as a diagnostic rather than as pass/fail. |
| Held-out accuracy | Recent held-out window | Comparable to in-sample |
| Estimation convergence | Model level | Converged / stable |
Thresholds reflect Sellforte's internal validation standards. Finer granularities are read with more tolerance for the reasons set out above.
How to evaluate and validate a model
- Start at the total, weekly and monthly level. Strong fit here is the primary sign that the data and the model are sound.
- Look beyond R² and MAPE. Bias flags whether the model is systematically off in one direction; Max APE flags individual periods worth a closer look.
- Review fit at the level you plan on. Investigate genuinely weak segments; read the smallest, sparsest slices as directional rather than pass/fail.
- Check it holds out of sample. Held-out accuracy and backtesting confirm the model is not just fitting history.
- Confirm the causal results against experiments. Geo lift and other controlled tests are the gold standard, with platform reporting as a supporting sanity check.
- Look for stability and plausibility. Results should stay consistent across refreshes, and the baseline-vs-channel decomposition should make business sense.
Remember the core distinction: a strong fit (evaluation) tells you the model reproduces your sales; the validation steps tell you its conclusions can be trusted for decisions.