
What you can do with experiments in Sellforte MCP
Sellforte MCP lets you explore your incrementality tests in plain language, inside Claude, ChatGPT or another MCP client. You can find experiments, compare their results, understand how a test was designed and view its result charts in the conversation.
Supported experiment types are Conversion Lift, GeoLift, A/B Test and Other. Experiments access is read-only: you can read and analyze existing tests, but you cannot create, edit or launch a test through the MCP.
| You can ask for | What comes back |
|---|---|
| An overview of your experiments | A list of tests, their status, dates and headline results |
| A summary of your testing activity | Counts by experiment type, status, platform or country |
| A comparison of selected tests | Results ranked by measures such as test iROAS, spend or confidence |
| An explanation of one experiment | Available lift metrics, uncertainty, test design and a link to the experiment in Sellforte |
| Result charts | Interactive charts for the selected experiment, where available |
| A comparison with your Marketing Mix Model | Experiment results alongside MMM results for the corresponding channel and scope |
Before you start
Connect Sellforte MCP to your LLM client using Connecting Sellforte MCP to your LLM client. Your session can access experiments in the Sellforte organization you connected to, within your permissions.
Use the experiment names, platforms and markets in your own environment when trying the prompts below. The assistant checks which filters and values are available before searching. If a requested value cannot be matched, the MCP returns an error so it can be clarified.
Demo examples: the figures in this article come from tests in Sellforte's internal development demo environment, checked on October 1, 2026. They illustrate how to read an answer and are not customer results. Available fields and charts depend on the experiment.
Listing experiments and summarizing what you learned
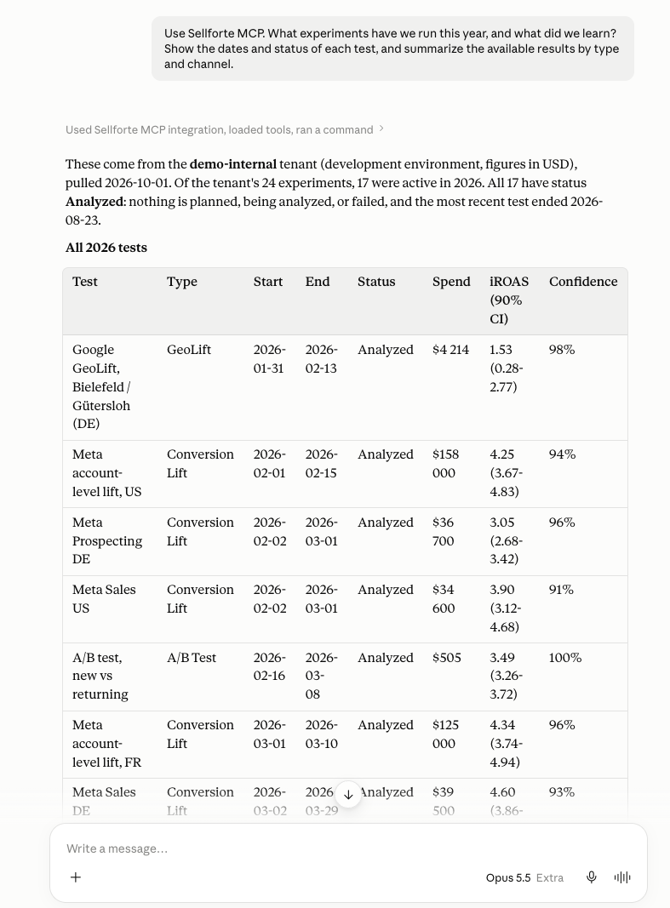
Start with a period and ask for an overview. The list can include each experiment's type, status, dates, spend, test iROAS and confidence. Ask the assistant to read individual experiments when you want an explanation of their findings.
Example prompt: "What experiments have we run this year, and what did we learn? Show the dates and status of each test, and summarize the available results by type and channel."
Other example prompts:
- "List all analyzed experiments active between January 1 and September 30, 2026."
- "Show the experiments I created, with their current status."
- "List all experiments I can access, including tests created by my colleagues."
Counting experiments by type, status or market
For a quick overview of testing activity, ask for counts without the individual experiment rows. Counts are available by type, status, platform and country, including experiments where the selected value is missing.
Example prompt: "How many experiments can I access, grouped by experiment type? Give me the counts only and include any experiments with no type recorded."
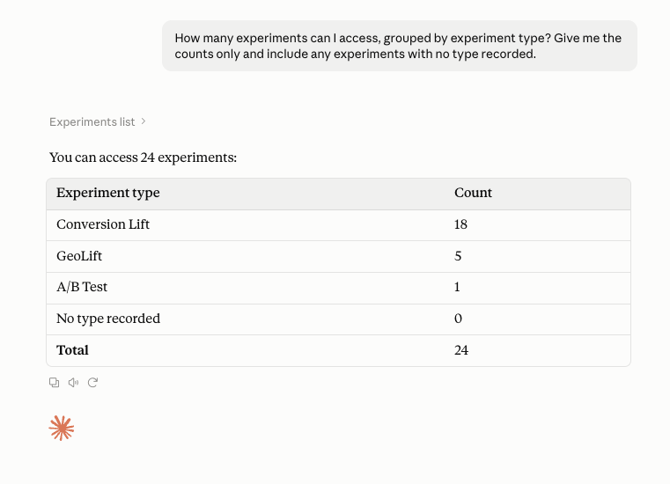
You can also ask: "Count our experiments by status" or "How many tests do we have in each country?" The available statuses are Planned, Analyzing, Analyzed and Failed.
Finding, ranking and comparing tests
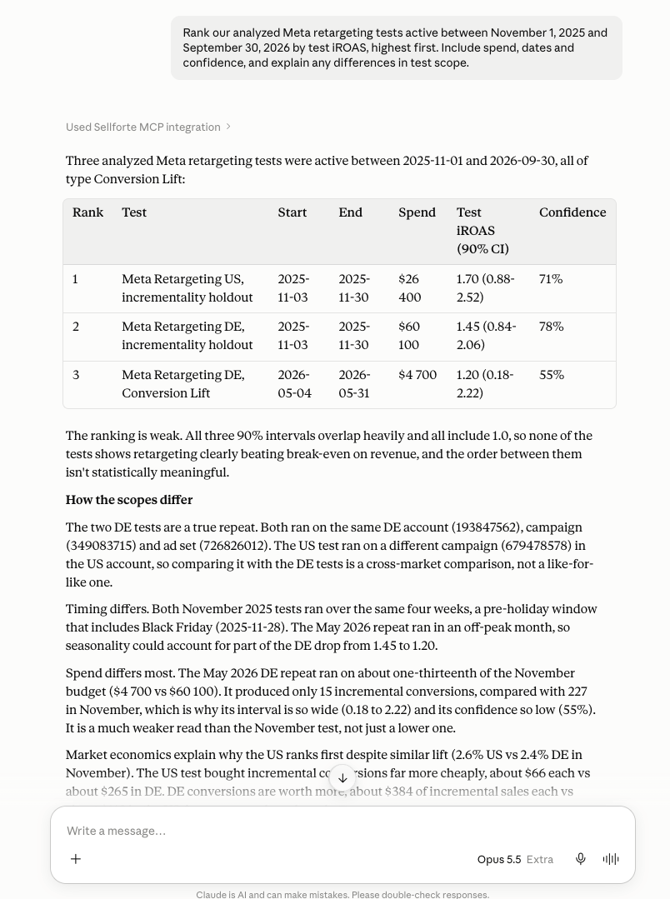
Combine filters to find comparable experiments. For example, narrow a search to a platform, a name containing "retargeting" and a date window, then rank the results by test iROAS.
Example prompt: "Rank our analyzed Meta retargeting tests active between November 1, 2025 and September 30, 2026 by test iROAS, highest first. Include spend, dates and confidence, and explain any differences in test scope."
| Filter | How to use it |
|---|---|
| Status and experiment type | "Analyzed Conversion Lift tests" or "Planned GeoLifts" |
| Platform and country | "Meta tests in Germany" |
| Account, campaign or ad set ID | Provide the specific ID to find experiments covering that media |
| Name | Search for a word or phrase in experiment names, such as "retargeting" |
| Date window | Find experiments active during a specified period |
| Model dimension | Use the dimensions available in your environment; the demo's Google Ads GeoLifts use this tagging |
| Ownership and access | Ask for tests you created or all tests you can access |
You can sort by name, type, status, start or end date, spend, test iROAS, confidence, creator or last modified date. For example: "Show the most recently updated experiments" or "Rank our analyzed tests by spend."
Understanding one experiment's results
Name an experiment to retrieve its results and design. You can ask which media it covers, what outcome it measured, how uncertain the estimate is and for a link to open the experiment in Sellforte.
Example prompt: "Explain the Meta DE Full-funnel Conversion Lift Aug 2026 experiment. Show the lift, incremental sales and conversions, test iROAS and its confidence interval. Include a link to the experiment in Sellforte."
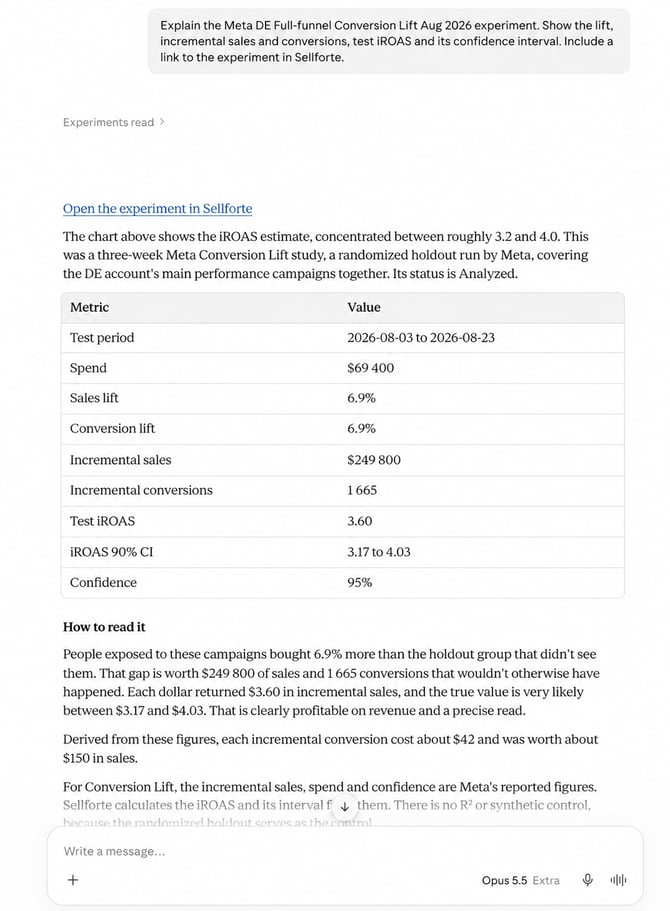
Depending on the experiment, the answer can also include sales lift and conversion lift separately, test iCPA, MMM iROAS, and sales share or conversion share. Missing fields should be identified as unavailable. They should not be treated as zero.
Finding tests that need a closer look
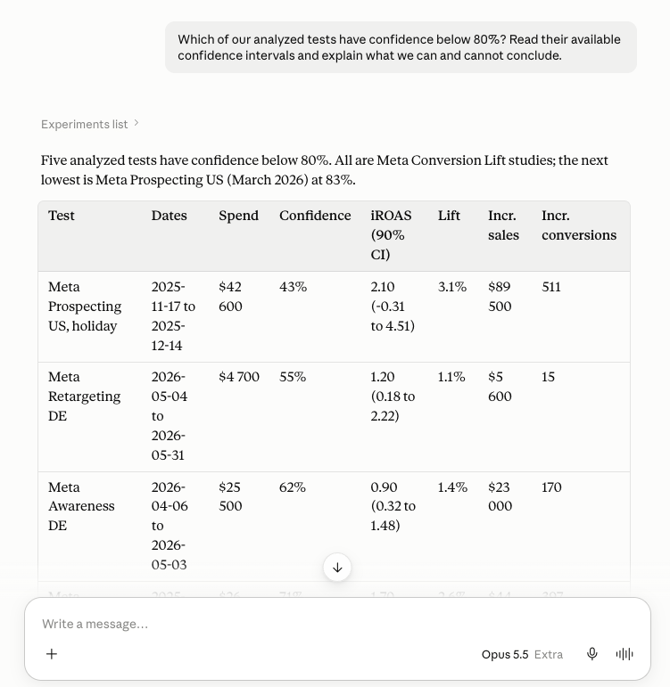
Ask which results are uncertain to identify experiments worth reviewing. Sorting analyzed tests by confidence can surface candidates, then reading each experiment adds the interval and design details needed to interpret it.
Example prompt: "Which of our analyzed tests have confidence below 80%? Read their available confidence intervals and explain what we can and cannot conclude."
Explaining a GeoLift's control group and design
For GeoLifts with the relevant data, you can inspect the test and control regions, their weights and the model fit statistics. Available design details can include the number of observations and predictors, the pretreatment start date and cooldown days.
Example prompt: "Explain the Bielefeld / Gutersloh GeoLift: how was the control built and how sure are we? Show the control regions and weights, R squared, observations, headline confidence and the iROAS confidence interval."
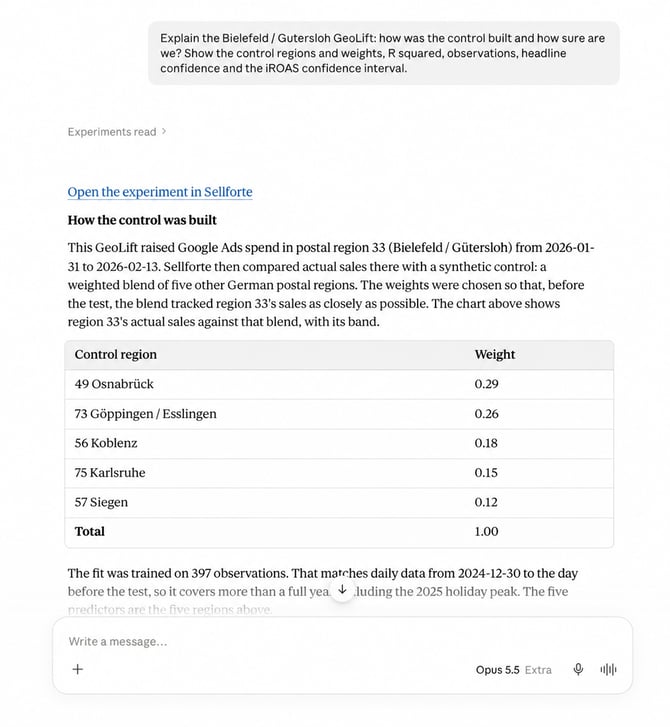
The demo Conversion Lift example did not return these fit statistics or control regions. The assistant can explain the fields available for each test without assuming that every experiment has a GeoLift's diagnostics.
Viewing experiment result charts
After selecting an experiment, ask for one of its available charts. Sellforte renders an interactive chart inside supported clients. You can refer to the previous result with a follow-up such as "that test."
Example prompt: "Show me the target KPI versus scaled counterfactual chart for that test, including the uncertainty band."
| Available chart type | Example follow-up prompt |
|---|---|
| Target KPI vs scaled counterfactual | "Show the KPI against its scaled counterfactual." |
| Cumulative treatment effect on KPI | "Show the cumulative treatment effect on the KPI." |
| Target media investment vs scaled counterfactual | "Show media investment against its scaled counterfactual." |
| Cumulative treatment effect on media investment | "Show the cumulative treatment effect on media investment." |
| iROAS or iCPA over time | "Show the return or cost per incremental acquisition over time." |
| iROAS probability distribution | "Show the iROAS probability distribution for this experiment." |
The KPI comparison and iROAS-over-time charts include uncertainty bands. In the demo, the Bielefeld / Gutersloh GeoLift had all six charts. The Meta Conversion Lift had only the iROAS probability distribution chart. Ask "Which charts are available for this experiment?" if you are unsure.
The charts are displayed for you to inspect. The assistant bases its explanations on the experiment's returned result fields; it does not receive the underlying chart series to read exact values or infer changes from the curve.
Comparing experiment results with MMM
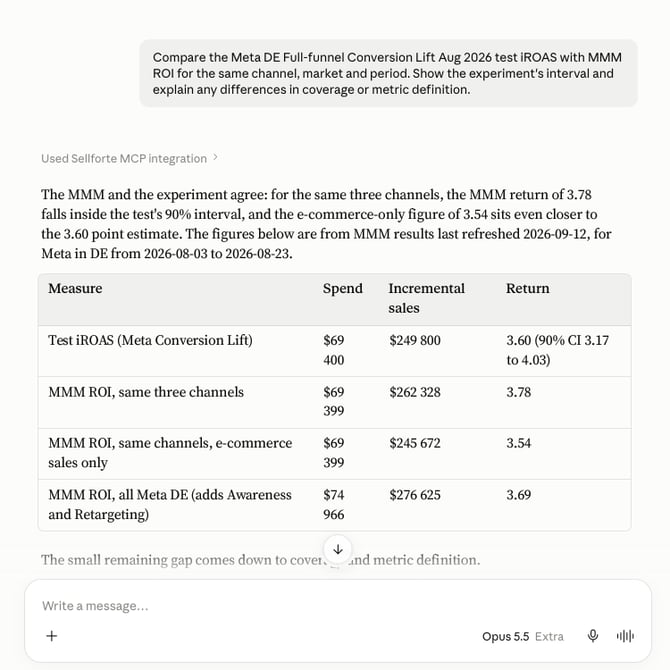
The same MCP connection can retrieve Marketing Mix Model results, so you can compare a test's iROAS with the MMM return for the corresponding channel. The experiment may already include an MMM iROAS field; a reporting query can provide further context.
Example prompt: "Compare the Meta DE Full-funnel Conversion Lift Aug 2026 test iROAS with MMM ROI for the same channel, market and period. Show the experiment's interval and explain any differences in coverage or metric definition."
For more reporting examples, see Marketing Reporting with Sellforte MCP.