


A directed acyclic graph (DAG) is a graph of nodes connected by arrows, in which no path of arrows leads back to its starting node. In causal analysis, nodes are variables and an arrow from A to B means A is assumed to cause B. In marketing, DAGs show how media, demand and other factors are assumed to drive sales.
DAGs are a core tool of causal inference and closely tied to the concept of causality. Their use for identifying causal effects was formalized by Pearl (2009), and Hernán and Robins (2020) give an applied introduction.
Example of a directed acyclic graph
Branded search is a classic case where a DAG changes the analysis. Branded search spend has a direct effect on sales. But the number of people searching for the brand depends on seasonal demand and on awareness media such as TV or Meta awareness campaigns, which also affect sales directly. A data scientist building a marketing mix model (MMM) might start with a DAG like the one below.
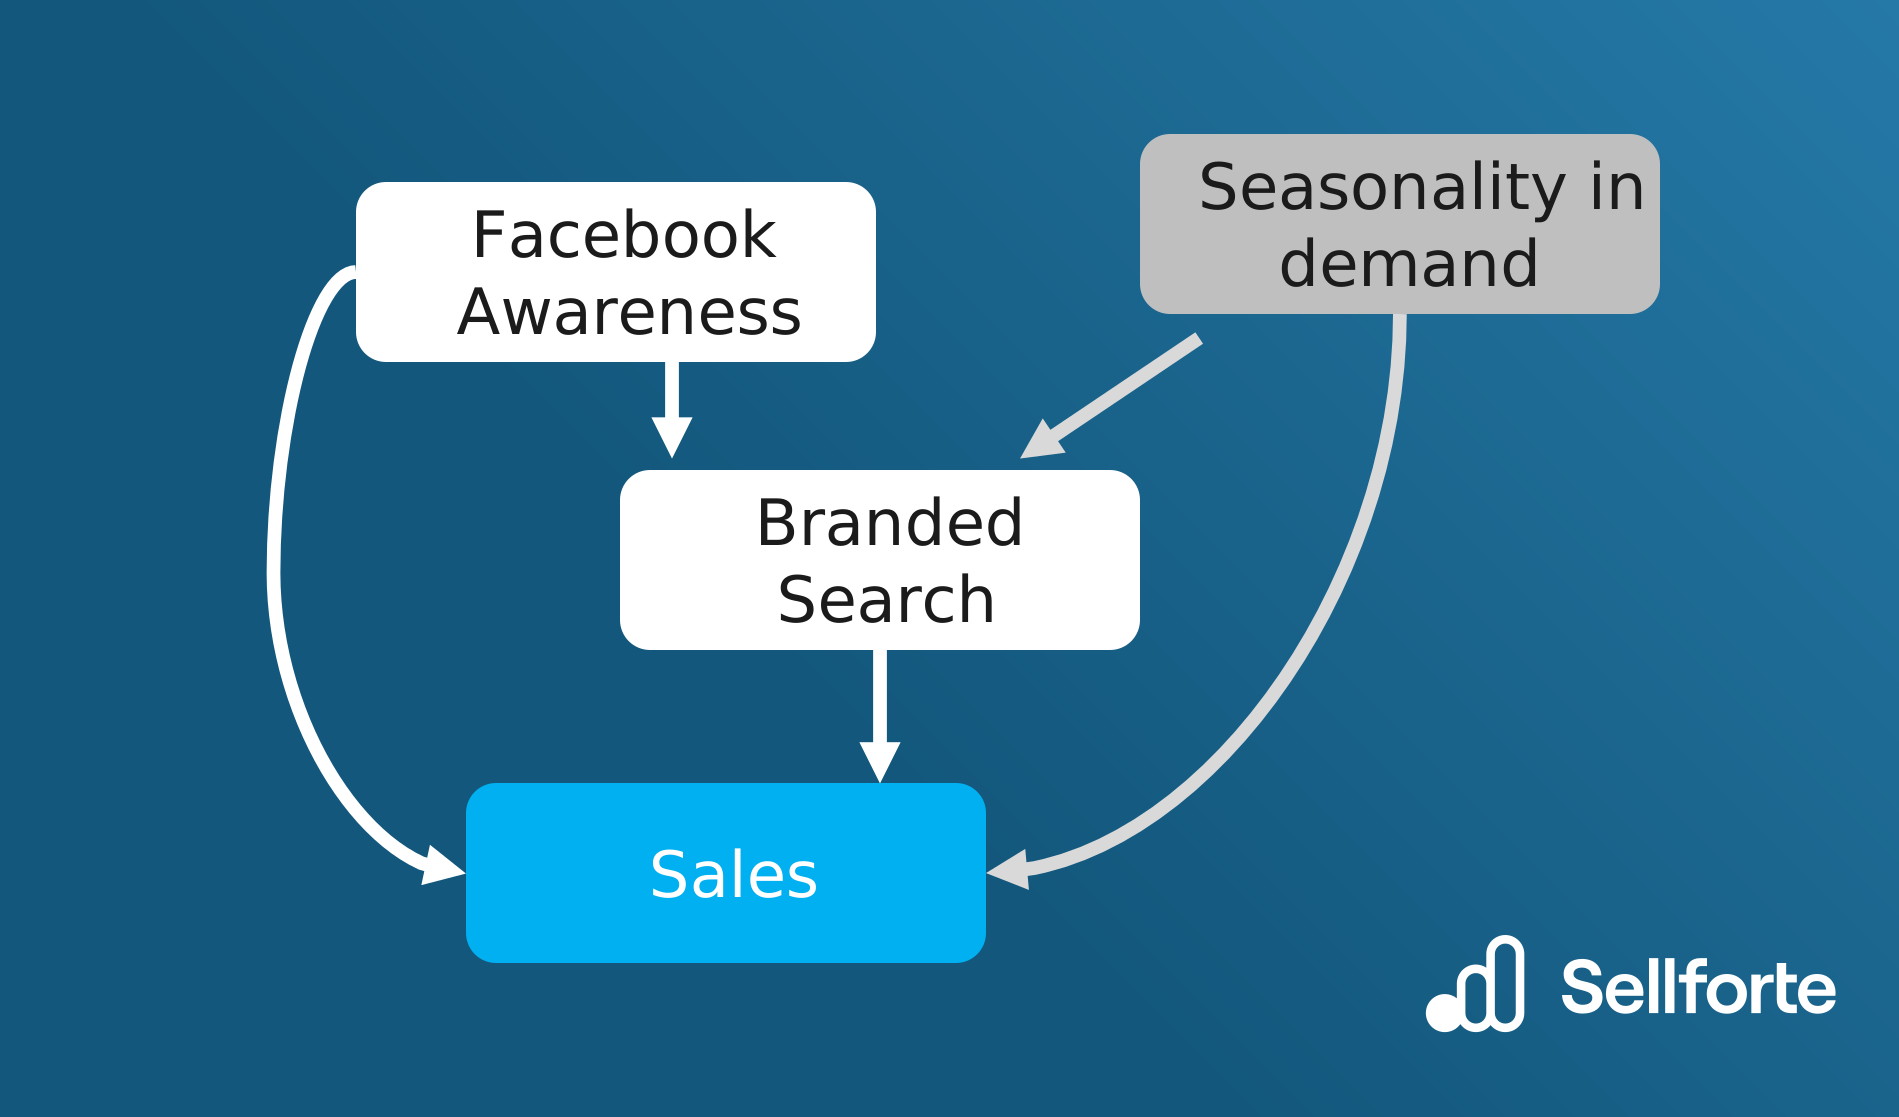
Key characteristics
Directed: every edge has a direction, from cause to effect.
Acyclic: you cannot follow the arrows from a node back to itself. Feedback over time, such as sales this month influencing budgets next month, is represented by separate nodes for each period.
Assumptions made visible: a missing arrow is a strong assumption that one variable does not directly cause the other. The graph encodes domain knowledge; it is not estimated from correlations alone.
Confounders, mediators and colliders
A DAG shows which variables a model must control for and which it must not. Three basic structures matter most (Pearl, 2009; Hernán & Robins, 2020):
- Confounder (fork): TV spend ← seasonal demand → sales. Retailers raise TV spend before peak season, when sales rise anyway. Without controlling for seasonality, the model credits TV with sales that seasonal demand would have produced. Confounders must be included in the model.
- Mediator (chain): TV → branded searches → sales. Part of TV's effect works through people searching for the brand. If the model controls for branded search when estimating TV's effect, it blocks this path and understates TV's total effect, and credits branded search with demand TV created. To measure the total effect of TV, do not control for its mediators.
- Collider: ad exposure → site visit ← purchase intent. Both ad exposure and existing purchase intent lead people to visit the site. Analyzing only site visitors conditions on the collider and creates a spurious association: among visitors, those who were not exposed to ads tend to have higher intent. Hernán and Robins treat this kind of selection bias as conditioning on a collider. Do not condition on colliders.
The general rule, Pearl's back-door criterion, is to control for a set of variables that blocks every non-causal path from the treatment to the outcome without blocking causal paths or opening new ones through colliders (Pearl & Mackenzie, 2018).
DAGs in marketing mix modeling
In MMM, a DAG decides which variables enter the model and how. Seasonality, prices, promotions and macroeconomic factors are confounders to include. Branded search and other demand capture channels are partly mediators of upper-funnel media, so the model must decide how to attribute their sales: to the search ads themselves or to the media that created the searches.
The DAG is the conceptual layer; the statistical model implements it. Sellforte's causal MMM uses a hierarchical Bayesian model whose structure follows the causal graph, with priors and experiment results used to constrain the estimates. See What is causal marketing mix modeling?
DAGs in experiments
When designing an incrementality test, a DAG helps identify which variables could bias the comparison, such as differences in seasonality between test and control regions, and which outcome to measure so that indirect effects, such as TV driving branded search, are captured.
Limitations
A DAG is only as good as the domain knowledge behind it. A wrong or missing arrow leads to the wrong control set and biased estimates, and the data alone usually cannot confirm the graph. DAGs therefore work best together with experiments that test their key assumptions.
Key takeaways
- A DAG makes causal assumptions explicit and tells the analyst which variables to control for.
- Control for confounders, not for mediators or colliders.
- In MMM, the DAG explains why branded search and upper-funnel media must be modeled together.
Related terms
Further reading on Sellforte
- What is causal marketing mix modeling?
- Should you include branded keyword paid search spend in MMM?
- The spillover effect: how TV affects search engine marketing
References
- Hernán, M. A., & Robins, J. M. (2020). Causal inference: What if. Chapman & Hall/CRC. https://miguelhernan.org/whatifbook
- Pearl, J. (2009). Causality: Models, reasoning, and inference (2nd ed.). Cambridge University Press. https://doi.org/10.1017/CBO9780511803161
- Pearl, J., & Mackenzie, D. (2018). The book of why: The new science of cause and effect. Basic Books. http://bayes.cs.ucla.edu/WHY/
Authors

Lauri Potka is the Chief Operating Officer at Sellforte, with over 15 years of experience in Marketing Mix Modeling, marketing measurement, and media spend optimization. Before joining Sellforte, he worked as a management consultant at the Boston Consulting Group, advising some of the world’s largest advertisers on data-driven marketing optimization. Follow Lauri in LinkedIn, where he is one of the leading voices in MMM and marketing measurement.


