


Multi-touch attribution (MTA) is a marketing measurement method that splits the credit for each conversion across the tracked ad interactions, such as clicks and views, that a customer had before converting. MTA uses user-level path data and either fixed rules or a statistical model, so it shows which touchpoints appear in converting journeys rather than what they caused.
How multi-touch attribution works
An MTA system collects touchpoints at the user or device level, such as ad clicks, loggable ad views, email clicks and site visits, and links them into paths. An attribution model gives each touchpoint in a converting path a weight. The weights for one conversion add up to one, so the model distributes the tracked conversion value without adding any:
Attributed revenue of channel c = Σi (Conversion valuei × Weighti,c)
- Conversion valuei: the revenue of tracked conversion i.
- Weighti,c: the share of conversion i that the model gives to channel c. In each conversion path, the weights sum to 1.
Attributed ROAS for a channel is its attributed revenue divided by its spend. Single-touch models are special cases: first click and last click give a weight of 1 to a single touchpoint. For how MTA compares with marketing mix modeling in practice, see MTA and MMM compared.
Common MTA models
| Model | How credit is assigned |
| Linear | An equal share to every touchpoint in the path |
| Time decay | More credit to touchpoints closer to the conversion, usually with a set half-life |
| Position-based (U-shaped) | Typically 40% each to the first and last touchpoint, with the remaining 20% split across the touchpoints in between |
| Data-driven (algorithmic) | Weights estimated from converting and non-converting paths, for example with logistic regression, Shapley values or Markov chains |
Rule-based models are easy to explain but arbitrary: the 40/20/40 split is a convention, not an estimate. Data-driven models learn the weights from the data. An early example, Shao and Li (2011), used a bagged logistic regression and a simple probabilistic model to compare converting and non-converting paths. Anderl et al. (2016) modeled customer paths as Markov chains on four large datasets from different industries and found channel values that differed substantially from heuristics such as last-click attribution.
Ad platforms have moved the same way. In Google Ads, data-driven attribution uses the advertiser's own conversion data to calculate the contribution of each ad interaction across the conversion path (Google Ads Help, n.d.-b). In 2023, Google retired the first click, linear, time decay and position-based models in Google Ads and Google Analytics 4, leaving data-driven and last click (Google Ads Help, n.d.-a).
Example calculation
A customer clicks a Meta ad, then a generic search ad, then a link in a newsletter, and finally a brand search ad before placing a 200 EUR order. Three models split the same order as follows:
| Touchpoint | Last click | Linear | Position-based (40/20/40) |
| 1. Meta ad click | 0 EUR | 50 EUR | 80 EUR |
| 2. Generic search ad click | 0 EUR | 50 EUR | 20 EUR |
| 3. Newsletter click | 0 EUR | 50 EUR | 20 EUR |
| 4. Brand search ad click | 200 EUR | 50 EUR | 80 EUR |
| Total credited | 200 EUR | 200 EUR | 200 EUR |
The models disagree on who gets the credit, but every one of them divides the same 200 EUR. None asks whether the order would have happened anyway, for example whether a customer who typed the brand name into a search engine would have bought without the brand search ad. That is a question about incrementality, and answering it needs an estimate of the counterfactual: what sales would have been without the ad.
Limitations of multi-touch attribution
- Correlation, not causation. Touchpoints follow purchase intent. Customers close to buying click more ads, especially brand search and retargeting ads, so these collect credit they did not necessarily earn. Comparing 15 large advertising experiments at Facebook with observational methods, Gordon et al. (2019) found that commonly used approaches based on the data usually available in the industry often fail to measure the true effect of advertising accurately. Dalessandro et al. (2012) made the same point from the modeling side: when the causal assumptions do not hold, attribution weights should be read as variable importance measures, not causal effects.
- Gaps in the path. TV, out-of-home, print, audio and many video and social impressions leave no user-level click trail, and cookie restrictions, consent choices and cross-device journeys break paths that belong together. Channels that work through exposure rather than clicks are under-credited.
- Walled gardens and double counting. Large ad platforms do not share user-level impression data with outside tools, so an independent MTA sees mostly clicks, while each platform credits conversions with its own rules. The same order can be claimed by several platforms.
- Online only. Path data usually ends at the website or app, so store sales driven by advertising are missing.
- Incentives. In a game-theoretic analysis, Berman (2018) showed that last-touch attribution over-incentivizes ad exposures and can lower advertiser profits, and that Shapley-value attribution increased profits compared with last touch.
MTA, marketing mix modeling and incrementality testing
Marketing mix modeling (MMM) and incrementality experiments, such as a conversion lift study, estimate what advertising caused and report it as incremental ROAS (iROAS). MTA reports attributed ROAS. The three answer different questions:
| Method | Data | Strength | Main limitation |
| Multi-touch attribution | User-level paths of tracked touchpoints | Fast, granular detail on campaigns, ad sets and keywords | Not causal; misses untracked exposures and offline sales |
| Marketing mix modeling | Aggregate spend, sales and other drivers over time | Covers all channels, including offline media and store sales; estimates iROAS | Less granular; depends on model assumptions |
| Incrementality experiments | Randomized or geo-based test and control groups | Most direct causal estimate | One channel, market and period at a time |
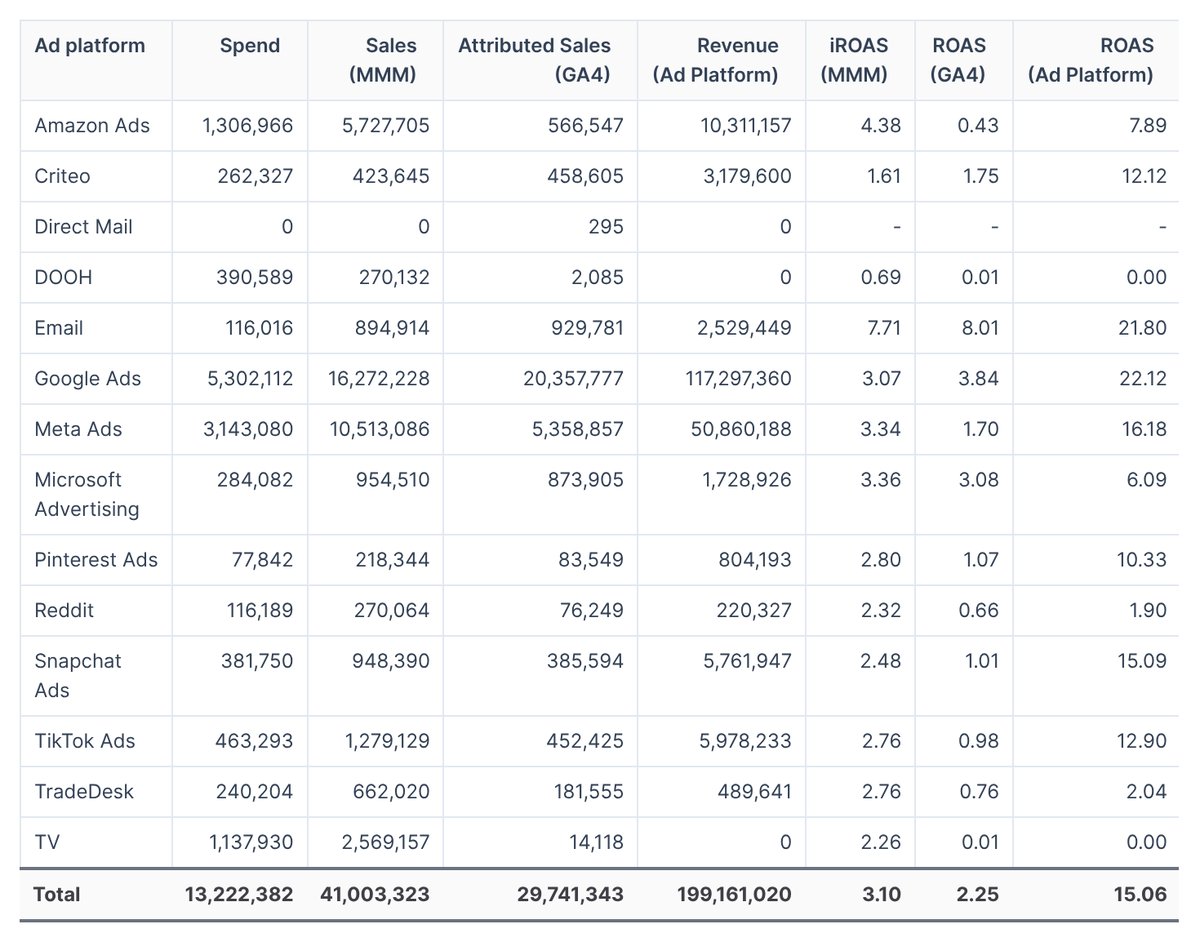
The table below from the Sellforte demo (demo data) shows how far the views can diverge over the same 14 weeks. GA4 attribution credits the ad platforms with 29.7 million in sales and the platforms' own reporting claims 199.2 million, while the MMM estimates 41.0 million of incremental sales. TV and DOOH get almost no credit from click-based attribution (GA4 ROAS of 0.01) although the model estimates an iROAS of 2.26 and 0.69, and Amazon Ads has a GA4 ROAS of 0.43 against an iROAS of 4.38.
Because each method has blind spots, many teams combine them in unified marketing measurement. A common bridge is incrementality calibration: an incrementality factor from MMM or an experiment is applied to attributed results, so that estimated iROAS = attributed ROAS × incrementality factor. The guide to calibrating MTA with incrementality walks through the calculation. Sellforte's own MTA capability works this way, calibrating granular attribution with evidence from experiments and MMM, as described in the Sellforte Incremental Pixel announcement.
Used this way, MTA keeps what it does well: fast feedback on which keywords, creatives and ad sets appear in converting paths. Use its numbers for comparisons within a channel, and MMM and experiments to decide how much each channel adds.
Key takeaways
- Multi-touch attribution splits each tracked conversion across the touchpoints in its path. Rule-based models use fixed weights, and data-driven models estimate them from path data.
- Every MTA model redistributes observed conversions; none estimates what would have happened without the ads, so attributed ROAS is not iROAS.
- MTA misses untracked exposures, walled-garden impressions and offline sales, so it tends to under-credit upper-funnel and offline media.
- Calibrate MTA with incrementality factors from MMM or experiments, and use it for granular decisions within channels.
Related terms
- Incrementality
- Return on Advertising Spend (ROAS)
- Conversion lift study
- Counterfactual
- Unified marketing measurement
Further reading on Sellforte
- MTA and MMM compared: which one is better for you?
- Calibrating MTA with incrementality: From attributed ROAS to incremental ROAS
- Incremental Attribution: What it is and how to use it
- When should an omnichannel retailer use MMM, MTA, or incrementality testing?
References
- Anderl, E., Becker, I., von Wangenheim, F., & Schumann, J. H. (2016). Mapping the customer journey: Lessons learned from graph-based online attribution modeling. International Journal of Research in Marketing, 33(3), 457–474. https://doi.org/10.1016/j.ijresmar.2016.03.001
- Berman, R. (2018). Beyond the last touch: Attribution in online advertising. Marketing Science, 37(5), 771–792. https://doi.org/10.1287/mksc.2018.1104
- Dalessandro, B., Perlich, C., Stitelman, O., & Provost, F. (2012). Causally motivated attribution for online advertising. In Proceedings of the Sixth International Workshop on Data Mining for Online Advertising and Internet Economy (ADKDD '12) (Article 7). ACM. https://doi.org/10.1145/2351356.2351363
- Google Ads Help. (n.d.-a). About attribution models. Retrieved November 18, 2026, from https://support.google.com/google-ads/answer/6259715
- Google Ads Help. (n.d.-b). About data-driven attribution. Retrieved November 18, 2026, from https://support.google.com/google-ads/answer/6394265
- Gordon, B. R., Zettelmeyer, F., Bhargava, N., & Chapsky, D. (2019). A comparison of approaches to advertising measurement: Evidence from big field experiments at Facebook. Marketing Science, 38(2), 193–225. https://doi.org/10.1287/mksc.2018.1135
- Shao, X., & Li, L. (2011). Data-driven multi-touch attribution models. In Proceedings of the 17th ACM SIGKDD International Conference on Knowledge Discovery and Data Mining (pp. 258–264). ACM. https://doi.org/10.1145/2020408.2020453
Authors

Lauri Potka is the Chief Operating Officer at Sellforte, with over 15 years of experience in Marketing Mix Modeling, marketing measurement, and media spend optimization. Before joining Sellforte, he worked as a management consultant at the Boston Consulting Group, advising some of the world’s largest advertisers on data-driven marketing optimization. Follow Lauri in LinkedIn, where he is one of the leading voices in MMM and marketing measurement.


